

Sample Category Title
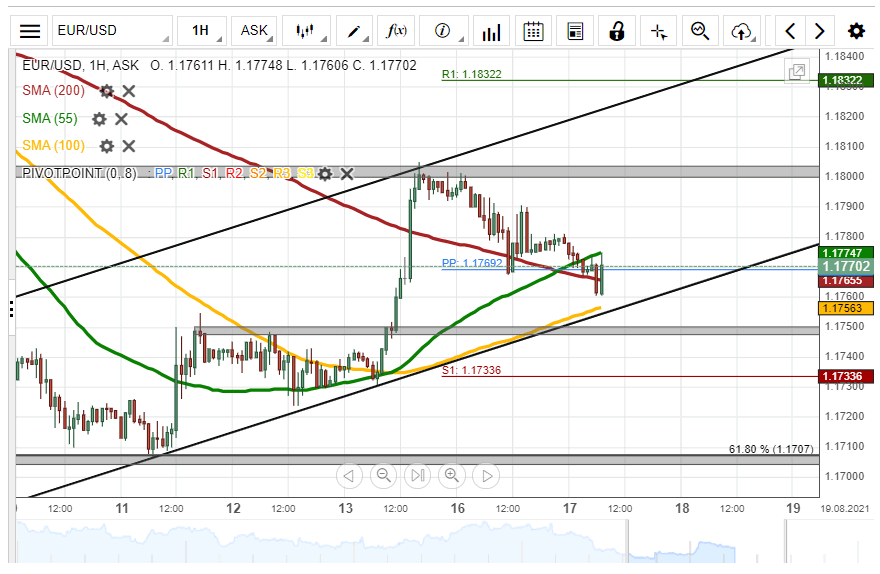
EUR/USD Decline Likely To Continue
On Monday, the common European currency declined by 28 pips or 0.24% against the US Dollar. The decline was stopped by the weekly pivot point at 1.1766 during Monday's trading session.
All things being equal, the exchange rate could continue to edge lower during the following trading session. The potential target for the EUR/USD currency pair will be near the 1.1750 area.
However, bearish traders might encounter support near the 200– hour simple moving average at 1.1767 within this session.
GBP/USD Likely To Maintain Channel
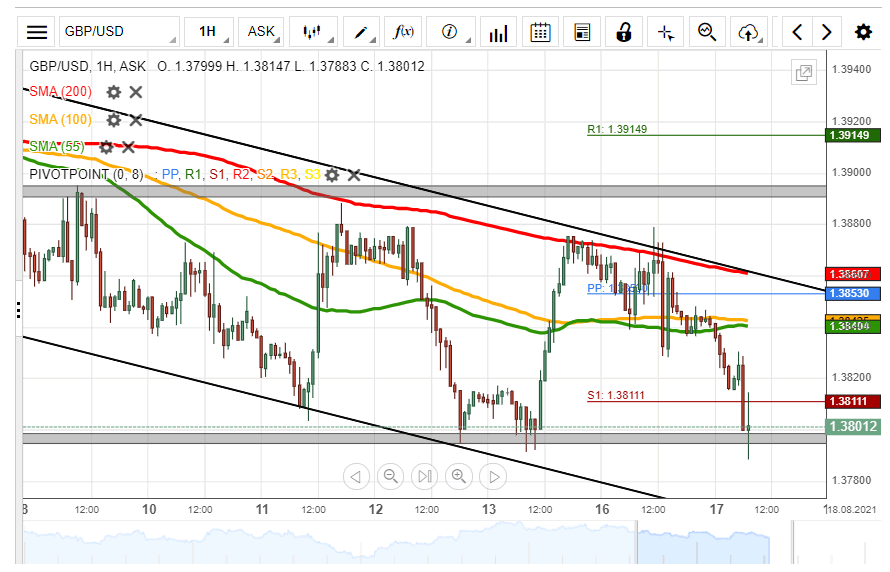
The 200– hour simple moving average pressured the GBP/USD currency pair on Monday. As a result, the Pound Sterling declined by 44 pips or 0.31% against the US Dollar.
Everything being equal, the exchange rate could continue to decline in a descending channel pattern during the following trading session. The potential target for sellers will be near the 1.3780 area.
However, the weekly support level at 1.3811 could provide support for the currency exchange rate in the shorter term.
USD/JPY Bears Could Prevail
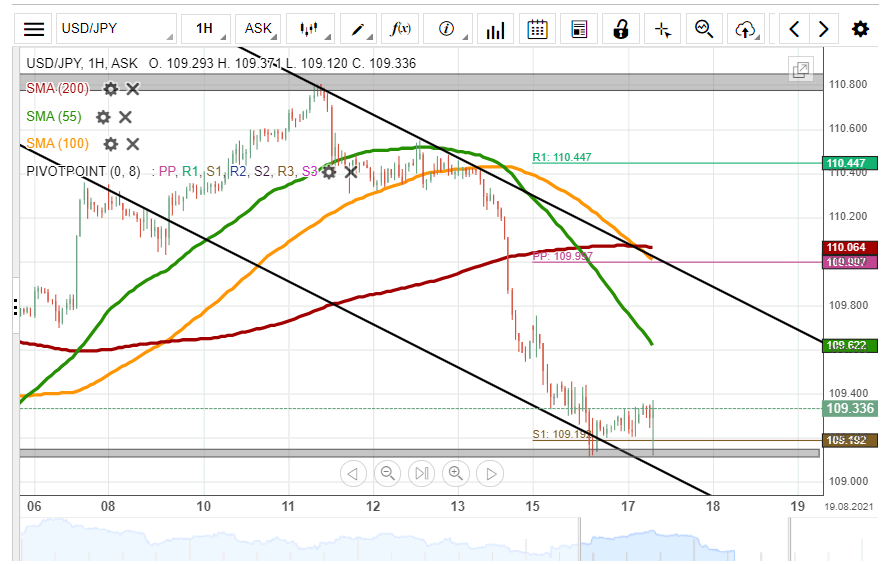
On Monday, the US Dollar edged lower by 56 pips or 0.51% against the Japanese Yen. The currency pair tested the weekly support level at 109.19 during Monday's trading session.
By and large, bears are likely to continue to drive the exchange rate lower during the following trading session. The possible target for bearish traders will be near the weekly S2 at 108.74.
However, the lower boundary of a descending channel pattern could provide support for the currency exchange rate within this session.
XAU/USD Potential Target At 1820.00
Upside risks dominated the XAU/USD exchange rate on Monday. As a result, the yellow metal surged by 174 pips or 0.99% against the US Dollar during Monday's trading session.
Given that the 55-, 100– and 200– hour SMAs are below the commodity, the precious metal's price could continue to trend bullish. Buyers might target the 1820.00 level during the following trading session.
However, bullish traders might encounter resistance at 1800.00 within the following trading session.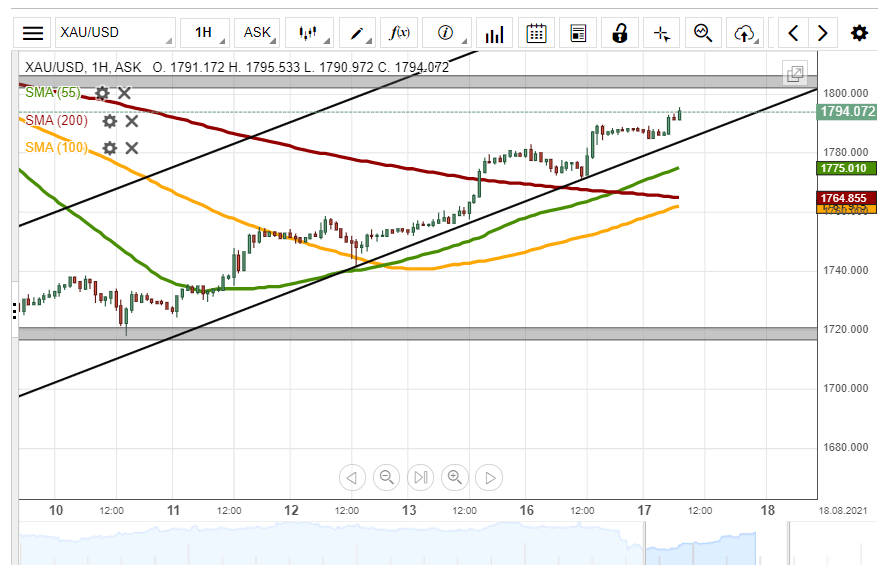
XAUUSD Is Possibly Bullish
Technical analysis
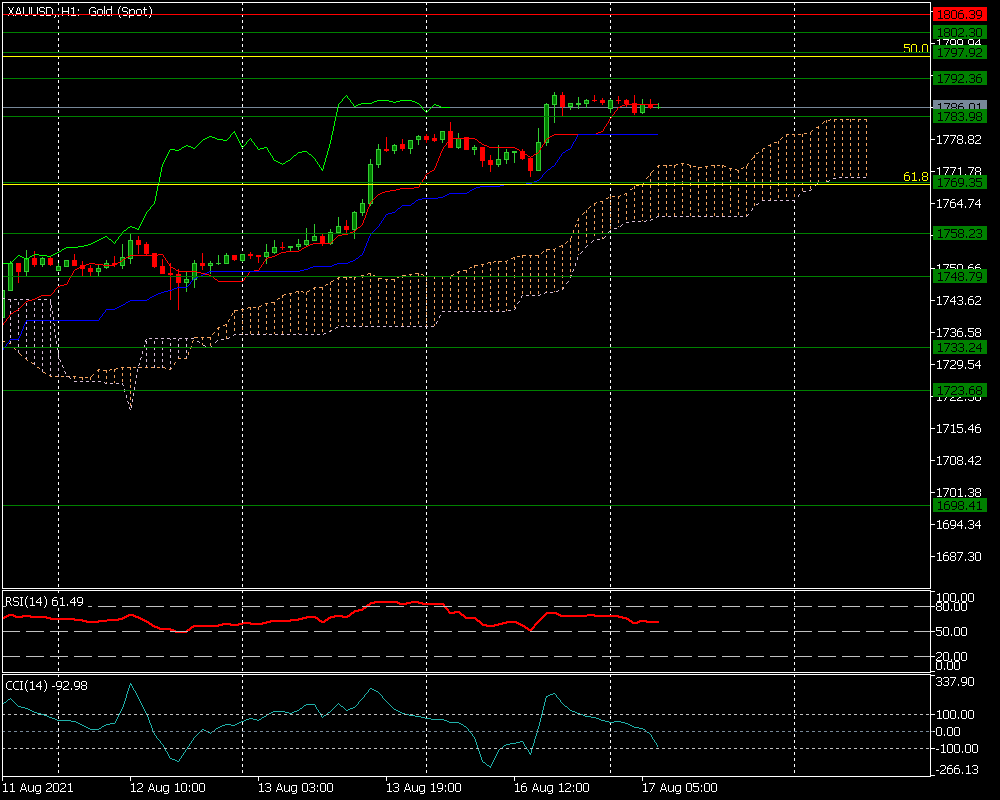
The Ichimoku indicator gives a possible bullish signal
The RSI is above line 50, indicating that an uptrend may prevail.
The CCI suggests a possible downward correction.
What the possible outcomes are
Gold rose for a fourth day as investors turned to the haven asset amid concerns over the delta coronavirus variant and weaker economic data.
In our most likely scenario, XAUUSD may rise towards the first resistance level of 1,792.
If the pair surpasses the first resistance level, we should expect a continued surge towards the resistance levels of 1,797 and 1,802.
Contrarily, the pair may initially decline towards the first support level of 1,783.
If the pair falls below the first support level, we can expect a continued downtrend towards 1,775 and 1,769.
Key levels
Support 1,769 1,775 1,783
Resistance 1,792 1,797 1,802
S&P 500 Index Soars Ahead Of US Retail Earnings
The US dollar index rose slightly in the overnight session as investors reacted to reports that the Federal Reserve was considering exiting its asset purchases next year. According to the Wall Street Journal, the Fed officials plan to start winding down the purchases in the upcoming meetings depending on the strength of the American economy. The currency will later react to a statement by the Fed chair, Jerome Powell. It will also react to the latest US retail sales numbers.
The British pound was little changed ahead of a data dump by the UK. The Office of National Statistics (ONS) will publish the latest UK employment numbers in the morning session today. The numbers are expected to show that the number of claimants declined in July while the unemployment rate remained unchanged at 4.8% in June. Analysts also expect the numbers to show that the average earnings with and without bonuses increased in June. The ONS will then publish the UK inflation numbers on Wednesday and retail sales on Friday.
US stocks soared to a record high as investors largely ignored the crisis in Afghanistan. In a statement, Joe Biden blamed the crisis on the country’s deposed leaders and the military. Equities also rose ahead of key retail earnings. Companies like Target, Walmart, Home Depot, and Lowe’s are expected to publish their quarterly results this week. Analysts expect that the retailers did relatively well in the second quarter as the country reopened.
EURUSD
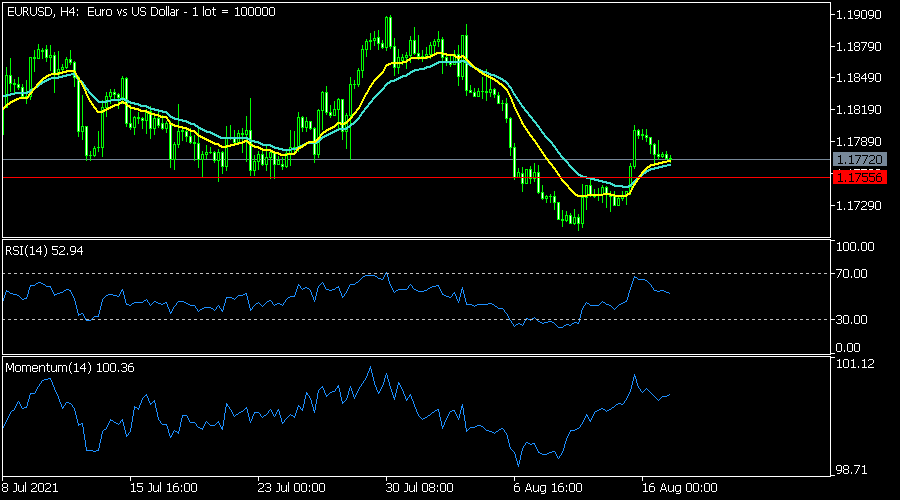
The EURUSD pair was little changed at 1.1770 in the overnight session. This price was substantially higher than this week’s low at 1.1705. On the 4 hour chart, the pair has been at the same place as the 25-day and 15-day moving averages while the momentum oscillator has risen. It is also slightly above the important support at 1.1750 and has formed an inverted cup and handle pattern. Therefore, the pair will likely resume the downward trend before or after the US retail sales data.
AUDUSD
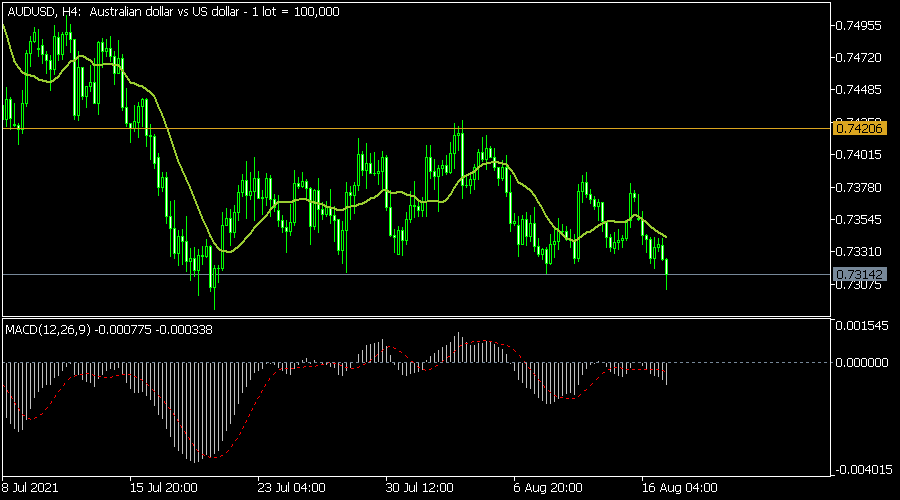
The AUDUSD pair declined slightly after the Reserve Bank of Australia (RBA) published minutes of the recent meeting. The pair fell to a low of 0.7300, which was slightly higher than this month’s high of 0.7420. The pair is below the 25-day moving average while the MACD is below the neutral line. It also seems like it has formed a small head and shoulders pattern. Therefore, the pair may break out lower as bears target the key support at 0.7280.
SPX500
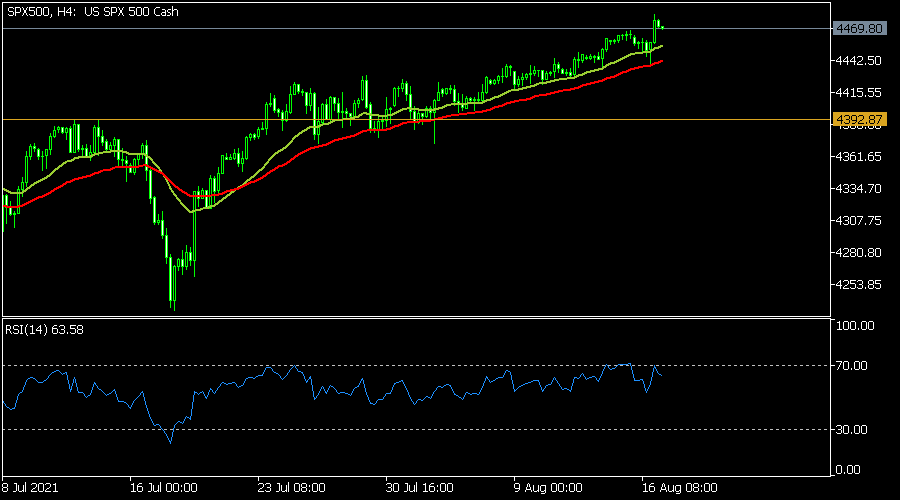
The S&P 500 index rose to an all-time high of $4,482 in the overnight session. On the four-hour chart, the pair remained above the key 25-day and 50-day exponential moving averages. Oscillators like the Relative Strength Index and MACD have also been rising. Therefore, the path of least resistance is still to the upside.
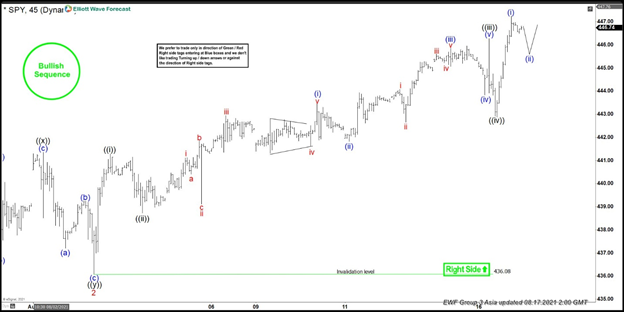
Elliott Wave View: SPY Near Ending Larger Degree Cycle
Short-term Elliott wave view in SPY suggests that the cycle from 19 July 2021 low is unfolding in an impulse sequence favoring more upside extension to happen. Up from that low, the index has ended the first leg in wave 1 at 441.16 high. Then wave 2 pullback unfolded as a double three structure where wave ((w)) ended at 436.86 low. Wave ((x)) bounce ended at 441.37 high and wave ((y)) ended at 436.08low, thus completed the wave 2 pullback.
Above from there, wave 3 remains in progress in lesser degree 5 waves structure where wave ((i)) ended at 441.29. Wave ((ii)) pullback ended at 438.73 low. Wave ((iii)) rally finished at 446.28 and wave ((iv)) pullback as a zig zag structure at 442.88. Near-term, as far as dips remain above wave ((iv)) low at 442.87, expect SPY to extend higher within wave ((v)). Alternatively, SPY could end wave ((v)) of 3 already at 447.25, and the pullback will then become a wave 4 pullback. In the alternate scenario, pullback is expected to hold above wave 2 low at 436.08 for further upside. As far as August 3 pivot at 436.08 low stays intact, expect dips to find support in 3, 7, or 11 swings for further upside.
SPY 45 minutes Elliott Wave chart
Risk Aversion Again Translates Into A Better Bid For Core Bonds And A Firmer Dollar
Markets
Risk aversion dominated for most of yesterday’s Asian and European trading sessions. Geopolitics (Taliban taking control of the Afghan capital Kabul), slowing Chinese growth momentum at the start of Q3, and tighter restrictions in Asia/Down Under to stop the spread of the Delta Covid-variant all soured the mood. Main European stock indices lost 0.5% to 1%. Core bonds thrived with US Treasuries outperforming German Bunds. Safe haven currencies JPY (USD/JPY 109.24 close) and CHF (EUR/CHF 1.0746 close) stood out on the FX market, with the dollar slightly outperforming those other two majors (EUR & GBP). It wasn’t until just before the European close that US stock markets staged a remarkable intraday comeback, without any specific driver. The Dow Jones and S&P 500 overturned opening losses to end 0.3% higher, both setting an umpteenth all-time high. Nasdaq underperformed, losing 0.2% on the day. The sudden risk improvement brought both US Treasuries and the dollar off their best intraday levels. Daily US yield changes eventually ranged between +0.2 bps (2-yr) and -1.6 bps (7-yr) with the belly of the curve outperforming the wings. German yield differences varied between -0.2 bps and +0.2 bps across the curve. EUR/USD closed at 1.1778 from a 1.1784 open.
The largest Asian stock benchmarks this morning defy the WS rebound. This time around, Korean and Chinese indices underperform (-1.5%). Korean markets were closed yesterday while China issued draft rules to target unfair online competition (see below). Risk aversion again translates into a better bid for core bonds and a firmer dollar. New Zealand reported its first new possible community case of Covid-19 since February. It sends a shock wave through NZ markets that completely discounted the start of a tightening cycle at tomorrow’s RBNZ meeting. NZD swap yields drop by 13 bps to 8 bps as the curve bull flattens. NZD/USD drops from 0.7020 towards 0.6950. Today’s eco calendar contains July US retail sales. Consensus expects a modest decline for both the headline (-0.3% M/M) and control group (-0.2% M/M) outcomes. Last Friday’s (August) University of Michigan consumer confidence for the first time suggested that households could start spending less as inflation bites. It’s definitely something to keep a close eye on. Fed chair Powell hosts a town hall discussion with educators but this doesn’t seem the venue to drop big hints on future policy. In the meantime, more Fed governors seem to center around the idea that we’re one strong payrolls report away from a (September) QE tapering announcement. Once the winding down of the current $120bn monthly net purchases starts, the process will likely go much faster than in the previous cycle with some indicating a mid-2022 potential end date. Such scenario strokes with an end 2022 rate hike, which is a wildcard for the updated September Fed dot plot. Near consensus UK labour market data this morning can’t break the deadlock for sterling. EUR/GBP changes hands just north of 0.85.
News headlines
AUD/USD slips towards 0.73 this morning after the RBA published the minutes of its August policy meeting. The central bank back then stuck to a bullish assessment of the economy, although tweaking growth forecasts a little to the downside for the current fiscal year as Australia continues to struggle with virus outbreaks. It also kept its guidance for reducing the pace of bond buying to A$4 bn per week when the current envelope is exhausted in September. The minutes revealed board members discussed to delay the tapering should the virus bring Australia’s recovery off track. While this is not new (the policy statement mentioned this as well), it does grab more market attention in the current atmosphere where Australia as recently as yesterday extended regional lockdowns.
China’s State Administration for Market Regulation published draft rules aimed at preventing unfair online competition in the country’s latest move to tighten its grip on the nation’s internet giants. It follows other measures that have an impact in areas ranging from antitrust to data security and ride-hailing. Chinese (tech) stocks have suffered heavy losses from the rapidly changing and more hostile regulatory environment.
It Only Goes Up
The S&P500 hit its fifth consecutive all-time high on Monday, regardless of the most recent inflation report confirming sticky and high inflationary pressures, and growing Covid worries, which threw the UoM’s sentiment index to a decade low level in August.
But there is no stopping the US equity rally and although it’s disquieting, strong corporate earnings, low US yields and a relatively soft US dollar are the major catalysts for the US market rally. But the cliff between the economic indicators and the equity prices is somewhat unreasonable, hinting that there is potential for a sizeable downside correction. But when?
What could possibly derail the equity rally?
High inflation? Yes and no. High inflation means a sooner Federal Reserve (Fed) tightening, but the Fed’s hawkish shift is mostly digested by investors. We know that the Fed wants to start tapering its bond purchases sooner rather than later because of high inflation and solid jobs data. Therefore, the announcement of Fed tapering will sure dampen the mood but would hardly trigger a 5-10% downside correction across US equities.
A more hawkish Fed? Possibly, yet there is little chance of seeing the Fed do more than start tapering its bond purchases. The first Fed rate hike is scheduled in 2023 and investors will continue surfing on the low US rates for a couple of more months. US equities will remain appetizing as long as the US 10-year yield remains below the 2% mark.
Soft economic data? Well, that’s the most plausible cause for an eventual downside correction in the close future, as the combination of rising Covid cases and soft economic data would mean that the companies must deal with a prolonged period of unfavourable economic conditions, but with less financial support from the Fed which also needs to deal with the high inflation, as a result of the massive cash thrown to the market so far.
Due today, the US retail sales are expected to have retreated by 0.2% m-o-m in July. A slightly negative read may not discourage investors, as the sales jumped 28% y-o-y in March, 51% in April, 28% in May and near 18% in June. Therefore, a minor slowdown in recovery shouldn’t dent the risk appetite. Unless we see a surprisingly negative number, which would point at a faster-than-expected slowdown in recovery, there is nothing that could stop the US stock bulls from flirting with new highs.
Except from the energy stocks, as oil prices remain under a decent selling pressure. We see solid resistance forming above the 100-day moving average, a touch below the $68 per barrel, on the back of worries that the rising Covid delta contagion will likely slow down the global economic recovery and dent prospects of a strong global demand. Technically, the $66 level is an important support as it is the baseline of the positive trend building since March. A move below this level could pave the way for a further downside correction to the $60 pb mark, the 200-day moving average. The latest news and the market sentiment hint that we have a greater chance of seeing a move to the $60 pb level, rather than one back above the $70 pb.
Fed Chair Powell Speaks
Market movers today
- The key market movers today are mainly from the US. A key release is the retail sales for July, which is expected to drop back amid the spreading of the delta variant.
- The US industrial production data for July is also released. The data should show higher production as companies seek to catch up with the order backlog that has emerged over the pandemic.
- This afternoon, Fed Chair Jerome Powell will in a virtual town hall meeting with teachers and students give his verdict on the US economy and monetary policy, but he will probably wait for the Jackson Hole next week to give his verdict on the timing and length of the upcoming tapering of quantitative easing.
- Overnight, the Reserve Bank of New Zealand (RBNZ) is widely expected to hike the official cash rate by 25 basis points on the back of strong domestic economic developments and rapid labor market recovery. Markets have fully priced in the hike along with one additional hike before year-end, which leaves little upside potential for NZD even if RBNZ takes a very hawkish stance.
The 60 second overview
Weakening manufacturing momentum in the US: In the US, the regional cyclical indicator Empire State business dropped back more sharply than expected in August following a significant jump in July. Despite the drop, the indicator still points to expansion. On the price side, prices received edged up while prices paid for inputs fell (suggesting that the commodity price pressures are softening). Finally, delivery times lengthened further suggesting that the supply chain problems are not easing yet.
China data is also weaker than expected: In China, data on industrial production and retail sales disappointed significantly yesterday. Industrial production dropped to 6.4% y/y (consensus 7.9% y/y, previous 8.3% y/y) and retail sales declined to 8.5% y/y (consensus 10.9% y/y, previous 12.1% y/y). Effects of previous policy tightening feeding through in combination with recent new lockdowns and severe flooding are likely the main drivers behind the slowdown. Export growth also seems to be fading judging from PMI's.
Equities: Global equities fell yesterday although US stocks made a big turnaround during the day and ended at day high with a couple of major indices in green. The underlying tone was still slightly negative as investors showed a strong preference for defensive stocks. S&P500 also posted fifth-straight record close yesterday and its 48(!) all-time this year. Health care stocks outperformed with consumer staples while energy was the biggest loser yesterday as oil price dropped further. Asian markets are mostly in red though Japan going against the trend with a small gain. Covid-19 news from Asia are still worsening with Japan set to declare a state of emergency in seven more prefectures. European futures are flat this morning while US futures are 0.2% lower.
FI: The risk appetite was sour yesterday which led to the classical bond market response of lower Bund yields and wider spreads.
FX: EUR/USD and Scandies dropped further yesterday. Despite general risk-off sentiment in markets, EUR/PLN edged slightly lower following a higher-than-expected Polish core inflation print. For a broad dollar, the focus today turns to US retail sales.
Credit: Credit was under pressure yesterday where iTraxx Xover widened 2bp (to 234bp) and Main 0.2bp (to 46.2bp). HY bonds widened 4bp on average while IG only widened marginally.