Sample Category Title
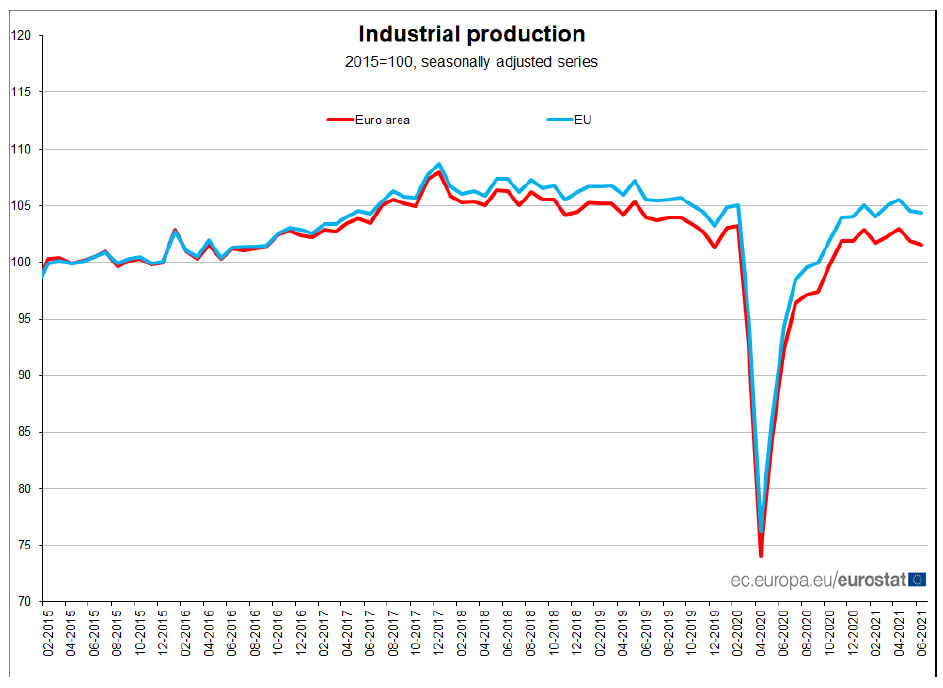
Eurozone industrial production dropped -0.3% mom in Jun, EU down -0.2% mom
Eurozone industrial production dropped -0.3% mom in June, matched expectations. Production of capital goods fell by -1.5% and energy by -0.6%, while production of durable consumer goods and intermediate goods both rose by 0.1% and non-durable consumer goods by 1.6%.
EU industrial production dropped -0.2% mom. Among Member States for which data are available, the largest decreases were registered in Ireland (-4.4%), Portugal (-2.6%) and Denmark (-2.3%). The highest increases were observed in Malta (+5.2%), the Netherlands (+3.3%) and Estonia (+3.2%).
Oil Strong Resistance Above
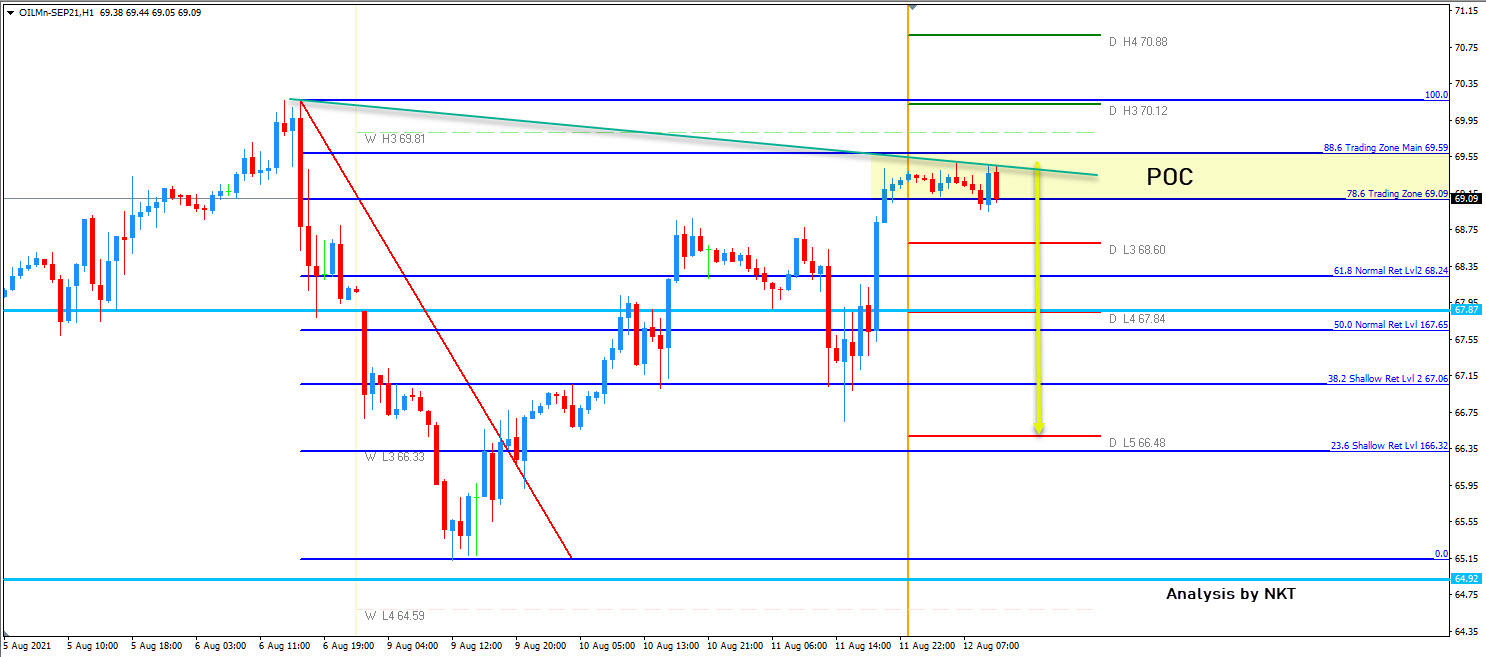
Oil has made a move in the 78.6-88.6 zone and we could see a drop soon.
69.09-69.59 is the zone where sellers might be waiting. We can see that a trend line is protecting sellers from further losses as the price might turn bearish. A rejection off the zone should be targeting D L3 68.60 and further levels down 67.84 and 66.48. Look for selling into rallies.
The Analytical Overview Of The Main Currency Pairs
The EUR/USD currency pair
Technical indicators of the currency pair:
Prev Open: 1.1719
Prev Close: 1.1739
% chg. over the last day: +0.17%
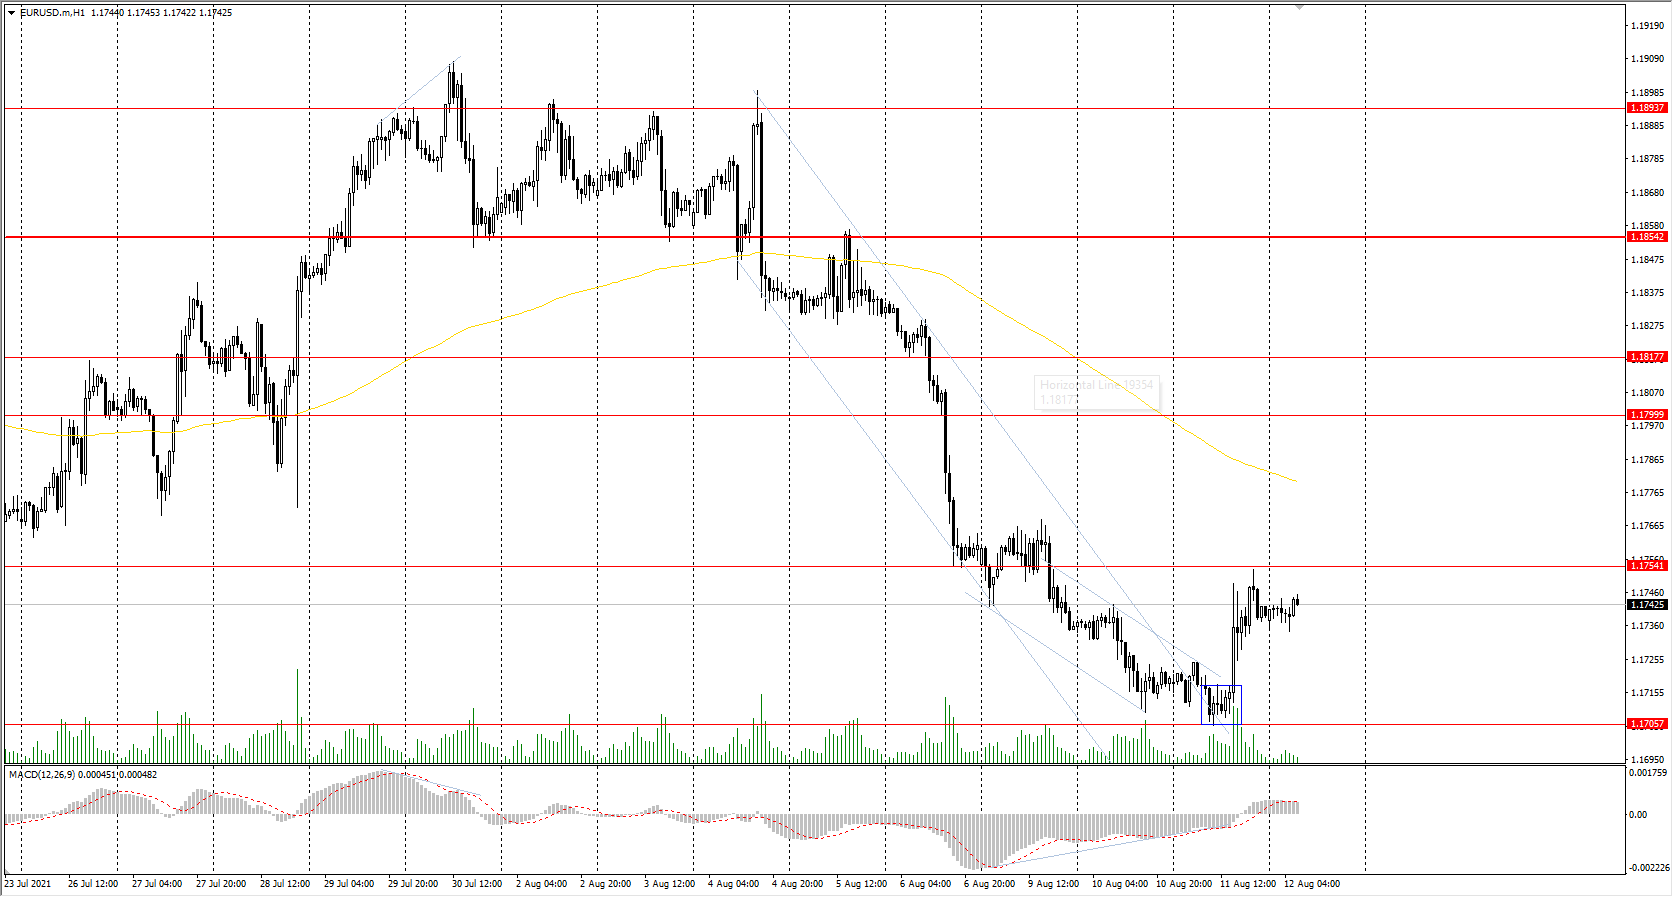
During the news release about the dollar index decline, the European currency, which has an inverse correlation with the US dollar, increased by 0.17% yesterday. But European inflation data is still weak. Germany annual inflation rate increased from 2.3% to 3.8% in July, which is in line with economists' forecasts, but inflation is still rising.
Trading recommendations
Support levels: 1.1706, 1.1609
Resistance levels: 1.1754, 1.1799, 1.1817, 1.1854, 1.1894, 1.1934, 1.1969
From a technical point of view, the general trend on the EUR/USD currency pair is bearish. But the price showed a bullish initiative from the daily support level yesterday. Under such market conditions, it is best to look for the sell trades from the resistance levels near the moving average. Buy trades can only be considered throughout the day from the zone where the buyers showed initiative.
Alternative scenario: if the price breaks through the 1.1854 resistance level and fixes above, the mid-term uptrend will likely resume.
News feed for 2021.08.12:
- Eurozone Industrial Production (m/m) at 12:00 (GMT+3);
- US Producer Price Index (m/m) at 15:30 (GMT+3);
- US Initial Jobless Claims (w/w) at 15:30 (GMT+3).
The GBP/USD currency pair
Technical indicators of the currency pair:
Prev Open: 1.3835
Prev Close: 1.3864
% chg. over the last day: +0.21%
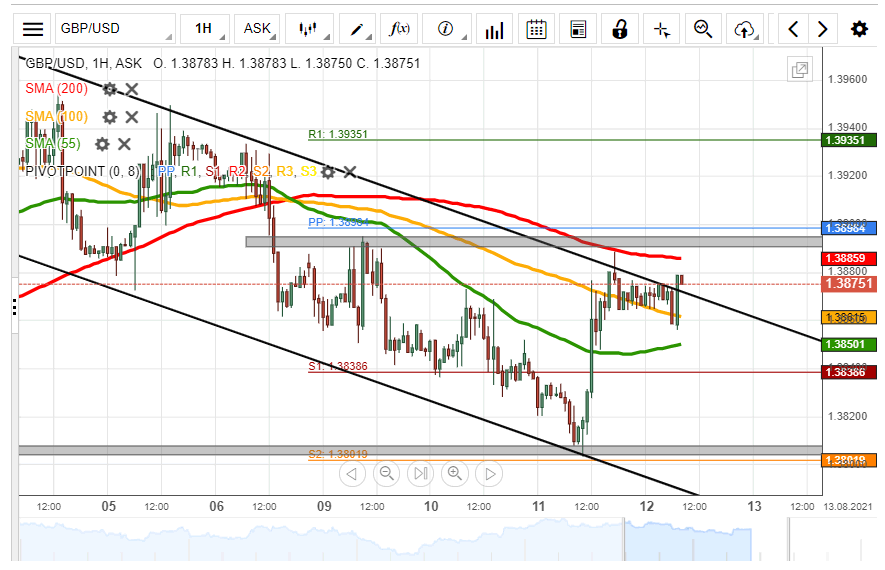
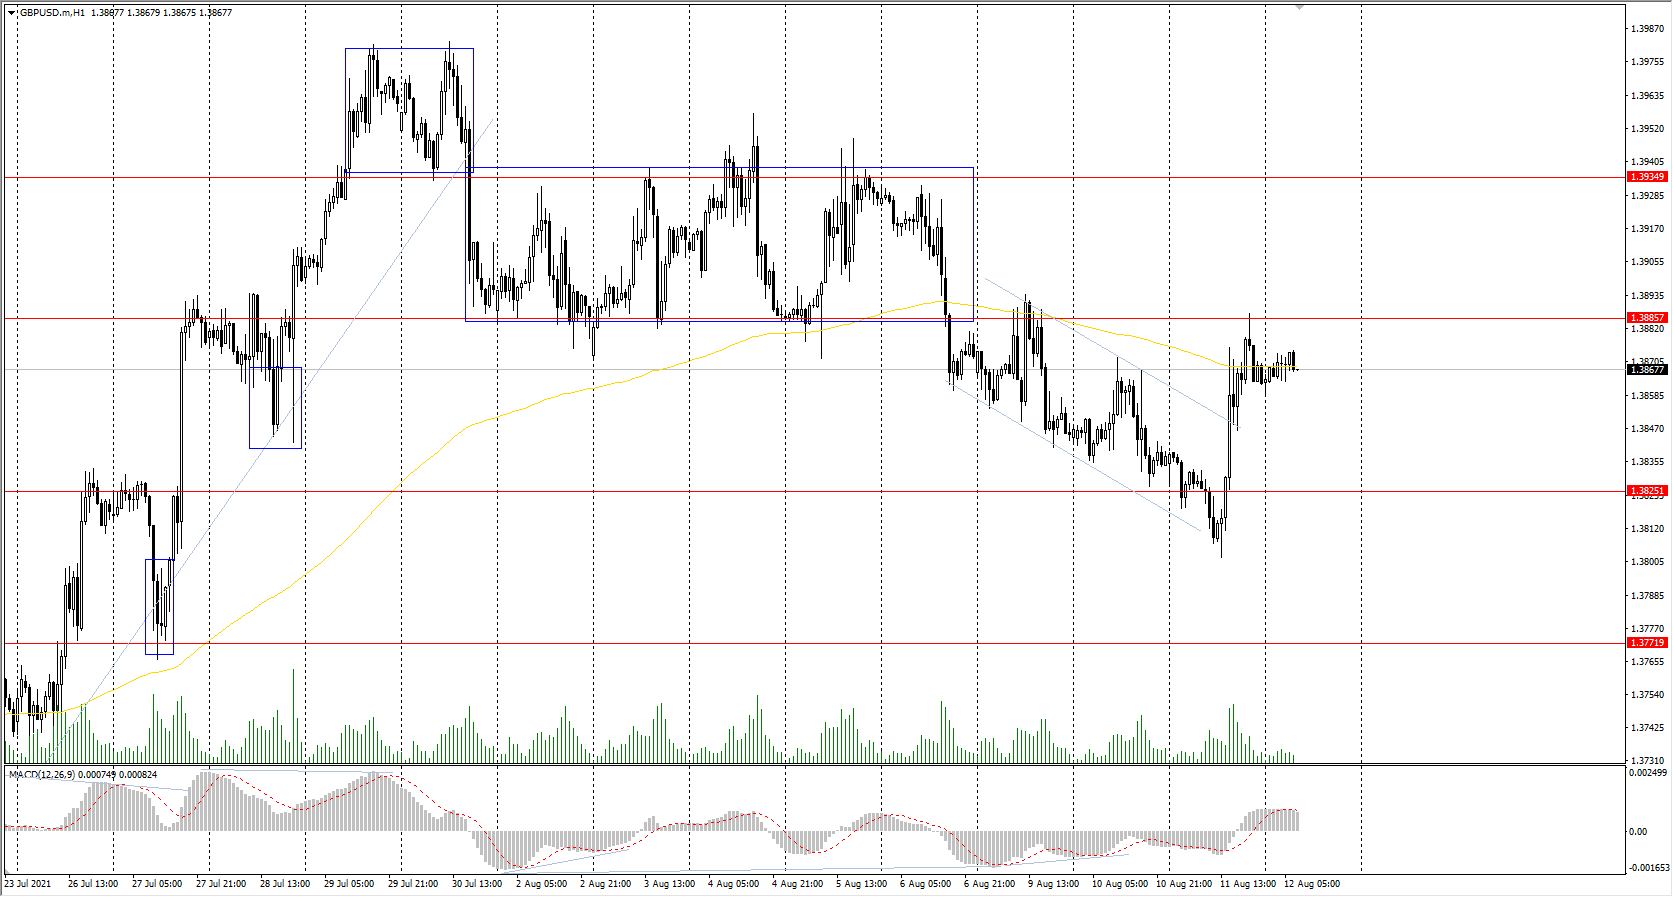
Yesterday, the British currency added 0.21% amid the temporary weakness of the dollar index. There will be a lot of important macroeconomic statistics in the UK today. Good data may lead to the growth of the GBP/USD quotes.
Trading recommendations
Support levels: 1.3825, 1.3772, 1.3714, 1.3676 ,1.3641, 1.3614, 1.3525
Resistance levels: 1.3886, 1.3935, 1.4002, 1.4075, 1.4101
The trend of the GBP/USD currency pair is bullish on the hourly time frame. The price rebounded from the support level and broke through the local descending channel. The MACD indicator has become positive. Under such market conditions, traders are better to look for the buy trades from the zone where the buyers showed initiative. Sell positions can be considered from the resistance levels and only on intraday timeframes.
Alternative scenario: if the price breaks through the 1.3714 support level and consolidates below, the bearish scenario is likely to resume.
News feed for 2021.08.12:
- UK Industrial Production (m/m) at 09:00 (GMT+3);
- UK Manufacturing Production (m/m) at 09:00 (GMT+3).
The USD/JPY currency pair
Technical indicators of the currency pair:
Prev Open: 110.54
Prev Close: 110.43
% chg. over the last day: -0.10%
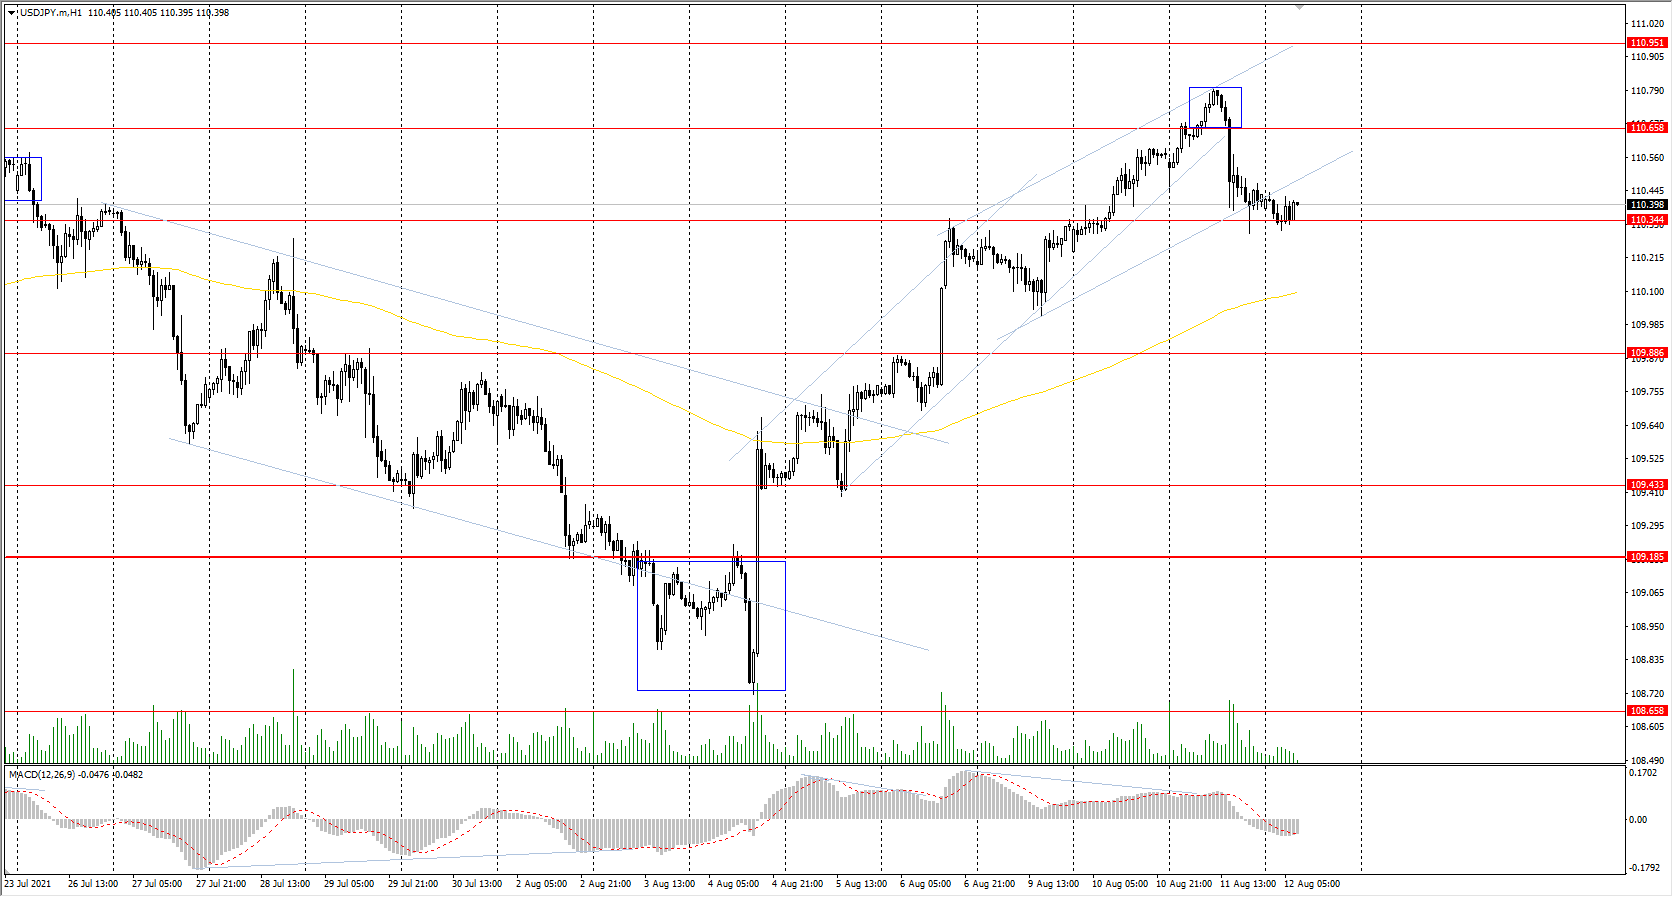
The USD/JPY currency pair decreased by 0.1% due to a drop in the dollar index. Japan's industrial production index increased from 5.0% to 5.6% on a year-on-year basis. It’s better than economists' forecasts, but the overall Q3 fundamental forecast for Japan remains weak.
Trading recommendations
Support levels: 110.34, 109.88, 109.43, 109.19, 108.65
Resistance levels: 110.66, 110.95, 111.48
The main trend on the USD/JPY currency pair is bullish. The MACD indicator went below zero. Under such market conditions, it is better to look for the buy positions from the support level near the moving average. Sell positions should be considered only on the lower time frames from the zone where the sellers showed initiative.
Alternative scenario: if the price falls below 109.19, the uptrend is likely to be broken.
News feed for 2021.08.12:
- Japan Industrial Production (m/m) at 07:30 (GMT+3).
The USD/CAD currency pair
Technical indicators of the currency pair:
Prev Open: 1.2519
Prev Close: 1.2503
% chg. over the last day: -0.13%
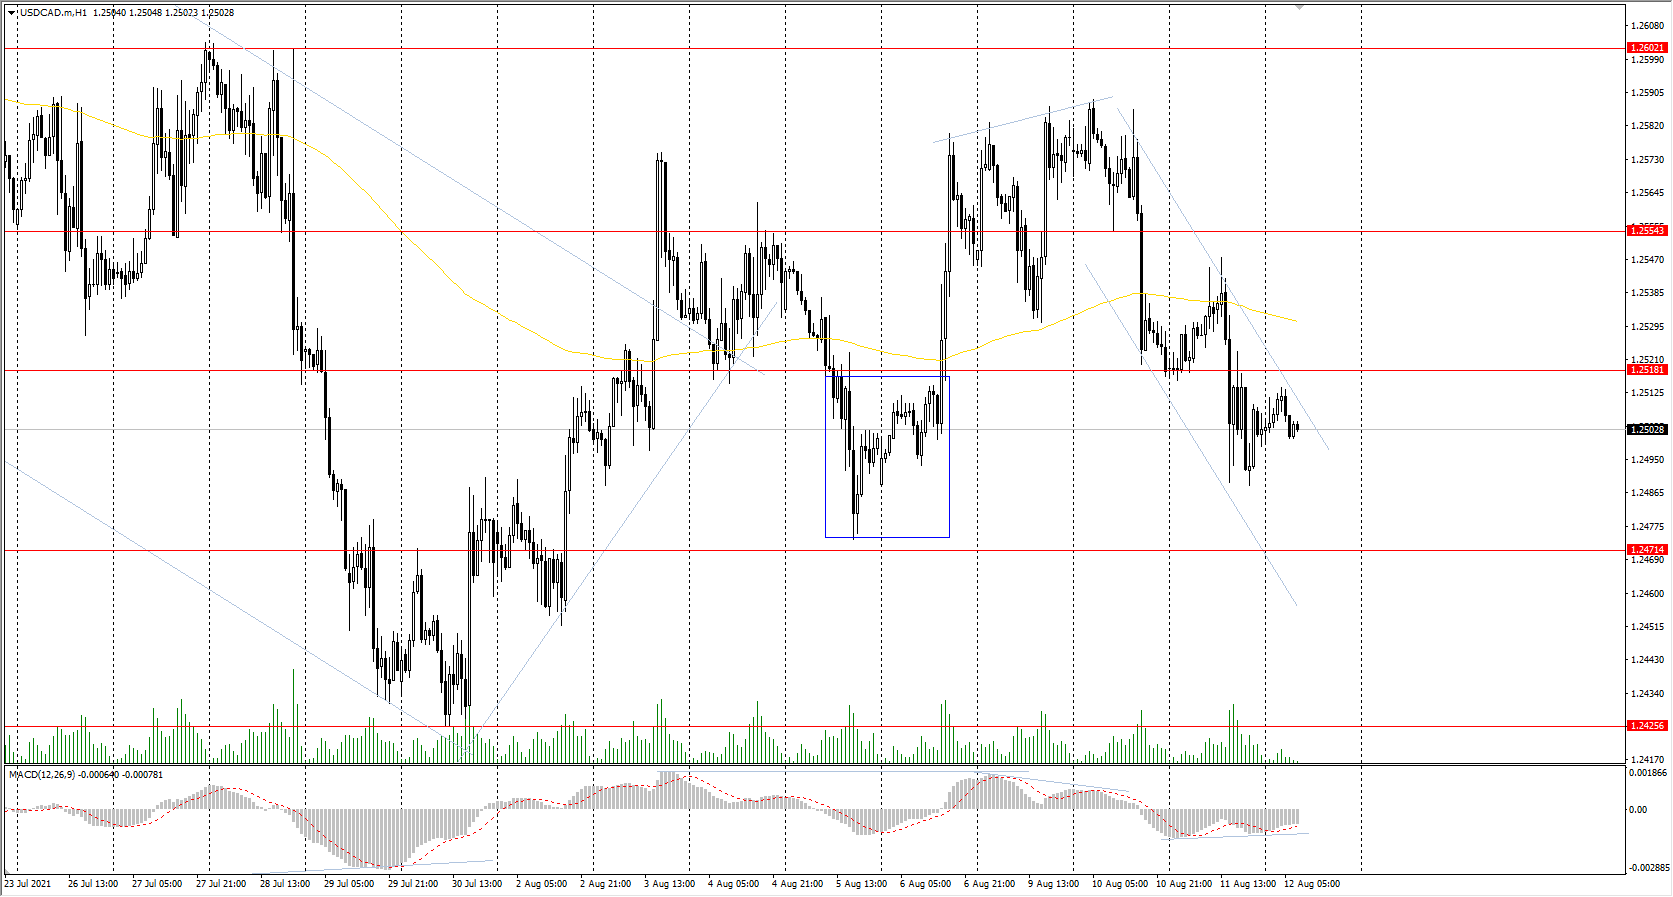
The Canadian dollar is highly dependent on the performance of the dollar index and oil price performance. Yesterday, the decrease in the dollar index and the rise in oil prices caused a strengthening of the Canadian dollar and a decrease in the USD/CAD quotes.
Trading recommendations
Support levels: 1.2471, 1.2425, 1.2370, 1.2312
Resistance levels: 1.2518, 1.2554, 1.2602, 1.2671, 1.2787, 1.2951
Considering technical analysis, the USD/CAD trend is bearish. The price went below the moving average, and the MACD indicator shows signs of divergence. Under such market conditions, it is better to look for the sell positions from the resistance levels. Traders should consider the buy positions from the support levels and only on intraday time frames.
Alternative scenario: if the price breaks through the 1.2671 resistance level and fixes above, the uptrend is likely to be resumed.
Crude Oil Price Recovered as US Inventory Resumed Decline. Outlook Remains Masked by Delta
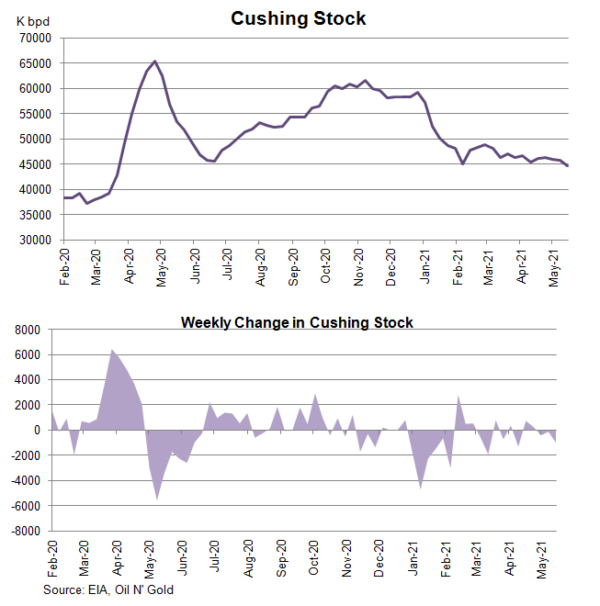
The report from the US Energy Information Administration (EIA) shows that total crude oil and petroleum products (ex. SPR) stocks slipped -0.14 mmb to 1267.52 mmb in the week ended August 6. Crude oil inventory resumed decline, falling-0.45 mmb (consensus: -1.27 mmb) to 438.78 mmb. Stockpile decreased in PADD 1, 2, and 3. Cushing stock slipped -0.33 mmb to 34.58 mmb. Utilization rate increased +0.5 percentage points to 91.8% while crude production climbed +0.1 mmb higher to 11.3M bpd for the week. Crude oil imports decreased -0.04M bpd to 6.4M bpd in the week.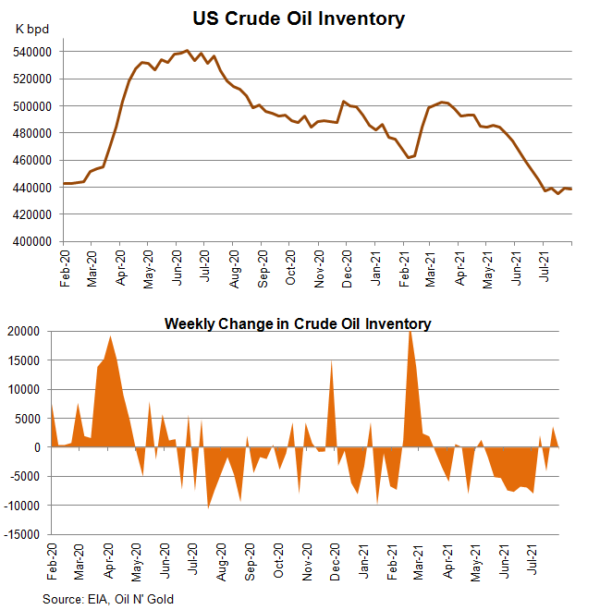
 Concerning refined oil product inventories, gasoline inventory fell -1.4 mmb to 227.47 mmb although demand also dropped -3.53% to 9.43M bpd. The market had anticipated a -1.66 mmb fall in stockpile. Production slipped -1.87% to 9.96M bpd while imports were up +9.47% to 0.93M bpd during the week. Distillate stockpile rose +1.77 mmb to 140.51 mmb. The market had anticipated a +0.47 mmb increase. Demand added +3.21% to 3.73M bpd. Production added +0.16% to 4.89 mmb while imports rose +14.2% to 0.19M bpd during the week.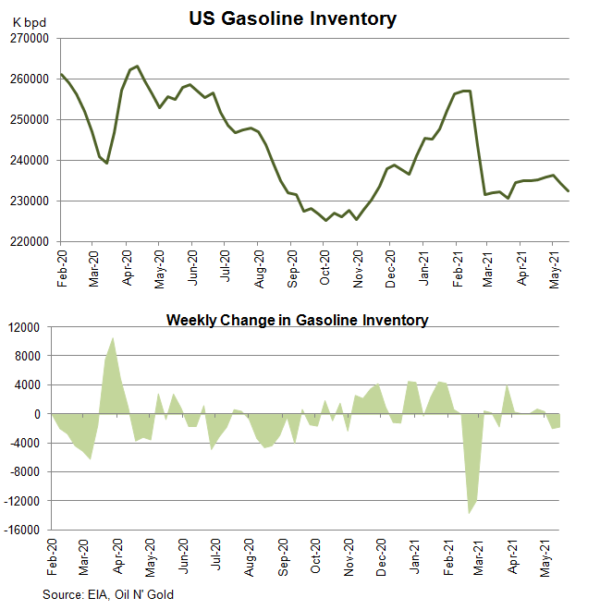
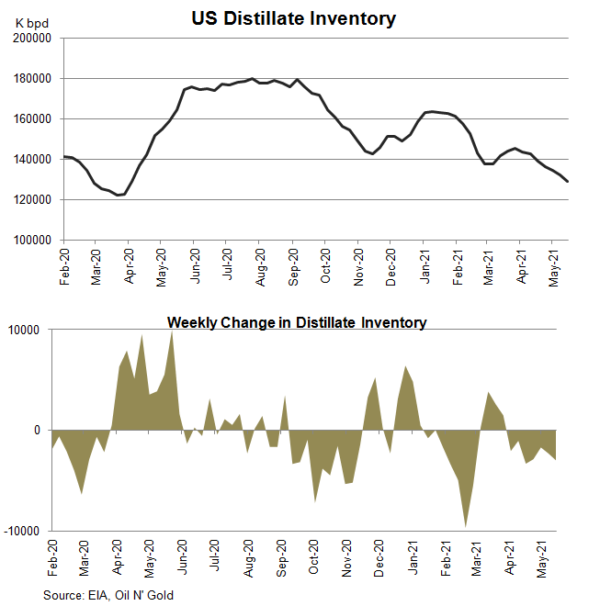
A day earlier, the industry-sponsored API estimated that crude oil inventory was down -0.82 mmb. Gasoline stockpile dipped -1.11 mmb, while that for distillate gained +0.67 mmb.
AUDUSD On The Sidelines For Another Week, Trend Signals Negative
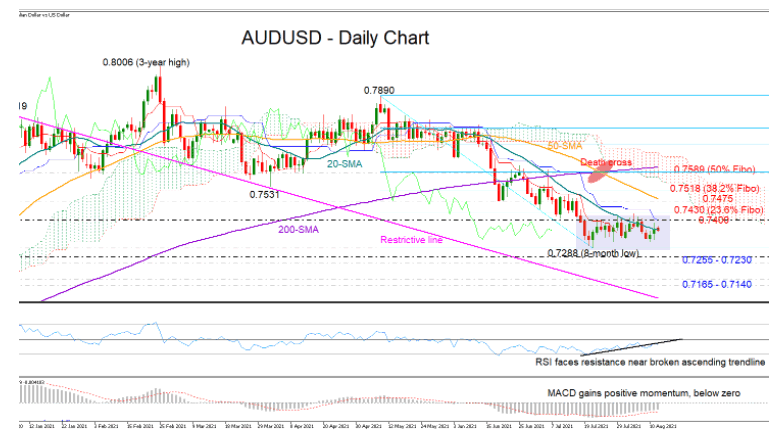
AUDUSD continues to drive sideways for the third consecutive week within the 0.7288 – 0.7430 boundaries and at the bottom of a short-term downtrend, struggling to extend any upticks above the 20-day simple moving average (SMA).
The technical oscillators reflect an indecisive market as well. The RSI could not return above the broken tentative ascending trendline, questioning the bulls’ strength, whereas the MACD managed to gain more ground above its red signal line, but it has yet to enter the positive territory. Meanwhile in Ichimoku indicators, the red Tenkan-sen line remains flat below the blue Kijun-sen line, keeping the bias on the bearish side.
In other important notes, the 50- and 200-day SMAs continue to deviate after negatively intersecting each other, foreseeing a negative trend reversal. Also, the longer the sideways move, the more significant the breakout could be.
A close above the 0.7400 – 0.7430 box could face constraints near the 50-day SMA and the 0.7475 resistance area. Should the bulls crawl higher, the next obstacle could emerge near the 38.2% Fibonacci retracement of the latest down leg at 0.7518. A violation at this point could add more fuel to the rally, likely bringing the 50% Fibonacci of 0.7589 and the 200-day SMA into view.
In the bearish scenario, where the pair exits the range zone on the downside, support could initially pop up within the 0.7255 -0.7230 territory, last active during November 2020. Deeper, selling pressures could decelerate somewhere between 0.7165 and 0.7140, while the restrictive line, which joins all the peaks and troughs from January, will be closely watched in the case of sharper declines.
Summarizing, AUDUSD is sending mixed signals for short-term trading, with investors waiting for a break above the 0.7400 - 0.7430 area or below the 0.7288 low to decide on their next actions.
WTI Futures Slip After Testing 69.00, Bearish Correction On Cards
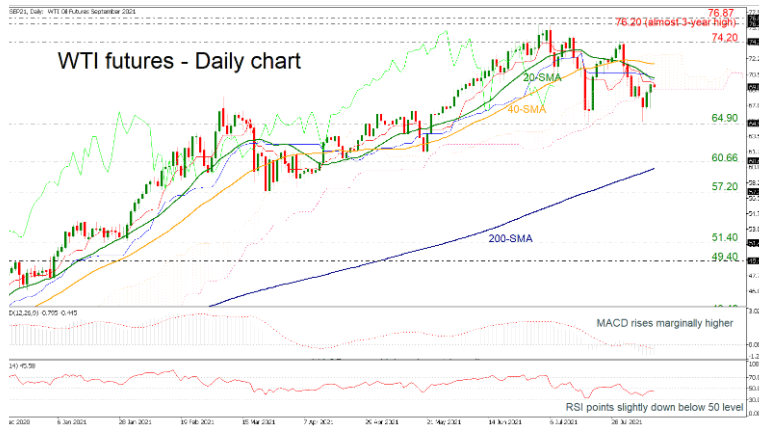
WTI crude oil futures are struggling to gain positive momentum after their fast rebound stalled around 69.00 and within the Ichimoku cloud.
The downside reversal in the RSI and the slowdown in the MACD justify the diminishing buying pressure, though both remain well below their neutral thresholds keeping the short-term risk skewed to the downside.
Should selling forces strengthen, the 64.90 support level will come under the spotlight. The 60.66 barrier and the 200-day simple moving average currently at 59.85 could initially provide support to keep the bias on the positive side. Moving lower, the 57.20 line could next add some footing ahead of the 51.40 obstacle, putting the longer-term bullish outlook under examination.
Should selling forces strengthen, the 64.90 support level will come under the spotlight. The 60.66 barier and the 200-day simple moving average currently at 59.85 could initially turn support to keep the bias on the positive side. Moving lower, the 57.20 line could next add some footing ahead of the 51.40 obstacle, putting the longer-term bullish outlook under examination.
Alternatively, a close above the 20- and 40-day SMAs will brighten the broader view, pushing the price towards the 74.20 resistance. Beyond that, the rally may gear up to the almost three-year high of 76.20 and the 76.87 barrier, registered in September 2018.
In brief, oil prices are facing a weaking bullish bias, where a drop below the 200-day SMA is expected to enhance selling interest.
Daily Tecnical Analysis
EUR/USD
Current level - 1.1742
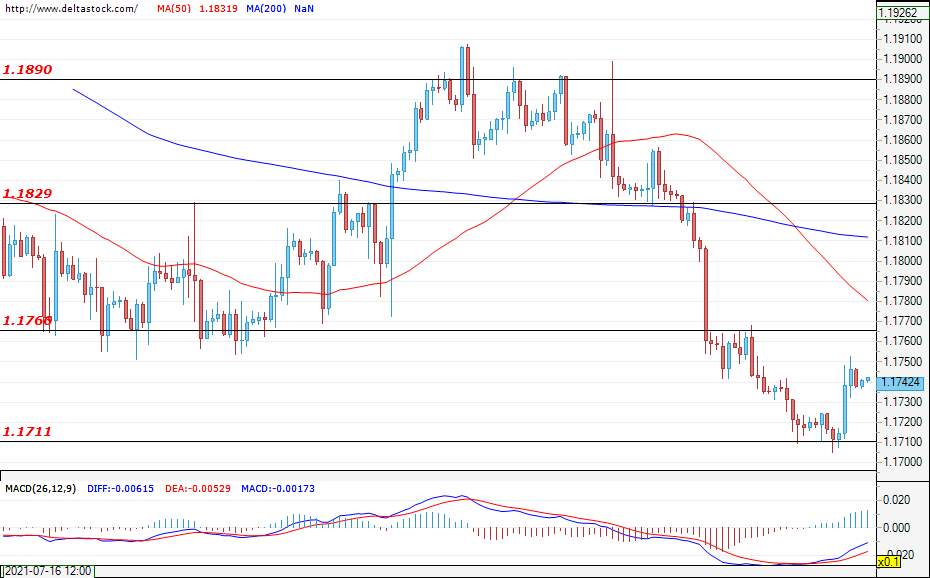
The sell-off was limited to the support level at 1.1711 and the euro regained some of its recent losses against the dollar. During the early hours of today`s trading, the pair is trading at around the level of 1.1742 and, if the bulls continue to dominate, a test of the level at 1.1763 will be the most probable scenario. The expectations are for this level to put an end to the corrective phase and resume the sell-off. A violation of the support zone at 1.1711 would lead to new losses for the EUR/USD and would strengthen the negative expectations for the future path of the currency pair. However, if the level at 1.1763 gets breached, we could witness a rally towards 1.1829 and, subsequently, a change in the current sentiment. During today's trading session, volatility could rise when the initial jobless claims for the U.S. are announced (12:30 GMT).
| Resistance | Support | ||
| intraday | intraweek | intraday | intraweek |
| 1.1766 | 1.1890 | 1.1711 | 1.1650 |
| 1.1829 | 1.1944 | 1.1650 | 1.1600 |
USD/JPY
Current level - 110.30
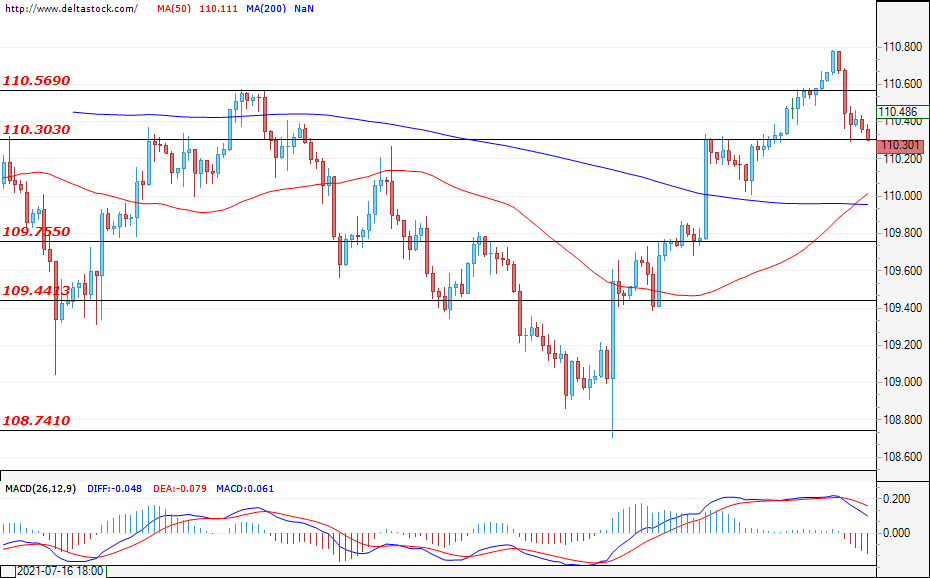
Yesterday, the bulls lost momentum and the pair did not manage to remain above the last resistance at 110.56. At the time of writing, the pair is testing the support zone at 110.30 and, if the breach is successful, it would easily deepen the sell-off and could lead the USD/JPY towards f the level of 109.75. The first target for the bulls is still the mentioned level at 110.56 and only a confirmed breach will signal a continuation of the rally and new gains for the dollar against the yen.
| Resistance | Support | ||
| intraday | intraweek | intraday | intraweek |
| 110.56 | 111.00 | 110.30 | 109.44 |
| 111.00 | 111.50 | 109.75 | 108.74 |
GBP/USD
Current level - 1.3865
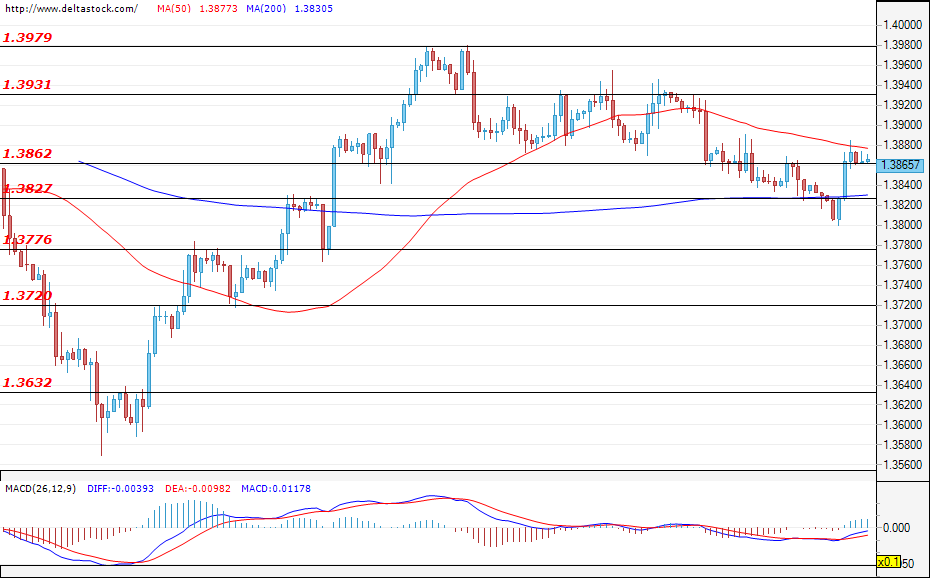
The test of the support zone at 1.3827 was not successful and the bulls prevailed. The sterling gained ground against the greenback and the pairtested the close resistance zone at 1.3862. A confirmation of the breach could easily pave the way towards the next target at 1.3931, followed by the level of 1.3979. If the bears enter the market, a new attack of the level at 1.3827 would be the most probable scenario. А violation of the mentioned level will most likely lead to future losses for the Cable аnd would continue the sell-off towards the zone at 1.3776.
| Resistance | Support | ||
| intraday | intraweek | intraday | intraweek |
| 1.3930 | 1.3980 | 1.3827 | 1.3720 |
| 1.3980 | 1.4060 | 1.3776 | 1.3632 |
XAU/USD Breached 100- Hour SMA
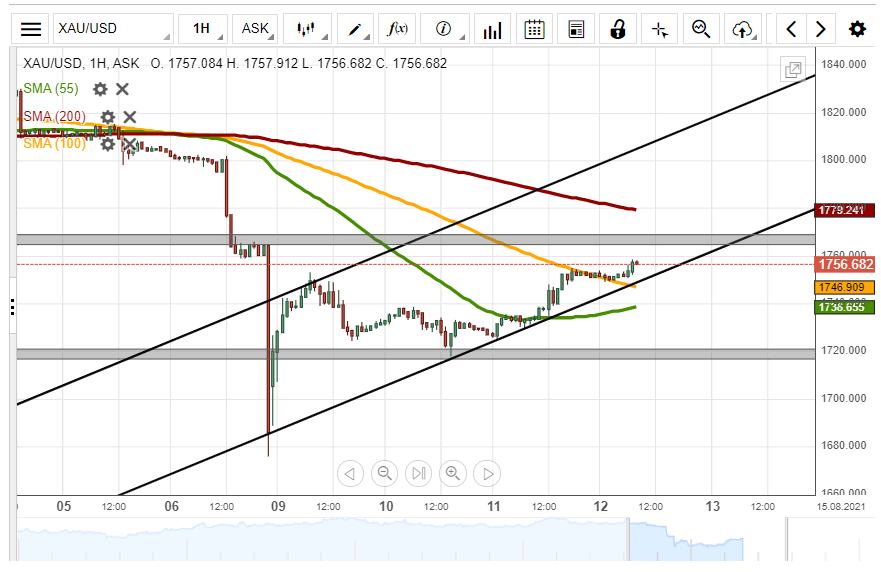
The yellow metal's price edged higher by 267 pips or 1.55% on Wednesday. The surge was stopped by the 100– hour simple moving average during yesterday's trading session.
All things being equal, the commodity could continue to edge higher in an ascending channel pattern through the following trading session. The potential target for the precious metal would be near the 1800.00 level.
However, the 200– hour SMA at 1781.8 might provide resistance for the XAU/USD exchange rate in this session.
USD/JPY Breakout Occurs
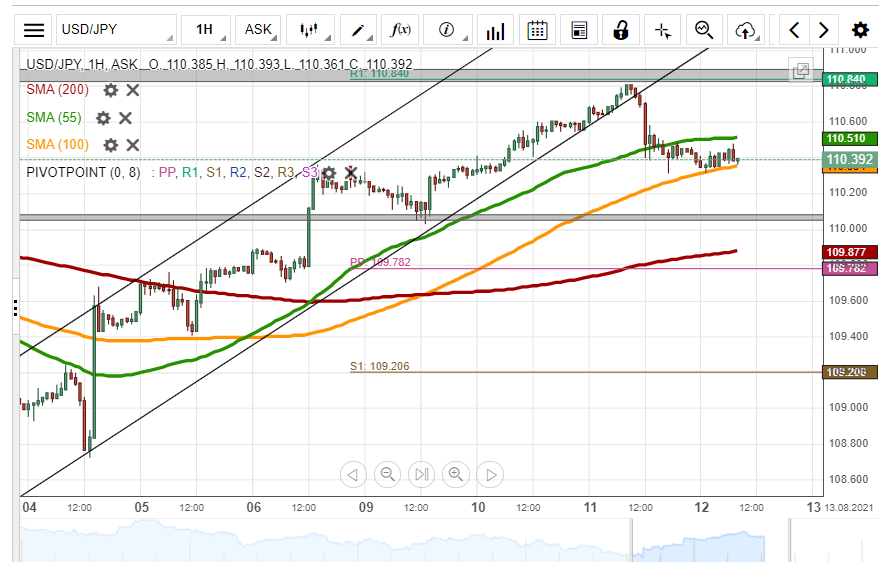
On Wednesday, the US Dollar declined by 50 pips or 0.45% against the Japanese Yen. A breakout occurred through the lower boundary of an ascending channel pattern during yesterday's trading session.
Given that a breakout has occurred, bearish traders are likely to continue to drive the exchange rate lower during the following trading session. The potential target for sellers would be near the support cluster at 109.85.
However, the 100– hour simple moving average at 110.32 could provide support for the currency exchange rate in the shorter term.
GBP/USD Could Break Channel
On Wednesday, the British Pound edged higher by 70 pips or 0.51% against the US Dollar. The currency pair breached the upper boundary of a descending channel pattern during Wednesday's trading session.
The exchange rate is currently trading near the upper line of the channel pattern and could be set for a breakout.
If the breakout occurs, a surge towards the weekly resistance level at 1.3935 could be expected within this session.
However, if the 200– hour simple moving average at 1.3886 could provide resistance for the GBP/USD currency exchange rate within this session.