Sample Category Title
USD/CHF Daily Outlook
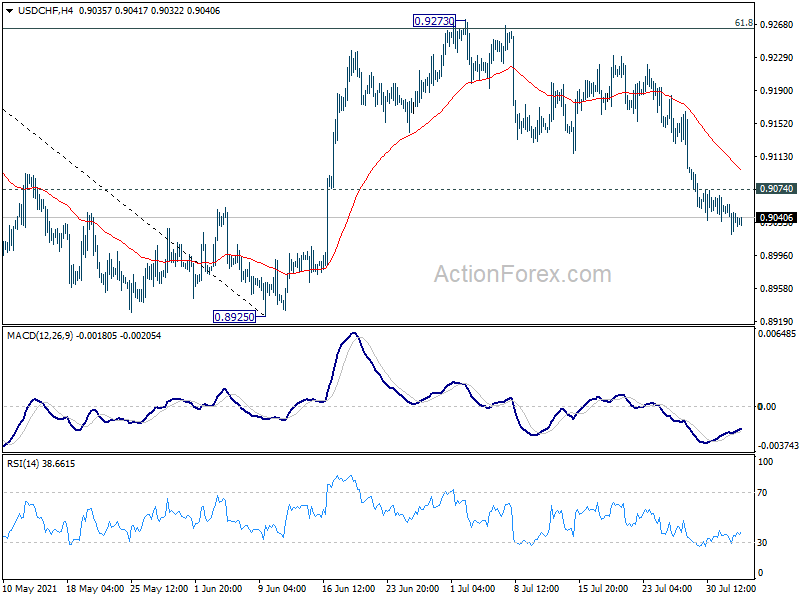
Daily Pivots: (S1) 0.9024; (P) 0.9041; (R1) 0.9059; More....
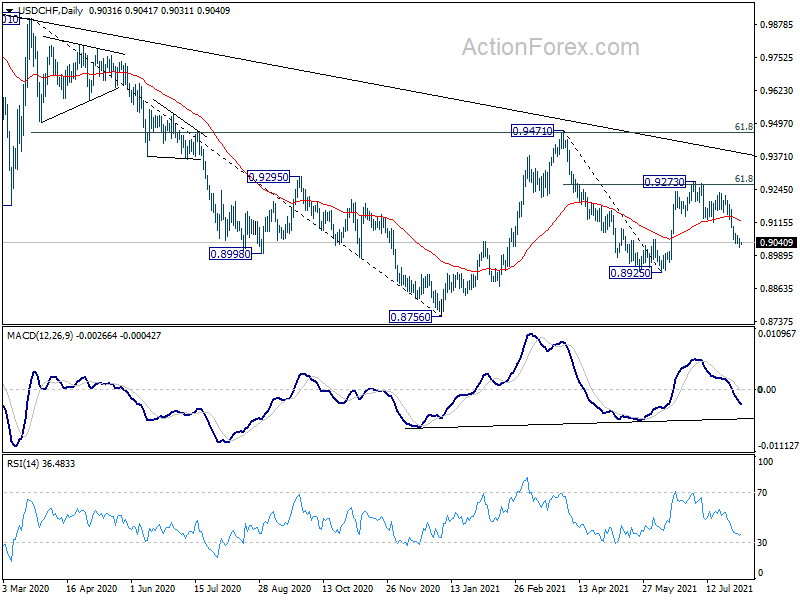
USD/CHF's fall continues today and reaches as low as 0.9021 so far. Intraday bias stays on the downside for retesting 0.8925 low. On the upside, break of 0.9074 minor resistance will turn intraday bias neutral first. But another fall will remain in favor as long as 55 day EMA (now at 0.9126) holds.
In the bigger picture, failure to sustain above 55 week EMA (now at 0.9183) affirms medium term bearish in USD/CHF. Break of 0.8925 support should resume the whole decline form 1.0342 (2016 high) through 0.8756 low. For now, risk will stay on the downside as long as 0.9273 resistance holds, in case of rebound.
NZDUSD Still Very Bullish
Technical analysis
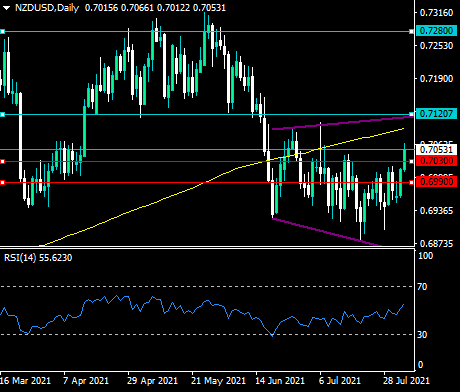
The RSI indicator has turned bullish on the daily time frame and is now issuing a medium-term buy signal for the NZDUSD pair.
The NZDUSD pair looks to be targeting towards the top of a broadening wedge or megaphone style pattern, around the 0.7120 resistance level.
What the possible outcomes are
In our most likely scenario, the NZDUSD pair will test towards the top of the large broadening wedge pattern, around the 0.7120 level before staging a price correction.
Alternatively, the NZDUSD could break above the top of broadening wedge pattern on the first attempt and rally straight through to the 0.7280 resistance level.
Key levels
Support 0.7030 0.6990
Resistance 0.7120 0.7280
EURGBP Heavily Bearish
Technical analysis
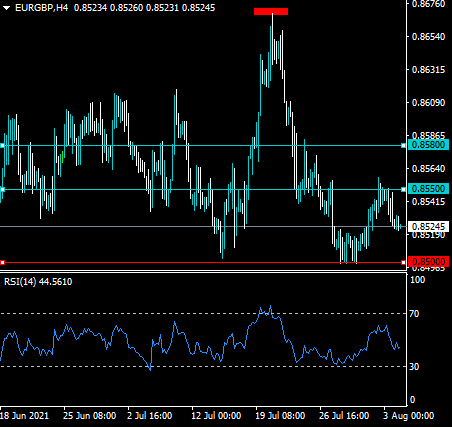
The EURGBP has formed a large head and shoulders pattern on the four-hour time frame, with the pair trading close to the neckline of the bearish price pattern.
According to the RSI indicator the trend on the four-hour time frame remains bearish, and traders should expect further weakness ahead in the EURGBP pair.
What the possible outcomes are
In our most likely scenario, the EURGBP pair will start to decline towards the 0.8350 support level over the medium-term as the bearish price pattern is activated.
Alternatively, the EURGBP pair will stage one final corrective move back towards the 0.8550 level before staging a decisive move under the 0.8500 support level.
Key levels
Support 0.8500 0.8350
Resistance 0.8550 0.8580
USDJPY Dives At 10-Week Low, Bearish Bias
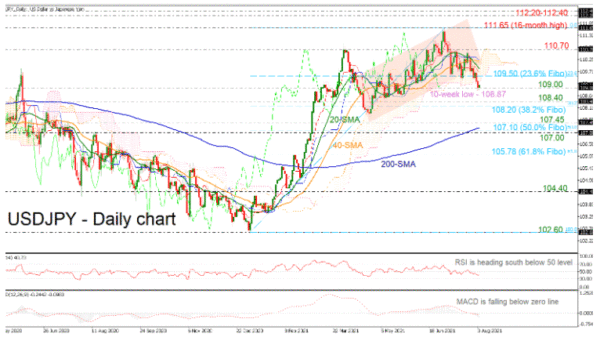
USDJPY is holding beneath the ascending channel in the medium-term, sending the market below the 109.00 handle. The price posted a ten-week low at 108.87 and the technical indicators are confirming this view. The RSI is falling below the neutral threshold of 50, while the MACD is extending its bearish move below its trigger line.
More selling interest could meet the 108.40 support level and the 38.2% Fibonacci retracement level of the up leg from 102.60 to 111.65 at 108.20. Even lower, the focus could turn to 107.45 and the 200-day simple moving average (SMA) around the 50.0% Fibonacci of 107.10.
On the flip side, an increase above the 23.6% Fibonacci of 109.50 could take the bulls towards the 20- and 40-day SMAs at 109.90 and 110.20 respectively. A rally beyond these levels could open the way for 110.70 and the 16-month peak of 111.65.
In conclusion, in the case of further declines below the 200-day SMA, the broader outlook would shift to bearish. However, any successful attempts above the 16-month high of 111.65 could add optimism for bullish actions.
Daily Tecnical Analysis
EUR/USD
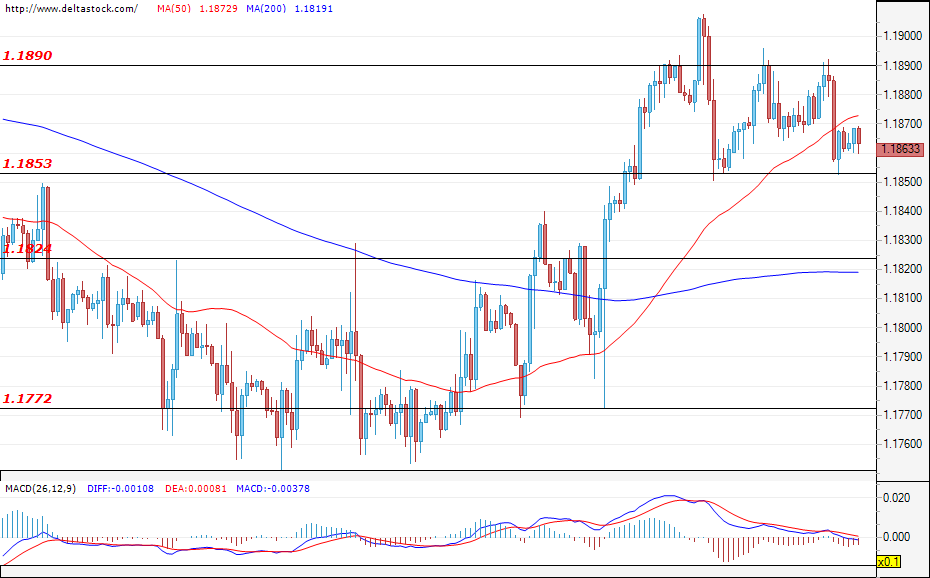
Current level - 1.1863
The currency pair is found in a consolidation phase just below the resistance zone of 1.1890. The forecast is for the pair to test and breach the resistance level of 1.1890 and continue its upward movement towards the next target at 1.1955 once the consolidation phase is over. The intraday support lies at 1.1853 and 1.1824 is a key support level. During today's trading session, investors' attention will be focused on the data on the ISM non-manufacturing Index for the U.S. (14:00 GMT).
| Resistance | Support | ||
| intraday | intraweek | intraday | intraweek |
| 1.1890 | 1.1970 | 1.1853 | 1.1705 |
| 1.1955 | 1.2070 | 1.1772 | 1.1600 |
USD/JPY
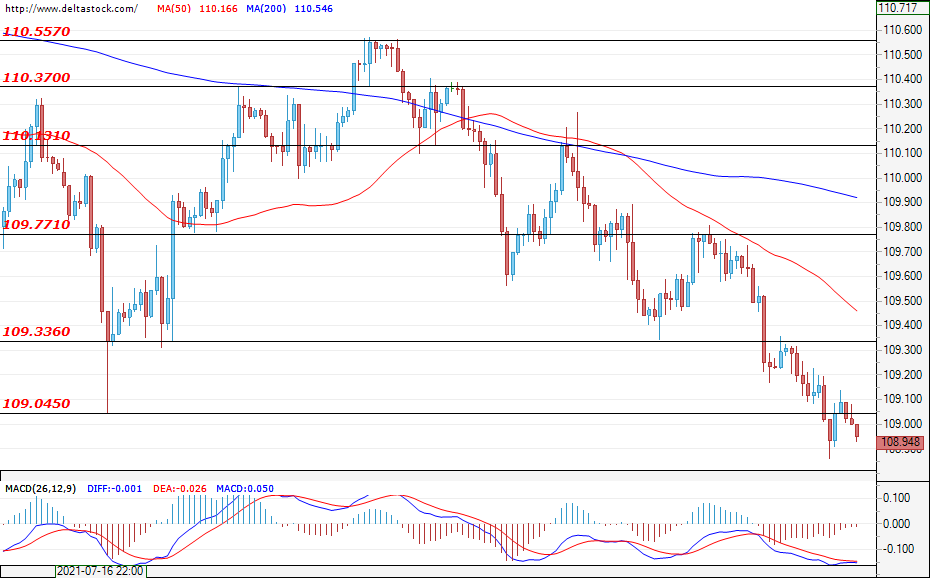
Current level - 108.94
The yen continues to appreciate against the dollar and, at the time of writing, the currency pair is confirming the breach of the support level at 109.04. If confirmed, the breach would lead the pair towards a test of the next support at 108.70. In the positive direction, the key resistance lies at 109.77.
| Resistance | Support | ||
| intraday | intraweek | intraday | intraweek |
| 109.33 | 110.13 | 109.04 | 108.55 |
| 109.77 | 110.37 | 108.70 | 108.10 |
GBP/USD
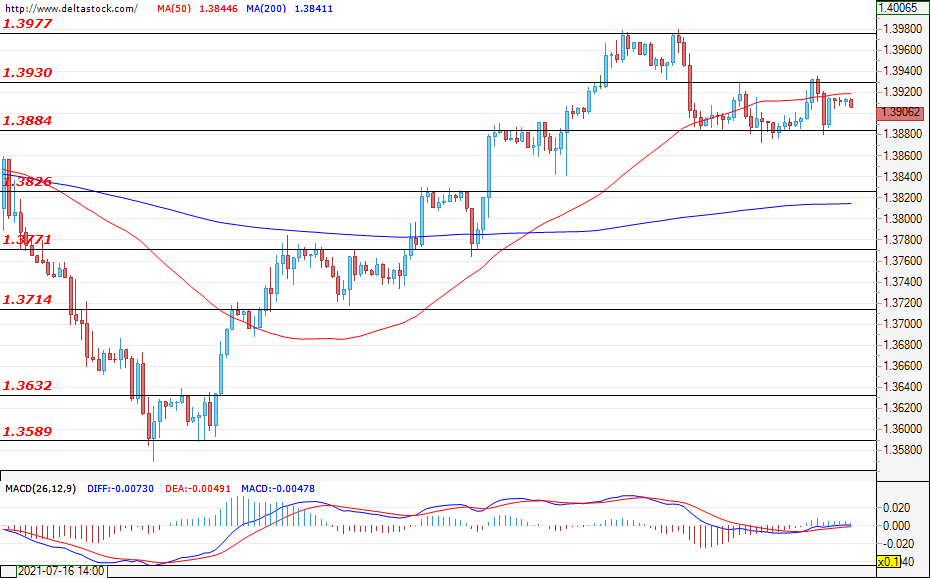
Current level - 1.3906
During the last couple of sessions, the Cable has been trading in the relatively narrow range between 1.3884-1.3977. At the time of writing, neither the bulls nor the bears could gain momentum and establish themselves on the market. Only a confirmed breach of one of the boundaries of the range could draw a clearer direction. An increase in volatility can be expected today around the announcement of the data on the PMI services for the UK (08:30 GMT).
| Resistance | Support | ||
| intraday | intraweek | intraday | intraweek |
| 1.3930 | 1.4060 | 1.3884 | 1.3771 |
| 1.3977 | 1.4115 | 1.3826 | 1.3714 |
XRPUSD Neutral Bias
Technical analysis
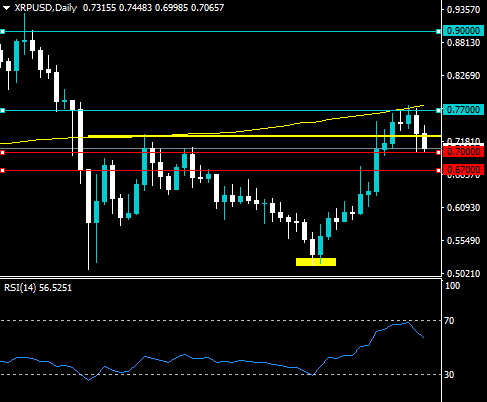
The four-hour time frame shows that the XRPUSD pair has formed a large inverted head and shoulders pattern, and may need to correct lower to form the final right-hand shoulder.
The Relative Strength Index indicator on the four-hour time frame has dipped below 50 and continues to generate a strong sell signal.
What the possible outcomes are
In our most likely scenario, the XRPUSD pair starts to correct back towards the 0.6700 level and then rally towards the 0.9000 level once the bullish price pattern is completed.
Alternatively, the XRPUSD pair may consolidate around current trading levels and then start to rally towards the 0.9000 level.
Key levels
Support 0.7000 0.6700
Resistance 0.7700 0.9000
EURUSD Bullish Bias
Technical analysis
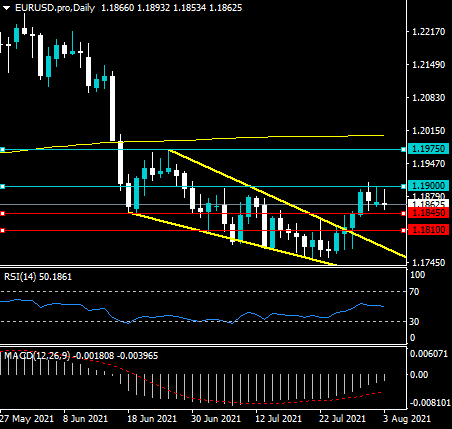
The EURUSD pair could still trade much higher as the Relative Strength Index indicator is issuing a buy signal and a bullish wedge break remains in play.
The daily time frame still shows that significant amount of bullish price divergence are present on the MACD indicator until the 1.1975 level.
What the possible outcomes are
In our most likely scenario, the EURUSD pair will start to trade back towards its 200-day moving average and reverse the bullish price divergence.
Alternatively, the EURUSD pair will stage one final corrective pullback towards the 1.1810 support area and then start to rally towards its 200-day moving average.
Key levels
Support 1.1845 1.1810
Resistance 1.1900 1.1975
XAUUSD Is Possibly Bullish
Technical analysis
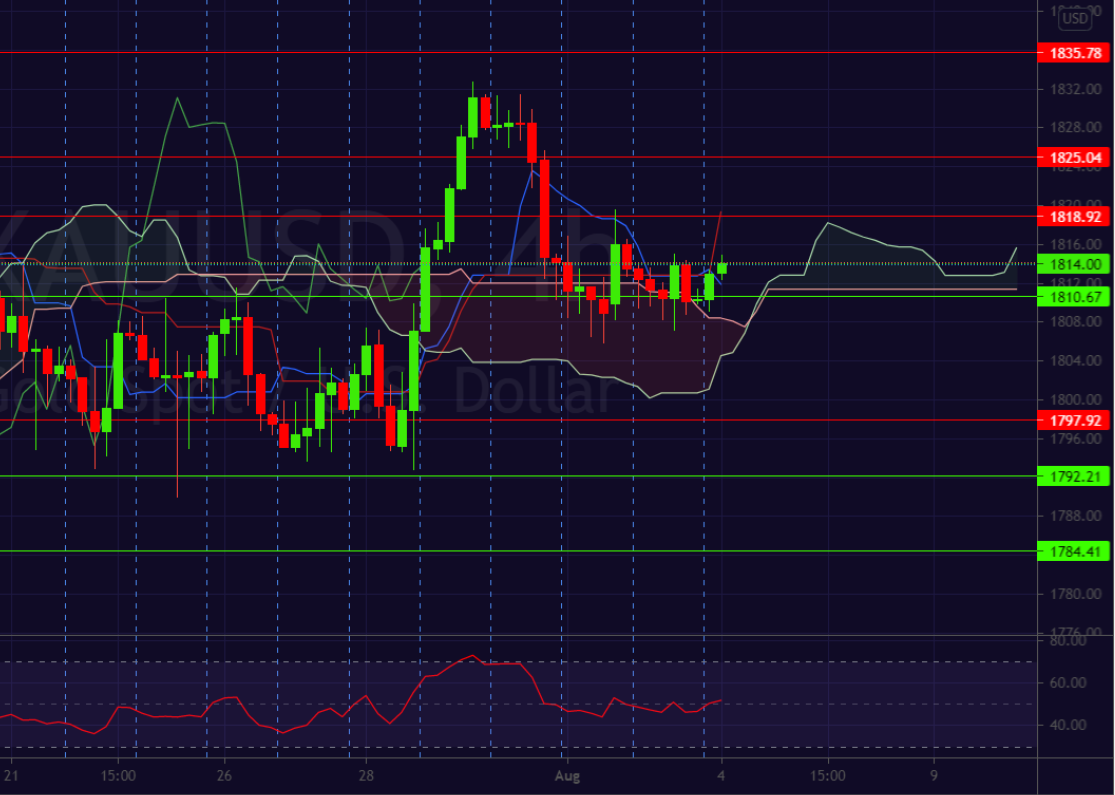
The RSI is above line 50, indicating that an uptrend may prevail
The Ichimoku indicator gives a possible bullish signal.
What the possible outcomes are
Fears about Delta spreading in the USA and China supported gold. Meanwhile, traders await signals from the U.S. jobs data on the labour market recovery that could influence the tapering plans of the Federal Reserve.
In our most likely scenario, XAUUSD may rise towards the first resistance level of 1,818.92.
If the pair surpasses the first resistance level, we should expect a continued surge towards the next resistance level of 1,825.04.
Alternatively, the XAUUSD may challenge the first support level of 1,810.67.
If the pair falls below the first support level, we can expect a continued downtrend towards the second support level of 1,797.92, with an extended downtrend towards 1,792.21.
Key levels
Support 1,784 1,792 1,797 1,810
Resistance 1,818 1,825 1,835
NZDUSD Spikes After Strong New Zwaland Jobs Data
The New Zealand dollar jumped to the highest point in weeks after positive employment numbers from the country. According to the statistics agency, the overall unemployment rate declined from 4.6% in the first quarter to 4.0% in the second quarter. This decline was better than the median estimate of 4.5%. The participation rate increased from 70.40% to 70.50%. In the same period, the labor cost index rose from 0.4% to 0.9% on a qQoQ basis. The employment change increased by 1.0% after rising by 0.6% in the first quarter. These numbers show that the New Zealand economy is doing well which signals that the RBNZ will start hiking interest rates soon.
The Australian dollar was little changed after weak economic data from Australia. According to the statistics agency, the headline retail sales number declined by 1.8% in June after falling by 1.8% in the previous month. Further, sales rose by just 0.8% in the second quarter. At the same time, the services sector showed some contraction in July as the country implemented more lockdowns. According to the Australia Industry Group (AIG), the construction PMI moved from 55.5 in June to 48.7 in July. Separate data by Markit revealed that the services PMI declined from 56.8 to 44.2. These numbers came a day after the Reserve Bank of Australia delivered a relatively hawkish rate decision.
The economic calendar will have some key events today. Markit and its partnering institutions will publish the latest services and composite PMI numbers. In countries like the UK, US, and Europe, the PMIs are expected to remain under pressure because of the new reported wave of Covid. The Eurozone will also publish the latest retail sales numbers. In the US, ADP will release its estimate of the labour market while the EIA will release the latest non-manufacturing PMI data.
NZDUSD
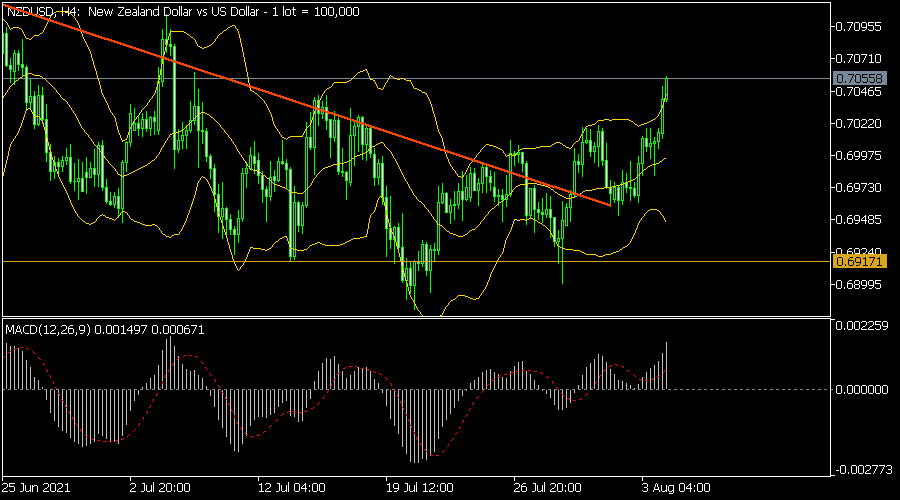
The NZDUSD pair rose to a high of 0.7058, which was the highest level since July 8. On the four-hour chart, this price is along the upper line of the Bollinger Bands. It has also moved above the 25-day moving average while the histogram of the MACD has moved above the neutral line. The price has also moved above the descending trendline. Therefore, the pair will likely keep rising as bulls target 0.7100.
EURUSD
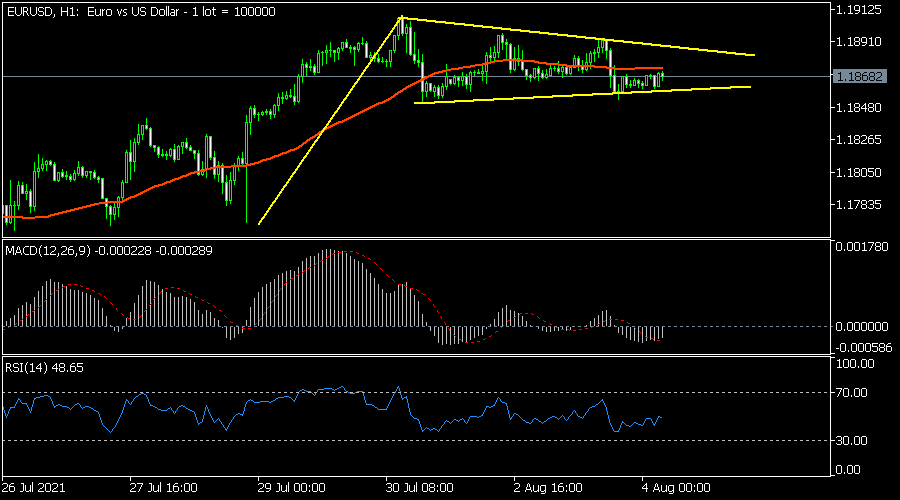
The EURUSD pair was little changed at 1.1870. This price was slightly below last week’s high of 1.1905. On the hourly chart, the pair has formed a bullish pennant pattern. Oscillators like the MACD and the RSI are at the neutral level. It is also at the 25-day moving averages. Therefore, the pair will likely keep rising as bulls target the upper side of the pennant at 1.1890. It will then have a bullish breakout ahead of the US jobs data.
AUDNZD
The AUDNZD pair declined sharply after the latest New Zealand jobs data. On the 4 hour chart, the pair declined below the important support at 1.0520. This price was at the lower side of the bearish flag pattern. It has also moved below the 25-day moving average while the Relative Strength Index (RSI) has declined to the oversold level. Therefore, the pair will likely maintain the bearish trend as the economic divergence between New Zealand and Australia emerges.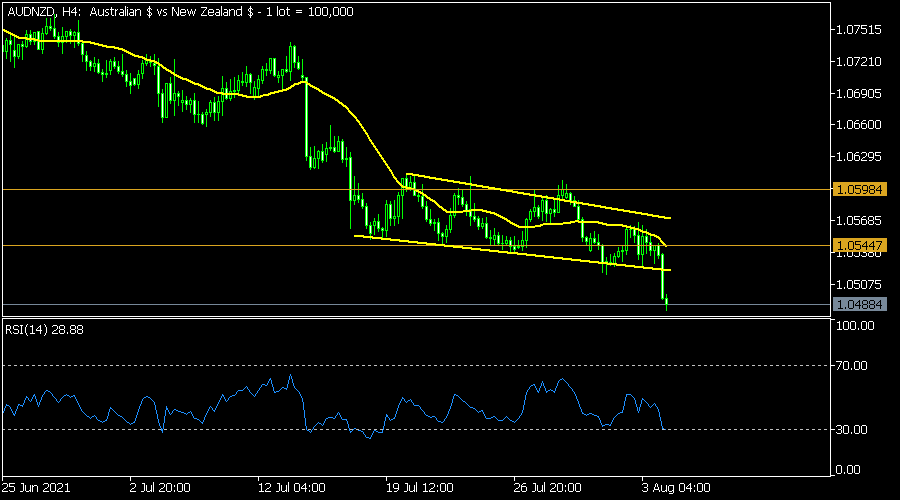
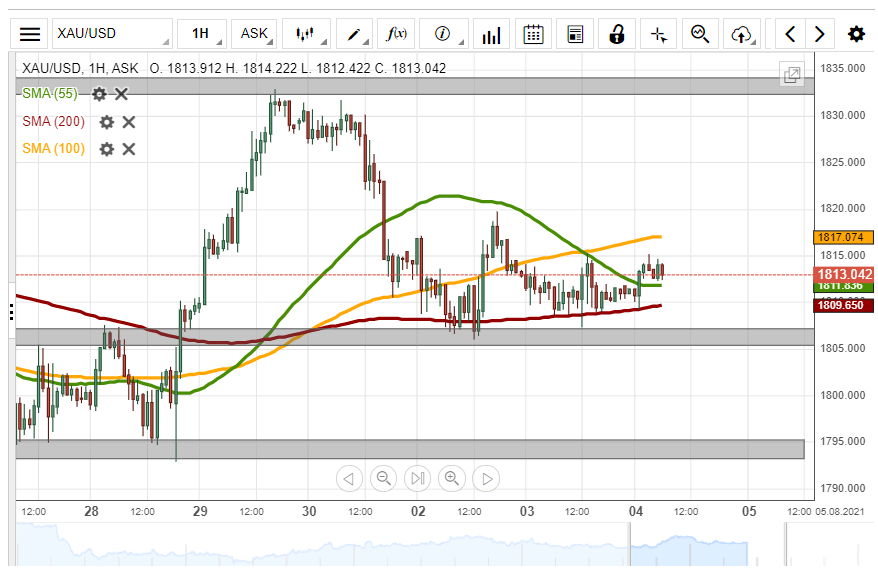
XAU/USD Tests 200- Hour SMA Support
On Tuesday, the yellow metal's price drooped by 55 pips or 0.30%. The 200– hour simple moving average provided support for the commodity during Tuesday's trading session.
Technical indicators suggest selling signals on the 4H time-frame chart. Most likely, sellers could continue to drive the price lower during the following trading session.
However, the 200– hour SMA at 1809.3 could still provide support for the XAU/USD exchange rate within this session.