Sample Category Title
XAU/USD Bouces Off Support
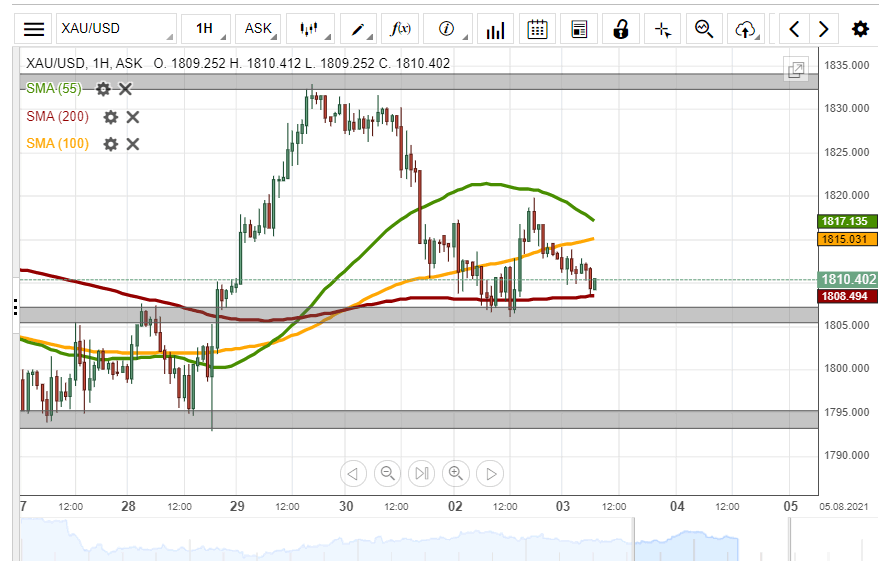
The XAU/USD exchange rate bounced off a support level formed by the 200– hour simple moving average at 1808.23 on Monday. As a result, the commodity surged by 127 pips or 0.70% during Monday's trading session.
All things being equal, gold could edge higher against the US Dollar during the following trading session. The possible target for buyers could be near the 1830.00 area.
However, the 100– hour simple moving average at 1814.39 could provide resistance for the exchange rate in the shorter term.
RBA Board Surprises by Maintaining Current Policy Settings
The RBA Board decided to maintain current policy settings despite forecasting a contraction in the September quarter. The rationale is that the experience points to the economy bouncing back quickly and that presumably a policy change may have undermined confidence in that outlook.
At its August meeting, the Reserve Bank Board decided to maintain the policy settings that it had adopted in July.
In particular, the Board decided to persevere with its decision to scale back bond purchases in early September from 5bn to 4bn per week until at least mid-November. The decision on the purchase pace from mid-November will be made at the November Board meeting, when the Board will receive a revised set of economic forecasts for the November Statement on Monetary Policy.
We found this decision surprising given that the consistent guidance which the Board has provided is that “the program will continue to be reviewed in light of economic conditions and the health situation”. A key reason behind Westpac’s view that the Board would respond to the current economic downturn was that it now appears that the economy will contract in the September quarter – a significant deterioration from the situation in July.
The Governor notes that “GDP is expected to decline in the September quarter”. Unlike previous statements which are made just before the full set of forecasts in the Statement on Monetary Policy, he does not indicate the extent of the downward revision to growth in calendar 2021. Westpac has revised down its growth rate in 2021 from 4.8% to 3.2% and acknowledges a strong bounce back in 2022, increasing our forecast from 3.2% to 4.2%.
The RBA was forecasting 4.75% for 2021 and has lifted its 2022 forecast from 3.5% to 4.0%. That probably implies that the RBA is not expecting as big a downturn in the September quarter as Westpac’s -2.2%, but nevertheless, a significant change from a month ago.
While markets were not expecting the Board to lift the current purchase program from 5bn to 6bn, as advocated by Westpac, a strong consensus was that the taper from 5bn to 4bn would be deferred. The rationale behind the Board’s decision seems to hinge on “the experience to date has been that once virus outbreaks are contained the economy bounces back quickly”. This is also Westpac’s central case, but the Delta variant represents a complex set of risks, and it seems surprising that the Board would not have adjusted this flexible policy instrument in recognition of those risks.
In the Minutes of the July meeting, it was noted that “members acknowledged that an argument could be made to maintain the pace of bond purchases at 5bn per week”. This aspect of the Board discussion was not communicated in the Governor’s statement following the July meeting. So despite no indication today of a healthy debate, it may be that we see more colour on this issue in the Minutes.
Following the strong labour report for May, which was not available for the last set of forecasts, we are not surprised that the unemployment forecast for 2022 has been reduced from 4.5% to 4.25%. There is also an uplift in the inflation forecast, with the forecast in the May Statement on Monetary Policy at 2% for mid-2023, and the full 2023 forecast being set at 2.25%.
Conclusion
With such a major change in the economic outlook and yet no response to the current bond program, the hurdle for adjusting policy is surprisingly high.
Westpac’s view was that the bond purchase program was designed to be a flexible policy instrument that could respond to unexpected shocks, allowing the RBA to support government policy to deal with the current crisis. In that regard, we thought that the market consensus for merely deferring the taper would not have sent a sufficiently strong signal and believed that an actual lift in the program size was the appropriate response.
Arguably, what we have seen today is the view that adjusting policy may have detracted from the perception of the RBA’s confidence in the recovery.
The Board will still retain flexibility to respond in September or October should conditions deteriorate substantially more than their central view. However, given the decision today in light of such a sharp deterioration in the near-term outlook, it seems likely that there will be no policy adjustment in September and October.
Westpac’s central case remains that by the November Board meeting, the recovery will be underway, particularly supported by widespread vaccination, and it would then be appropriate for the Board to scale back its purchases to a 3bn weekly pace.
We remain comfortable with our view that the Board will begin raising the cash rate in the March quarter of 2023 and are encouraged by the improved medium-term outlook in the RBA’s forecasts for unemployment, inflation, and economic growth.
Daily Tecnical Analysis
EUR/USD
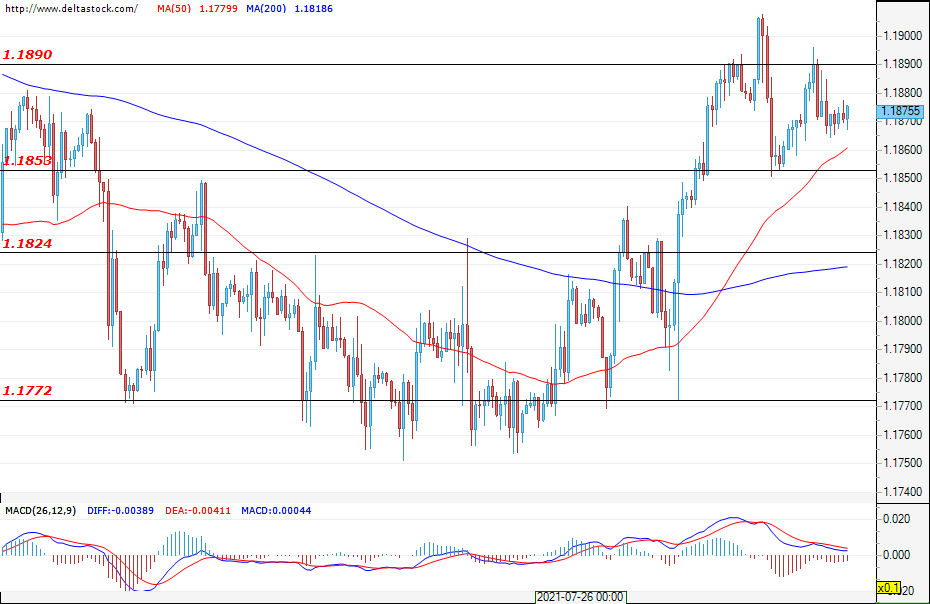
Current level - 1.1875
The uptrend for the currency pair is currently slowing down and the first obstacle is the resistance at around 1.1890. However, the trend seems ready to reverse and the expectations are for a breakout in this area and an attack of the next resistance at around 1.1955. The first daily support the bulls can expect at around 1.1853. If it fails to withstand the bearish pressure, the next one is at 1.1824 – a key area for the evolving movement. Today, no events are expected in the economic calendar that could significantly increase volatility.
| Resistance | Support | ||
| intraday | intraweek | intraday | intraweek |
| 1.1890 | 1.1970 | 1.1853 | 1.1705 |
| 1.1955 | 1.2070 | 1.1772 | 1.1600 |
USD/JPY
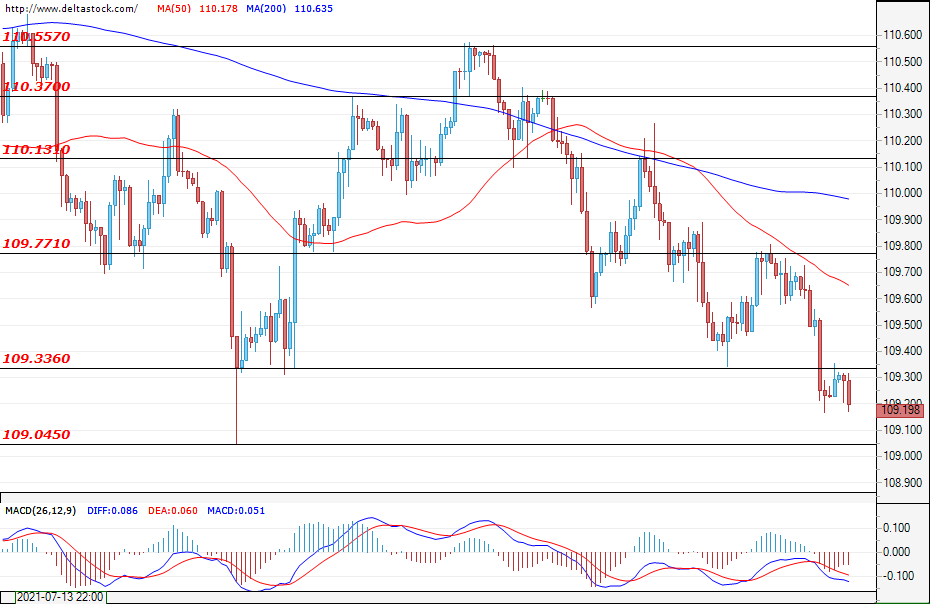
Current level - 109.19
The U.S. dollar continues to lose ground against the Japanese yen after the upward move from the end of last week was limited to just below the resistance level at 109.85. A successful breach of the support at 109.55 could boost the sell-off and pave the way for the currency pair towards a test of the next significant support zone at around 109.00. A consolidation of the range movement between 109.00 - 110.75, coming from the higher time frames, is also not excluded.
| Resistance | Support | ||
| intraday | intraweek | intraday | intraweek |
| 109.33 | 110.13 | 109.04 | 108.55 |
| 109.77 | 110.37 | 108.70 | 108.10 |
GBP/USD
Current level - 1.3890
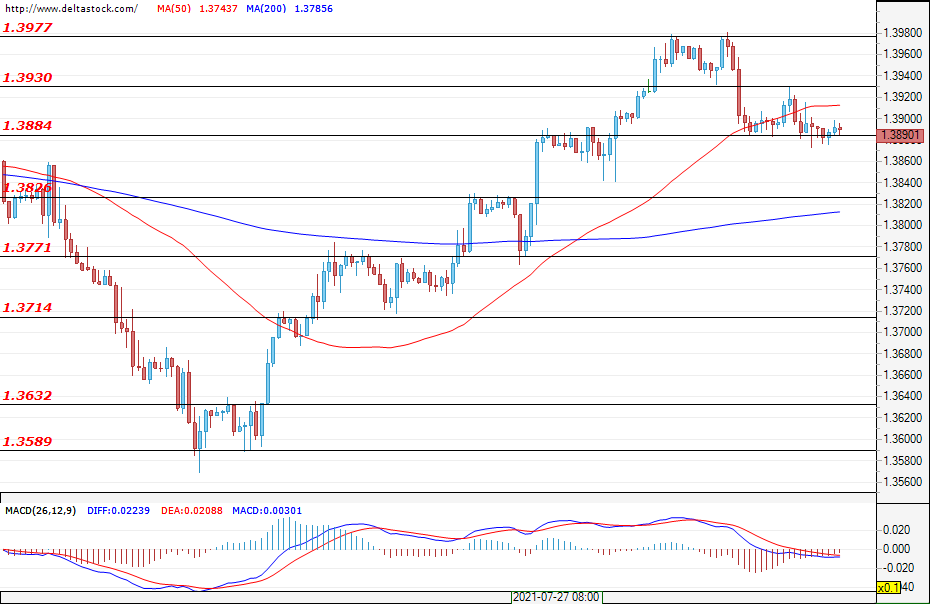
The cable slowed its growth and there was a breach in the uptrend after the pair failed to reach a new peak following a test of the support at 1.3884. The market may need more time before it could move forward, but a breach of the 1.3884 support, and a deeper correction towards 1.3826, is also a possible scenario.
| Resistance | Support | ||
| intraday | intraweek | intraday | intraweek |
| 1.3930 | 1.4060 | 1.3884 | 1.3771 |
| 1.3977 | 1.4115 | 1.3826 | 1.3714 |
NAS 100 Extends Consolidation
US stock markets remain supported thanks to strength among corporate earnings.
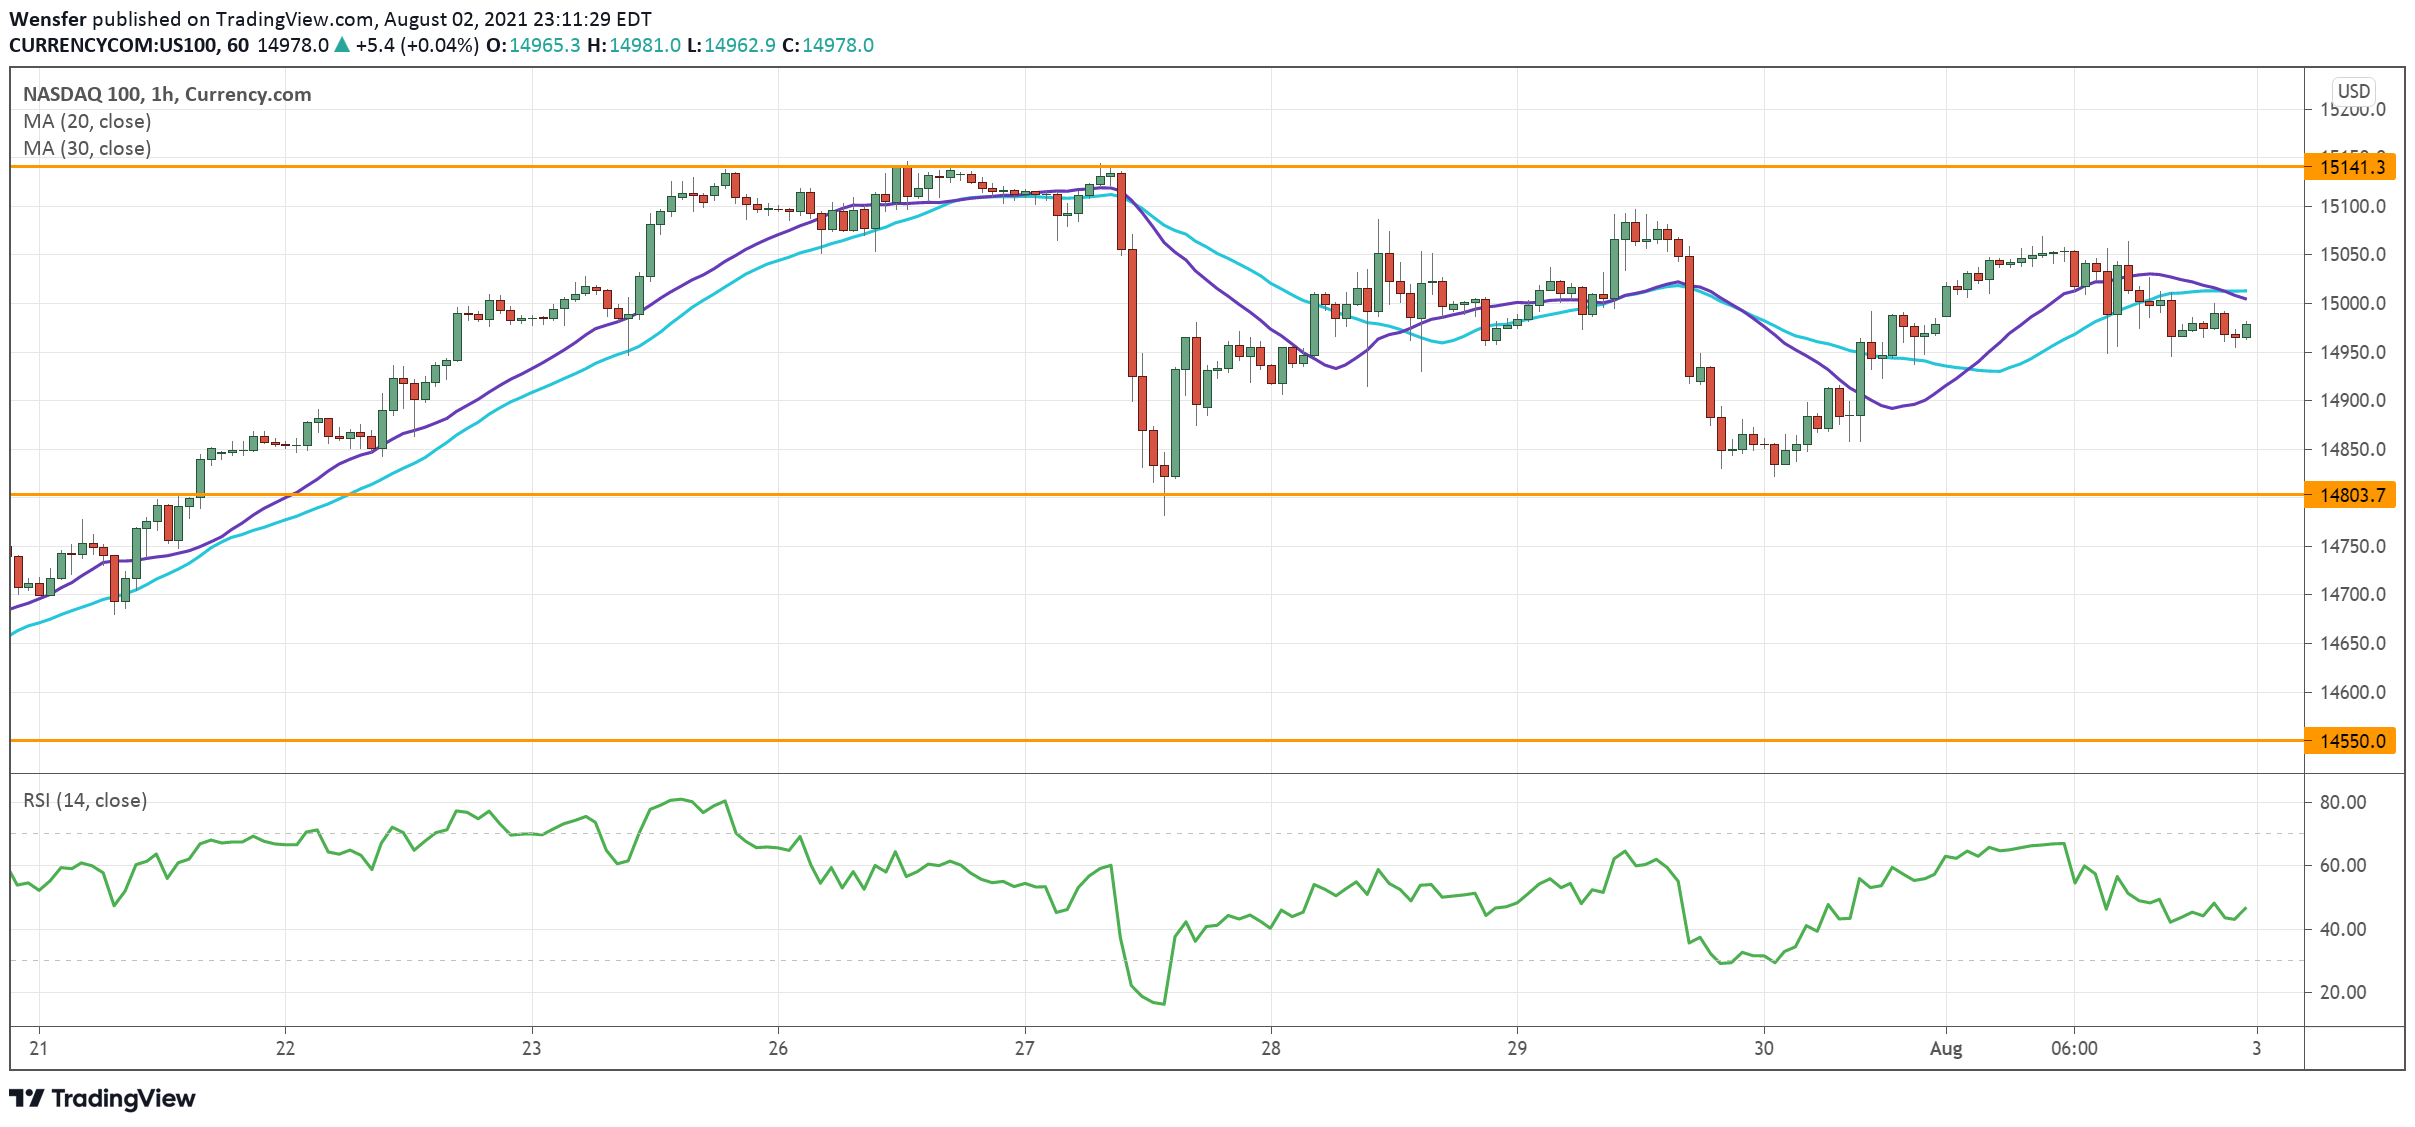
The Nasdaq 100 has slowly ground its way up from the 20-day moving average. The price action has once again bounced off the demand zone above 14800.
As the index recoups its previous losses, there is high hope that the rally could resume to new all-time highs. For this, the bulls will need to lift offers around the peak at 15140. Failing that, a pullback towards 14550, a key level on the daily chart would be the path of least resistance.
USD/CHF Falls Towards Daily Support
The US dollar inches lower as July’s ISM Manufacturing PMI fell short of expectations.
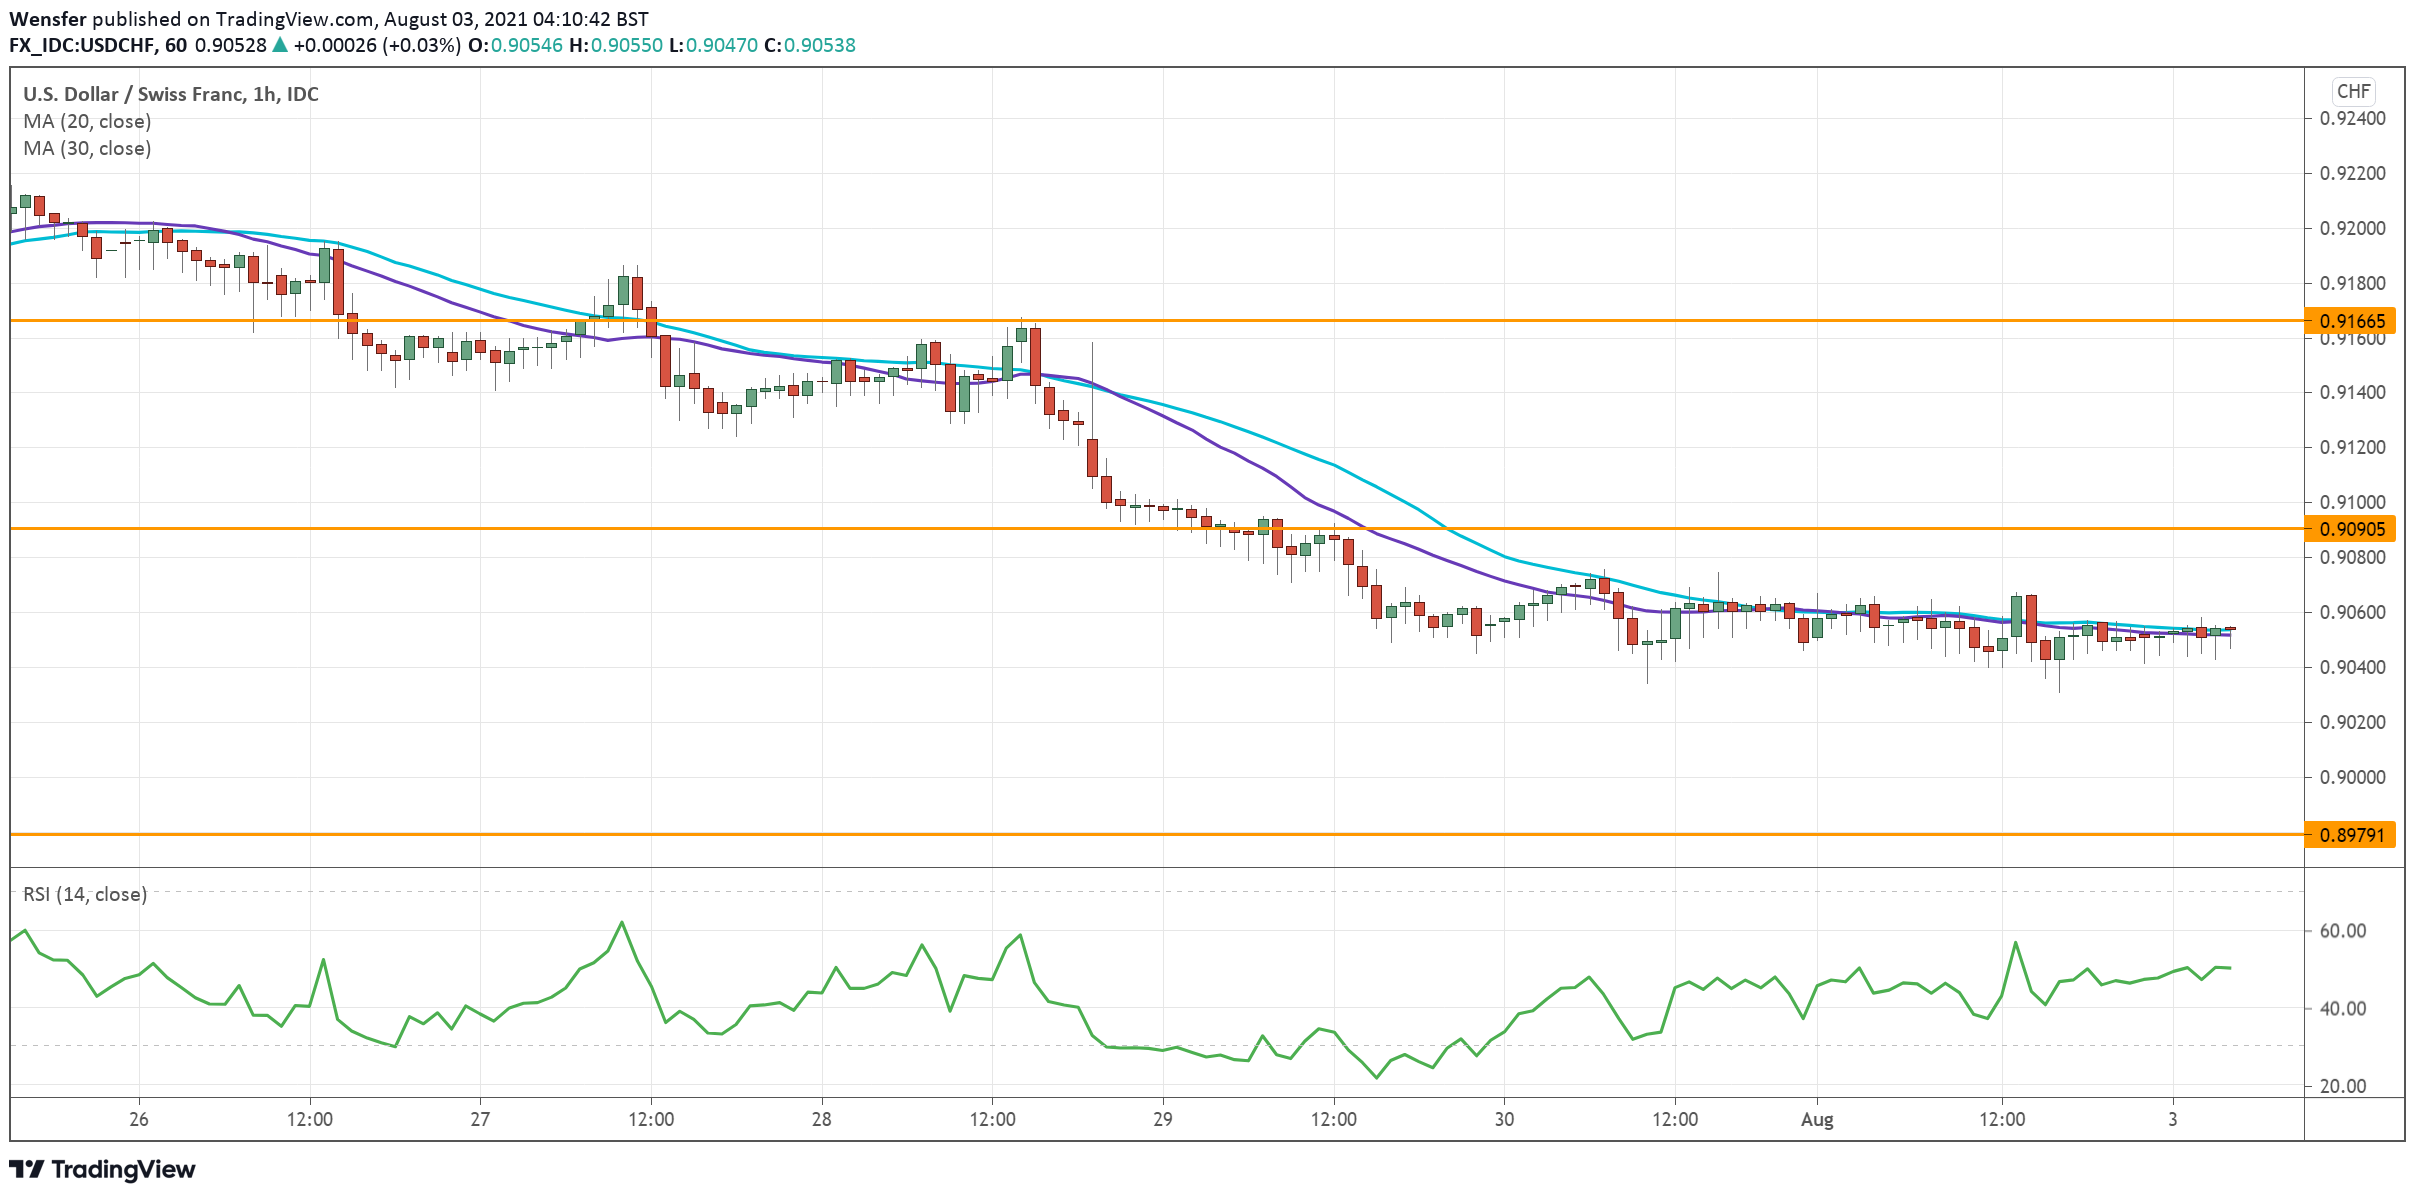
The pair dipped further in the bearish territory after 0.9070 failed to keep the price afloat. An oversold RSI has helped the greenback to claw back some lost ground.
However, the rebound may be short-lived as sentiment favors selling into strength. 0.9090 is the hurdle where sellers could be waiting to jump in at a better price
0.8980 at the origin of the June rebound is a critical demand zone on the daily chart.
USD/JPY Struggles For Support
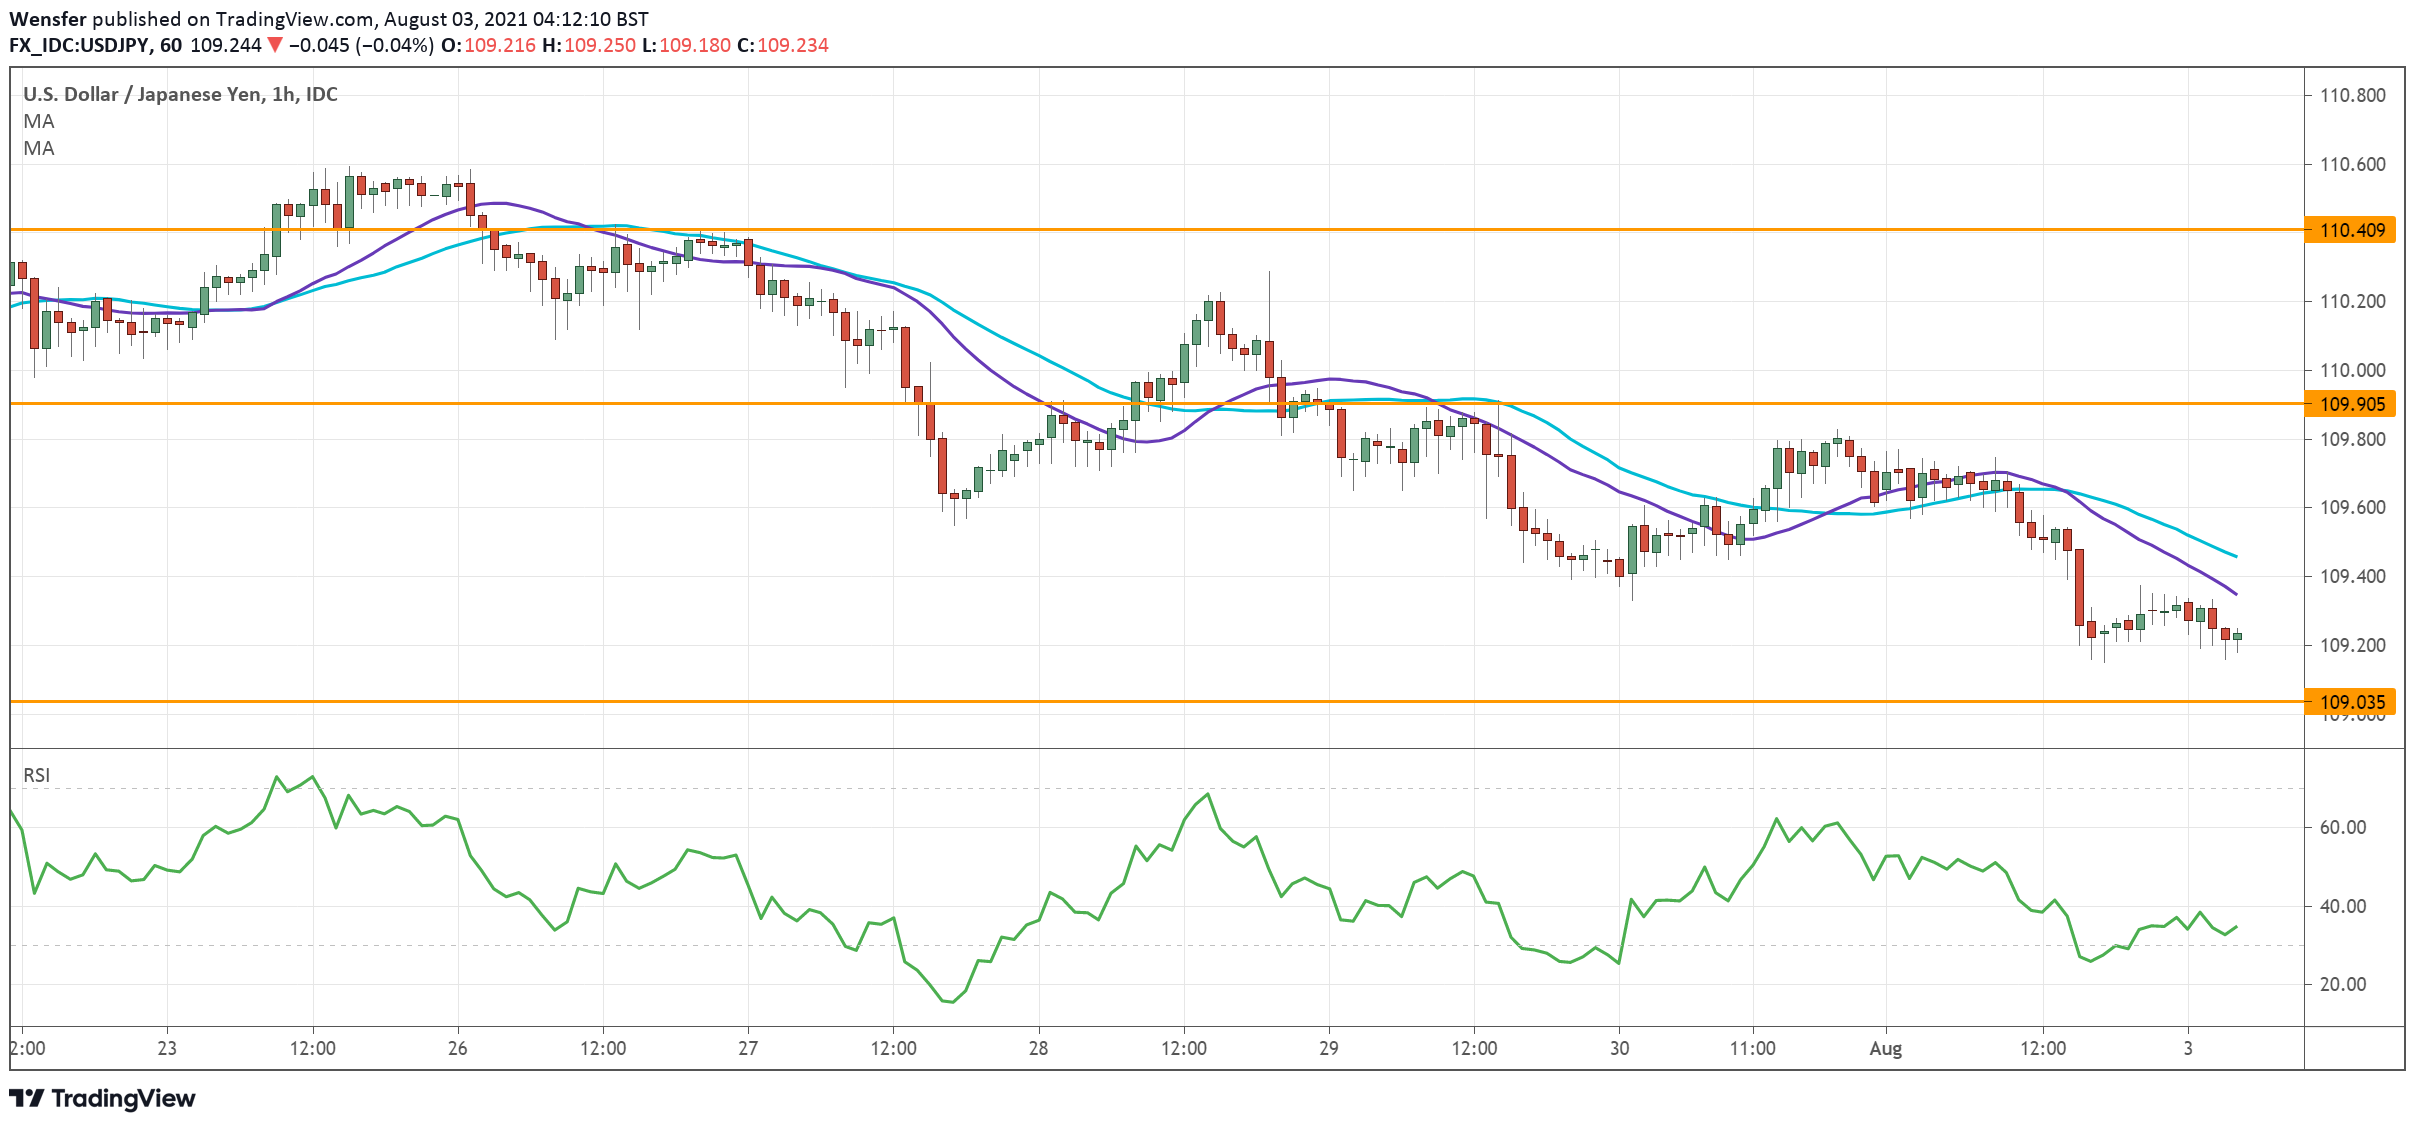
The Japanese yen strengthened on better-than-expected Tokyo CPI in July. The bearish MA cross from the daily timeframe may have put the bulls on the defensive.
The dollar’s struggle to keep its head above 109.60 suggests a lack of commitment from the long side. 109.90 has established itself as a fresh resistance.
The RSI has risen back into the neutrality area, giving sellers room to push lower. 109.00 is the closest support and its breach could deepen the correction for the days to come.
USDCAD Bearish Bias
Technical analysis
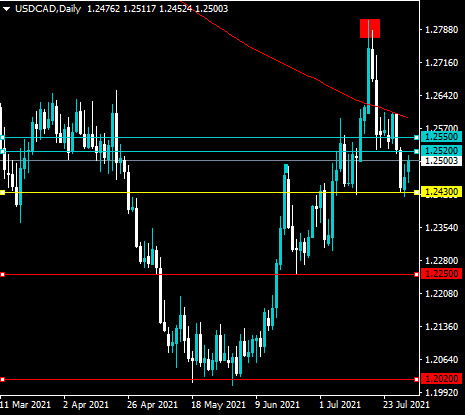
The USDCAD pair is at risk of further heavy losses after forming a large head and shoulders pattern across the four-hour time frame.
The four-hour price trend remains technically bearish while the USDCAD pair trades beneath its 200-period moving average, around the 1.2600 resistance level.
What the possible outcomes are
In our most likely scenario, the downward price trend continues as the USDCAD pair ignites the mentioned bearish head and shoulders pattern on the four-hour time frame.
Alternatively, the USDCAD pair will stage a recovery back towards the 1.2550 resistance level as a final right-hand shoulders forms to complete the head and shoulders pattern.
Key levels
Support 1.2430 1.2250 1.2020
Resistance 1.2520 1.2550 1.2600
BTCUSD Neutral Bias
Technical analysis
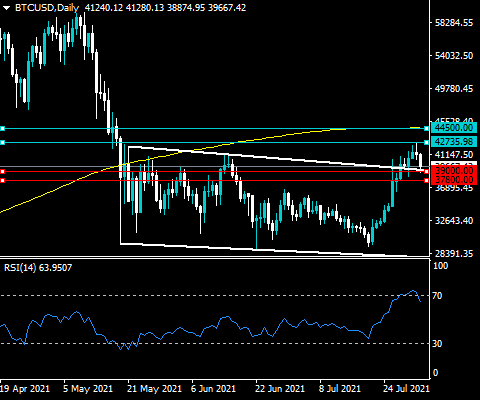
The daily time frame shows that the RSI indicator currently from overbought conditions and the downside in the BTCUSD pair may not yet be over.
The BTCUSD pair has tested the top a large falling price channel and rebounded, and is far managing to defend downside attempts on the $39,000 level.
What the possible outcomes are
In our most likely scenario, the BTCUSD pair continues to defend the $39,000 support area and then bounces back towards the $42,700 or $44,500 resistance levels..
Alternatively, the BTCUSD pair will stage an even greater technical correction down towards the $37,800 level and recover back towards the $42,700 level.
Key levels
Support $39,000 $37,800
Resistance $42,700 $44,500
GBPJPY Turning Bearish
Technical analysis
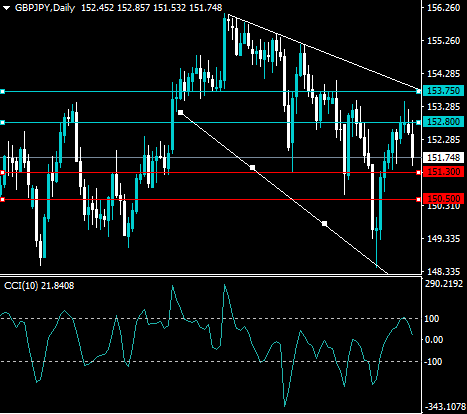
The daily time frame shows that the GPJPY pair has failed to break above the top a large descending broadening wedge pattern, which is increasing the chances of a downside correction.
The Commodity Channel Index indicator on the daily time frame highlights that the GBPJPY pair is also overbought around current trading level.
What the possible outcomes are
In our most likely scenario, the GBPJPY pair will fall towards the 150.50 area due to the fact that it is currently overbought and the Japanese yen is gaining strength amongst major currencies.
Alternatively, the GBPJPY pair may stage a modest price pullback towards the 151.40 level before rally to a new high, around the 153.00 level.
Key levels
Support 151.40 150.50
Resistance 152.20 153.00
XAUUSD Is Possibly Bearish
Technical analysis
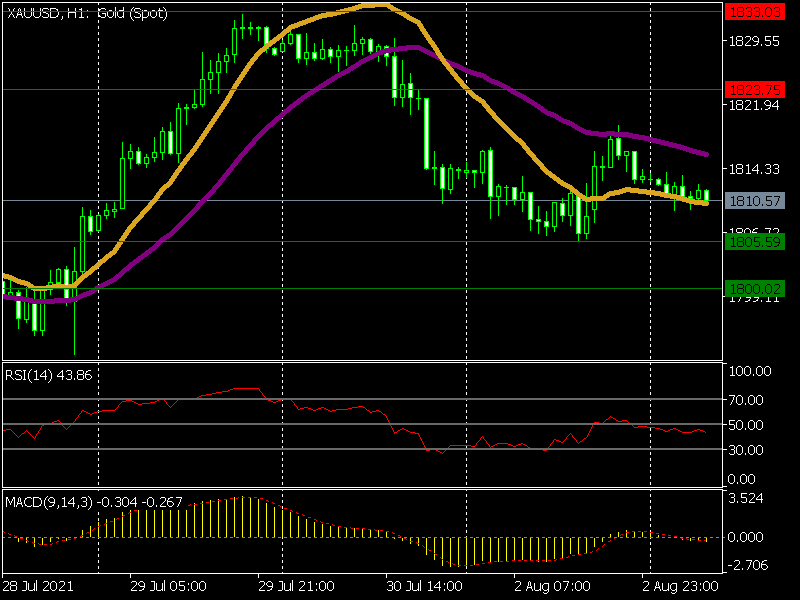
The EMA(100) is higher than the EMA (50), which is beneficial for bears
The RSI is below 50
The MACD line is slightly below 0 and shows that the downtrend may prevail.
What the possible outcomes are
The XAUUSD pair is pressured towards yesterday's lows of 1,805.
In our most likely scenario, XAUUSD may experience a downward correction towards the first support level of 1,805.59.
If the price passes the first support level, we can expect a continued downtrend towards the second support level of 1,800.02.
Conversely, it's possible to see the pair rise towards the first resistance level of 1,823.75.
If the pair manages to surpass the first resistance level, we should expect a continued surge towards the second resistance level of 1,833.03.
Key levels
Support 1,805.59 1,800.02
Resistance 1,823.75 1,833.03