

Sample Category Title
Swiss Franc Soars as Dollar Retreats
The Swiss franc enjoyed a strong week, as the US dollar declined significantly against the majors. USD/CHF has fallen close to the symbolic 90-level, as it is currently trading at 0.9044. Just how bad did the US dollar perform last week? USD/CHF fell 1.46%, its worst weekly showing since April.
The dollar managed to rally on Friday and the dollar index rose to 92.09 on Friday. However, the dollar index has dipped below the 92 level on Monday and is currently at 0.9197. A break of either 91.50 or 92.60 which signal a major directional move; in the meantime, we could be in for a week of choppy range trading.
US inflation misses target
The week ended with key US inflation numbers for June, which came in lower than expected. The Core PCE Price Index, the Fed’s preferred inflation indicator, rose 0.4% MoM (0.6% est.) and 3.5% YoY (3.7% est). The surge in inflation hasn’t boosted the US dollar, as the Fed has consistently poured cold water on any expectations of a hike in interest rates anytime soon in order to curb inflation.
The markets have bought into the Fed script that the rise in inflation is temporary, but if inflation remains at low levels, this sales pitch to the markets will become increasingly difficult. The PCE price index is running at 4% annually, while CPI is even higher. Both have easily overshot the Fed inflation target of 2%, and upcoming inflation reports will be closely monitored by the markets and the Fed.
In Switzerland, the KOF Economic Barometer slowed for a second straight month, from 133.3 to 129.8. The reading was within expectations. The index remains above the long-term average, but the May reading of 143.2 may have been a peak that the economy cannot sustain.
USD/CHF Technical
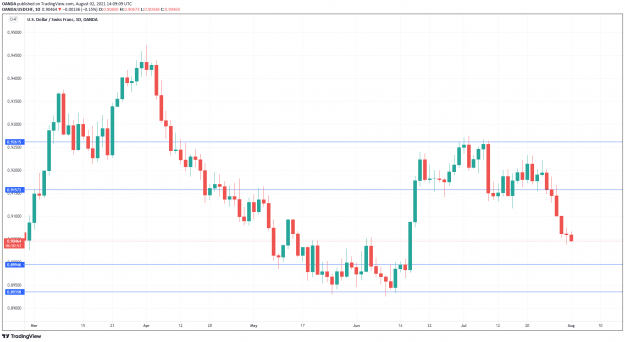
- USD/CHF faces resistance at 0.9157. Above, there is resistance at 0.9265
- On the downside, there is support at 0.8994. This is followed by support at 0.8835
US ISM manufacturing dropped to 59.5, corresponds to 4.7% annualized GDP growth
US ISM Manufacturing dropped from 60.6 to 59.5 in July, below expectation of 60.8. ISM said "the past relationship between the Manufacturing PMI and the overall economy indicates that the Manufacturing PMI for July (59.5 percent) corresponds to a 4.7-percent increase in real gross domestic product (GDP) on an annualized basis,"
Looking at some more details, new orders dropped from 66.0 to 64.9. Production dropped from 60.8 to 58.4. Employment rose from 3.0 to 52.9. Supplier deliveries dropped from -2.6 to 72.5. Prices dropped -6.4 to 85.7.
Off to a Good Start
Stock markets off to a bright start on Monday, bouncing back well after Friday's downbeat end to the week.
There was an abundance of event risk last week and rather than inspire, it seemed to push investors to the sidelines and it never really took off. Friday was a bit of a negative way to wrap things up but looking back, it wasn't really an accurate reflection of how events unfolded. Perhaps month end had a hand to play in that.
Earnings are still very strong, despite the downside risks to the outlook for many companies and the Fed was very balanced which should keep a taper tantrum at bay. Risks naturally remain, not least the impact that delta will have on the various populations, behaviour and restrictions but there's plenty of cause for optimism going into year-end.
The introduction of a $1 trillion infrastructure bill into the Senate may be giving sentiment a bit of a bump at the start of the week. There is still some way to go but this was an important step towards some much needed investment.
A mixed bag of PMI data
The PMIs we've seen from around the globe on Monday highlight the collective challenges facing manufacturers but also the vast differences between countries as a result of vaccine rollouts. The common complaint is unsurprisingly on the supply side which is causing higher input costs, much to the unease of central banks that are seeing higher inflation as a result. Although the widely held belief is that it is temporary and will relieve itself once supply shortages are overcome.
Covid remains a massive downside risk for many countries, especially those with very low vaccine rates and that's likely to continue to weigh heavily going foward as the delta variant spreads rapidly. Regional differences in the vaccine distribution is going to create big disparities between the economic recoveries we see, with major developed nations seeing the greatest benefits this year and next.
Oil lower after China PMIs
Oil prices have slipped more than 1% on Monday on the back of the weaker than expected Chinese PMI readings. A slowdown in the world's second largest economy would be a big blow for the region at a time when numerous countries are struggling to get to grips with the latest Covid wave.
Prices have recovered some of their earlier losses and remain not far off their highs. Part of today's declines may simply be a fact of timing, with the Chinese data coming at a time when you would expect to see some profit taking kicking in. The numbers from Europe are very encouraging and similarly strong data is expected from the US.
So despite the PMIs coming from China and other parts of Asia, oil prices are likely to remain well supported going into the end of the year. The major risks to this are a new vaccine-resistant variant and US supply ramping up dramatically as a result of these higher prices.
Gold slips but remains technically bullish
Gold prices have slipped back towards where they traded for most of July. This is despite US yields and the dollar slipping back a little which makes me think this move is more technically driven, than being a more bearish signal.
The yellow metal ran into resistance just above $1,830, around the same area it struggled a couple of weeks earlier. As long as it holds above $1,790, the outlook looks favourable. A move above that resistance zone could give the yellow metal a bit of a kick, with $1,850 then being key above here.
Bitcoin corrects after breaking key resistance
It seems we're seeing some profit taking in bitcoin after the crypto broke $41,000 - a level it's struggled with since late May. A move above here could have been the catalyst for one of those turbo-charged rallies we've seen so often before but instead we're seeing a more patient approach.
Prices have cooled over the weekend and today and we find ourselves back below $40,000. The price saw support around $38,300 on Friday so that will be the first test if it continues to fall. I will be surprised to see this pullback gather any signficiant momentum though. Price action has turned a lot more bullish in recent weeks, this is just looking like a small corrective move.
EUR/USD Mid-Day Outlook
Daily Pivots: (S1) 1.1846; (P) 1.1878; (R1) 1.1903; More...
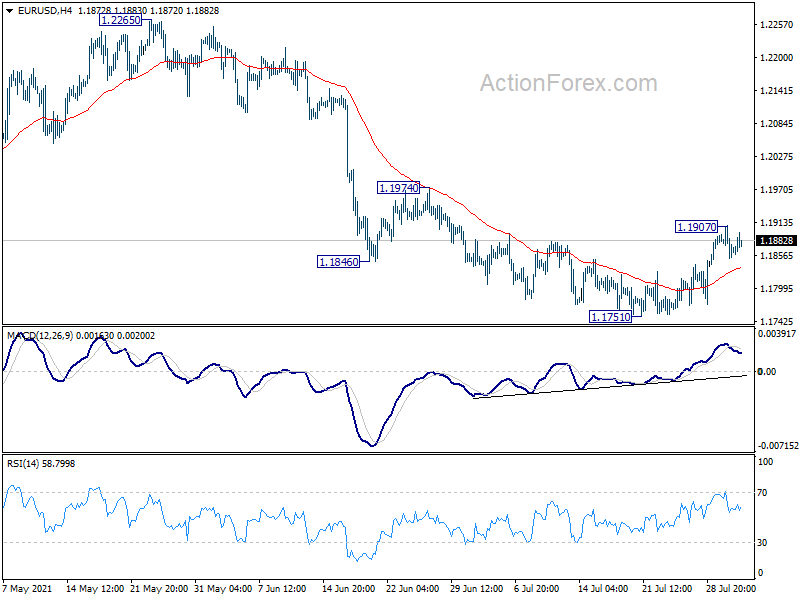
Intraday bias in EUR/USD remains neutral and outlook is unchanged. Current development argues that a short term bottom is formed at 1.1751. Above 1.1907 will target 1.1974 resistance first. Firm break there should argue that whole corrective pattern from 1.2348 has completed. On the downside, however, break of 1.1751 will resume the fall from 1.2265 to 1.1703 support instead.
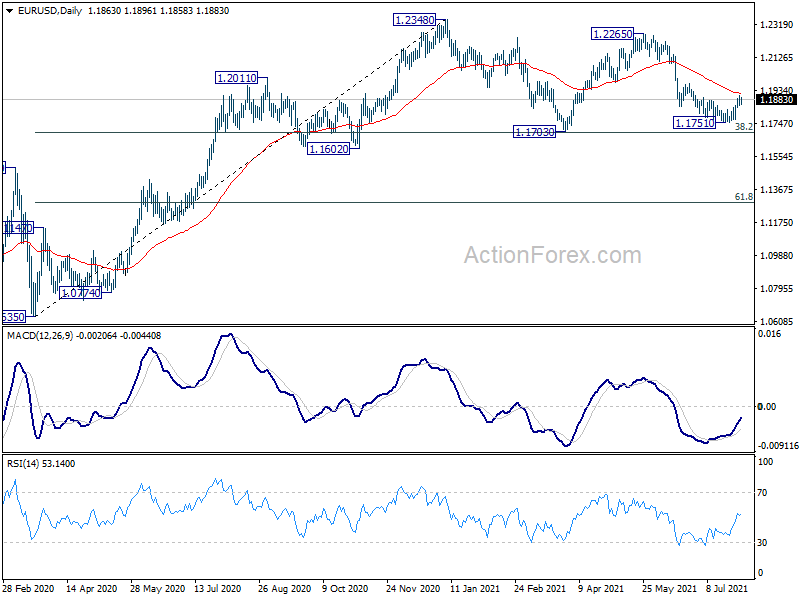
In the bigger picture, rise from 1.0635 is seen as the third leg of the pattern from 1.0339 (2017 low). Further rally could be seen to cluster resistance at 1.2555 next, (38.2% retracement of 1.6039 to 1.0339 at 1.2516). This will remain the favored case as long as 1.1602 support holds. Reaction from 1.2555 should reveal underlying long term momentum in the pair. However sustained break of 1.1602 will argue that the rise from 1.0635 is over, and turn medium term outlook bearish again.
USD/CHF Mid-Day Outlook
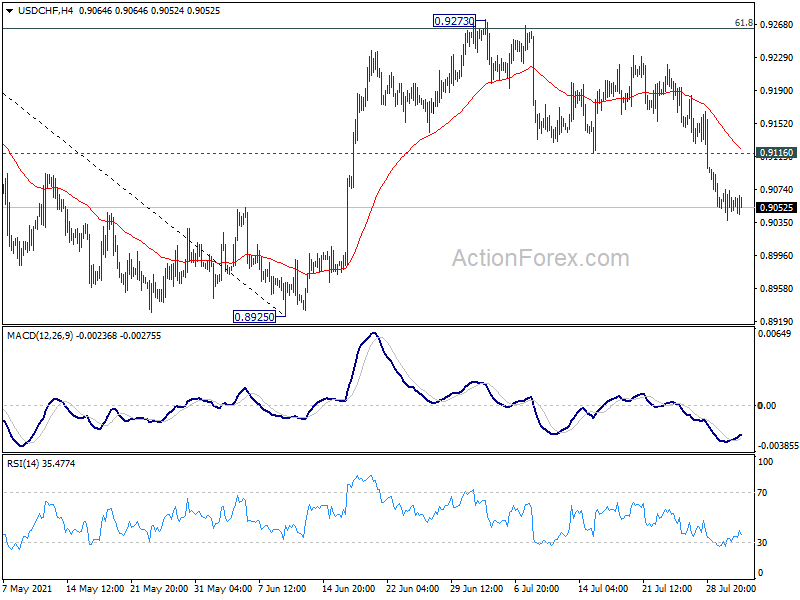
Daily Pivots: (S1) 0.9036; (P) 0.9056; (R1) 0.9072; More....
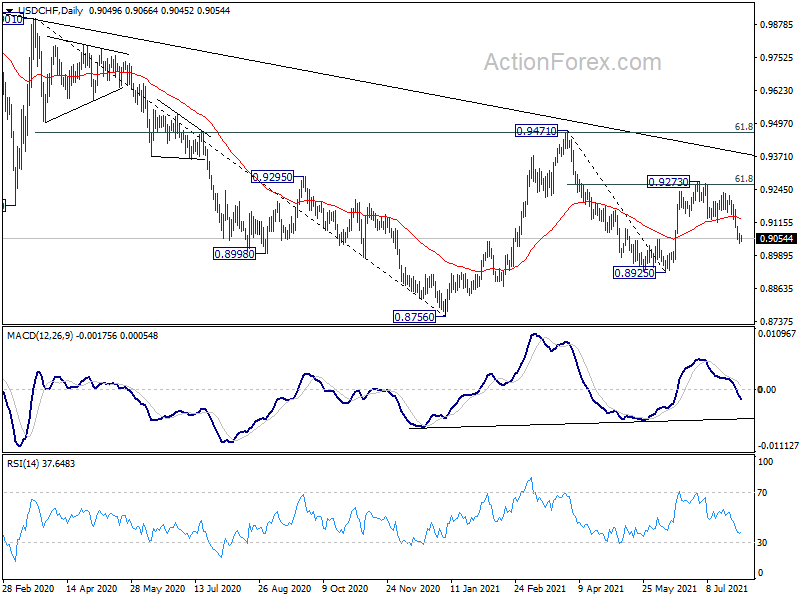
Intraday bias in USD/CHF stays on the downside for the moment. Rebound from 0.8925 should have completed at 0.9273. Deeper fall would be seen to retest 0.8925 low. On the upside, above 0.9116 support turned resistance will mix up the near term outlook and turn intraday bias neutral first.
In the bigger picture, failure to sustain above 55 week EMA (now at 0..9183) affirms medium term bearish in USD/CHF. Break of 0.8925 support should resume the whole decline form 1.0342 (2016 high) through 0.8756 low. For now, risk will stay on the downside as long as 0.9273 resistance holds, in case of rebound.
USD/JPY Mid-Day Outlook
Daily Pivots: (S1) 109.40; (P) 109.62; (R1) 109.87; More...
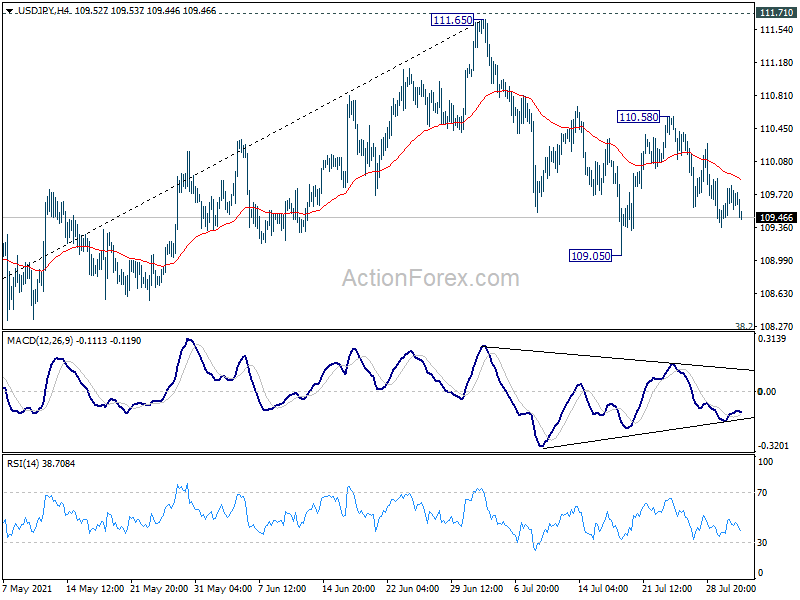
Range trading continues in USD/JPY and intraday bias remains neutral. On the downside, break of 109.05 will resume the decline from 111.65. Next target is 38.2% retracement of 102.58 to 111.65 at 108.18. On the upside, break of 110.58 will resume the rebound from 109.05, for retesting 111.65 high.
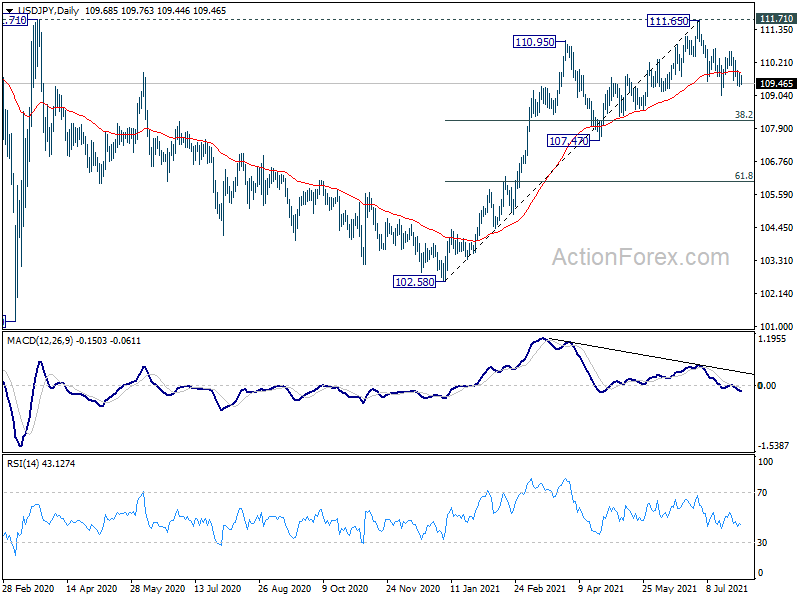
In the bigger picture, medium term outlook is staying neutral with 111.71 resistance intact. The pattern from 101.18 could still extend with another falling leg. Sustained trading below 55 day EMA will bring deeper fall to 107.47 support and below. For now, outlook won't turn bullish as long as 111.71 resistance holds, even in case of strong rebound.
GBP/USD Mid-Day Outlook
Daily Pivots: (S1) 1.3869; (P) 1.3927; (R1) 1.3965; More....
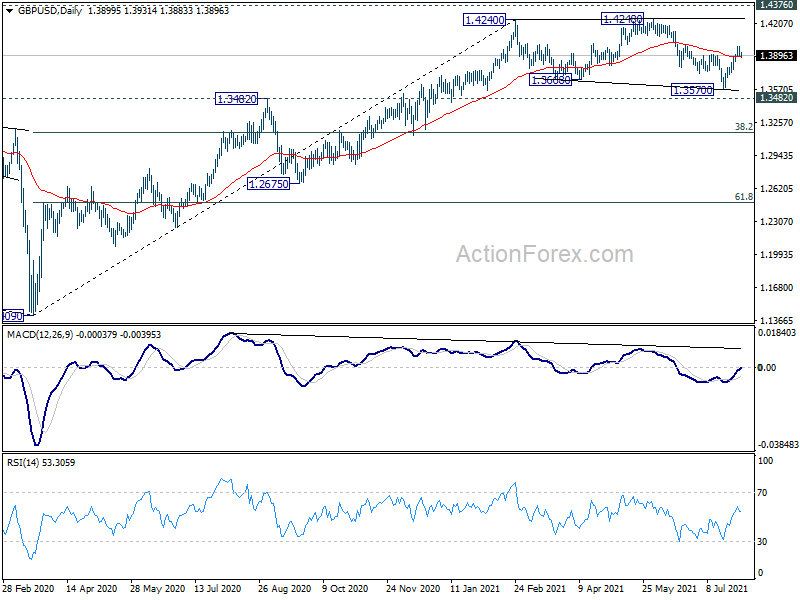
GBP/USD is staying in consolidation below 1.3982 temporary top. Intraday bias remains neutral at this point. Corrective pattern from 1.4240 could have completed with three waves down to 1.3570. Further rise is expected as long as 1.3766 support holds. On the upside, break of 1.3982 will resume the rise from 1.3570 to retest 1.4248 high. However, break of 1.3766 support will dampen this bullish view and bring retest of 1.3570.
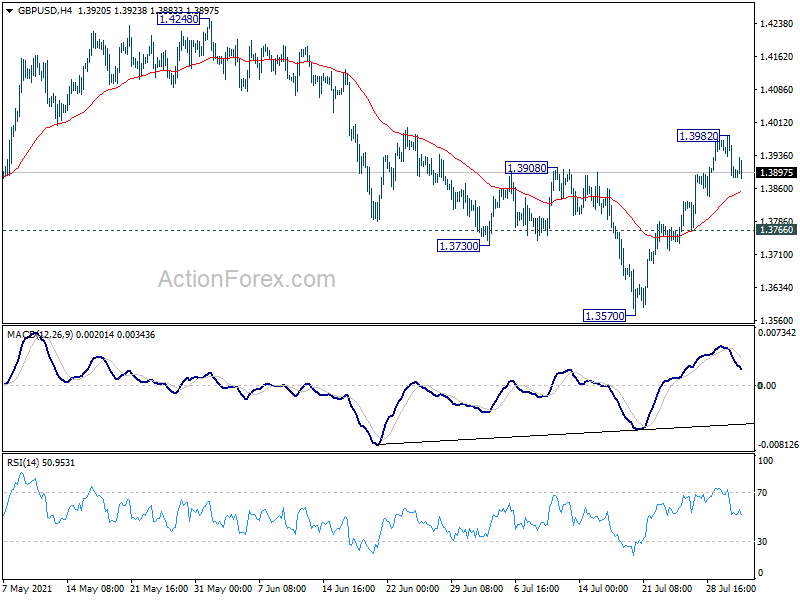
In the bigger picture, as long as 1.3482 resistance turned support holds, up trend from 1.1409 should still continue. Decisive break of 1.4376 resistance will carry larger bullish implications. However, firm break of 1.3482 support will argue that the rise from 1.1409 has completed. GBP/USD would then be seen in another leg of long term range pattern between 1.1409 and 1.4376. Deeper fall could then be seen to 61.8% retracement of 1.1409 to 1.4248 at 1.2493, and even below.
Sterling Weakens in Mixed Trading, Euro Recovers
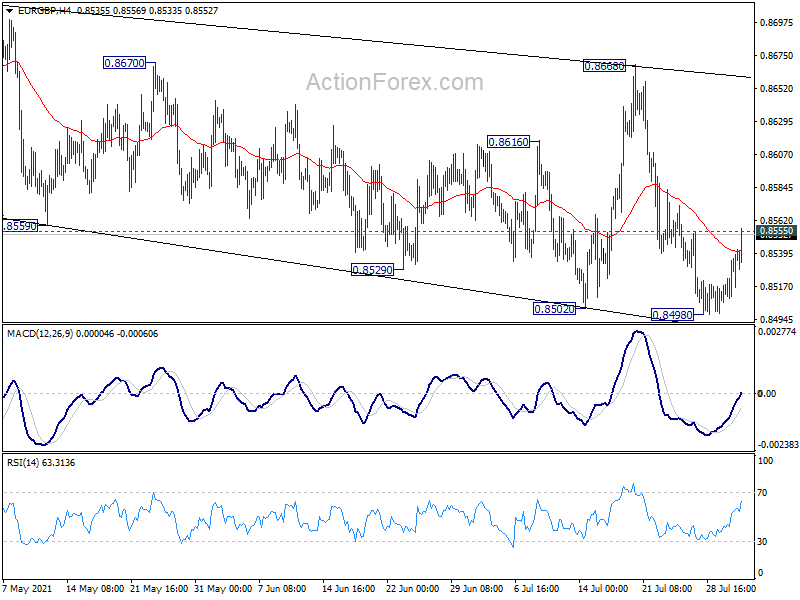
Sterling is notably lower today in otherwise mixed markets. Euro is also firm, with help from recovery against the Pound. Aussie is the stronger one, mainly because it's paring last week's losses. Upside is so far limited ahead of tomorrow's RBA monetary policy decision. On the other hand, Swiss Franc softens mildly, paring some of last week's gains.
Technically, firm break of 0.8555 resistance in EUR/GBP would indicate short term bottoming at 0.8498. Stronger rebound could follow for 0.8868 resistance. If happens, we'd see if that wold translate into selling in the Pound, like breaking through 151.55 minor support in GBP/JPY. Or, Euro will rise on the rise, with EUR/USD breaking through 1.1907 temporary top.
In Europe, at the time of writing, FTSE is up 0.63%. DAX is up 0.19%. CAC is up 0.74%. Germany 10-year yield is up 0.010 at -0.449. Earlier in Asia, Nikkei rose 1.82%. Hong Kong HSI rose 1.06%. China Shanghai SSE rose 1.97%. Singapore Strait Times dropped -0.18%. Japan 10-year JGB yield rose 0.0016 to 0.021.
UK PMI manufacturing finalized at 60.4, stretched supply chains led to sharp rise in costs
UK PMI Manufacturing was finalized at 60.4 in July, down from June's 63.9. Markit said output and new order growth eased to four-month lows. Stretched supply chains led to sharp rise in costs.
Rob Dobson, Director at IHS Markit, said: "Although July saw UK manufacturers report a further month of solid growth, scarcities of inputs, transport and labour are stifling many businesses. On one hand, manufacturers are benefiting from reopening economies.... On the other, the recent surge in global manufacturing growth has led to another month of near-record supply chain delays, exacerbated by factories and their customers building up safety stocks....
"Demand outstripping supply is also driving up prices. Input costs again rose at a near survey-record pace, leading to a near-record increase in manufacturers' selling prices. Amid growing indications that many supply chain disruptions and raw material shortages are unlikely to be fully resolved until 2022, the outlook remains one of constrained growth combined with high inflation for the foreseeable future."
Eurozone PMI manufacturing finalized at 62.8, inflows of new orders outstripping production to unprecedented extent
Eurozone PMI Manufacturing was finalized at 62.8 in July, down from June's 63.4. Markit said output and order growth rates slowed, but employment rose at survey-record pace. Inflation rates hit new highs as supply chain disruptions continue.
The readings for most member states except Germany declined, but remained strong: Netherlands (67.4), Germany (65.9), Austria (63.9), Italy (60.3), Spain (58.0), France (58.0), Greece (57.4).
Chris Williamson, Chief Business Economist at IHS Markit said: "July survey showed inflows of new orders outstripping production to an extent unprecedented in the survey's 24-year history. Capacity constraint indicators continue to flash red. Input shortages worsened again in July at a near record rate and July saw another near-record rise in backlogs of work.... Prices pressures meanwhile show no sign of abating, with July seeing another record increase in both input costs and prices charged for goods as demand exceeds supply, and concerns over future supply availability flare up again."
Germany PMI Manufacturing was finalized at 65.9 in July, up from June's 65.1. The future was the third-highest since the survey began in 1996. There was survey-record increase in employment. Also, both price indices reached new record highs.
France PMI Manufacturing was finalized at 58.0 in July, down from June's 59.0. Markit said production growth remained strong, but slowed. Supplier performance continued to deteriorate substantially. Input prices rose at fastest rate since March 2011.
Swiss CPI rose to 0.7% yoy in Jul, retail sales rose 0.1% yoy in Jun
Swiss CPI came in at -0.1% mom, 0.7% yoy in July, matched expectations. That compared to June's reading of 0.1% mom, 0.6% yoy.
Retail sales rose 0.1% yoy mom in real term in June, well below expectation of 3.4% yoy. Sales excluding service stations dropped -0.5% yoy. Food, drinks and tobacco dropped -2.1% yoy. Non-food sector rose 1.2% yoy.
SVME PMI rose to 71.1 in July, up from 66.7, above expectation of 61.5.
Australia AiG manufacturing dropped to 60.8, further easing ahead
Australia AiG Performance of Manufacturing Index dropped -2.4 pts to 60.8 in July. Looking at some details, production rose 1.1 to 61.8. Employment rose 0.5 to 60.8. New orders dropped sharply by -8.1 to 62.5. Exports dropped -6.6 to 53.6. Input prices rose 5.8 to 84.6. Selling prices rose 1.1 to 64.7.
Ai Group Chief Executive Innes Willox said: "While COVID-19 outbreaks and associated restrictions in some states undoubtedly dampened the upswing in activity and shook confidence, the manufacturing sector recorded another strong month of expansion in July.... The slower pace of the manufacturing upswing in July and the slower pace of growth in new orders suggest further easing in the months ahead. A significant headwind for the sector is that Sydney's toughest restrictions relate to local government areas where there is a concentration of manufacturing sites and the manufacturing workforce."
Japan PMI manufacturing finalized at 53.0 in Jul, sharp rise in cost burdens
Japan PMI Manufacturing was finalized at 53.0 in July, up from June's 52.4. Markit said output and new orders rose at faster rates. There were sharp rise in cost burdens amid supply chain disruption. Businesses reported softer optimism regarding future output.
Usamah Bhatti, Economist at IHS Markit, said: "The Japanese manufacturing sector continued to see an improvement in operating conditions... the pace of expansion quickened as firms recorded stronger growth in both output and new orders... supply chain disruption continued to impact activity within the sector, with firms recording the second greatest deterioration in lead times in over a decade. Material shortages and logistical disruption contributed to a rapid rise in average cost burdens, as input prices rose at the fastest pace since September 2008.
China Caixin PMI manufacturing dropped to 50.3 in Jul, recovery not yet solid
China Caixin PMI Manufacturing dropped to 50.3 in July, down from 51.3, below expectation of 51.0. Caixin said output growth slowed amid slight drop in new orders. Staffing levels were broadly unchanged while inflationary pressures eased.
Wang Zhe, Senior Economist at Caixin Insight Group said: "China's official second-quarter economic figures were in line with expectations, but the Caixin China manufacturing PMI in July and relevant data suggested the recovery of the economy is not yet solid. The economy is still facing huge downward pressure, and we need to ensure entrepreneurs' confidence."
GBP/USD Mid-Day Outlook
Daily Pivots: (S1) 1.3869; (P) 1.3927; (R1) 1.3965; More....
GBP/USD is staying in consolidation below 1.3982 temporary top. Intraday bias remains neutral at this point. Corrective pattern from 1.4240 could have completed with three waves down to 1.3570. Further rise is expected as long as 1.3766 support holds. On the upside, break of 1.3982 will resume the rise from 1.3570 to retest 1.4248 high. However, break of 1.3766 support will dampen this bullish view and bring retest of 1.3570.
In the bigger picture, as long as 1.3482 resistance turned support holds, up trend from 1.1409 should still continue. Decisive break of 1.4376 resistance will carry larger bullish implications. However, firm break of 1.3482 support will argue that the rise from 1.1409 has completed. GBP/USD would then be seen in another leg of long term range pattern between 1.1409 and 1.4376. Deeper fall could then be seen to 61.8% retracement of 1.1409 to 1.4248 at 1.2493, and even below.
Economic Indicators Update
| GMT | Ccy | Events | Actual | Forecast | Previous | Revised |
|---|---|---|---|---|---|---|
| 22:30 | AUD | AiG Performance of Manufacturing Index Jul | 60.8 | 63.2 | ||
| 0:30 | JPY | Manufacturing PMI Jul F | 53 | 52.2 | 52.2 | |
| 1:00 | AUD | TD Securities Inflation M/M Jul | 0.50% | 0.40% | ||
| 1:45 | CNY | Caixin Manufacturing PMI Jul | 50.3 | 51 | 51.3 | |
| 5:00 | JPY | Consumer Confidence Index Jul | 37.5 | 36 | 37.4 | |
| 6:00 | EUR | Germany Retail Sales M/M Jun | 4.20% | 2.00% | 4.20% | 4.60% |
| 6:30 | CHF | Real Retail Sales Y/Y Jun | 0.10% | 3.40% | 2.80% | |
| 6:30 | CHF | CPI M/M Jul | -0.10% | -0.10% | 0.10% | |
| 6:30 | CHF | CPI Y/Y Jul | 0.70% | 0.70% | 0.60% | |
| 7:30 | CHF | SVME PMI Jul | 71.1 | 66 | 66.7 | |
| 7:45 | EUR | Italy Manufacturing PMI Jul | 60.3 | 61.5 | 62.2 | |
| 7:50 | EUR | France Manufacturing PMI Jul F | 58 | 58.1 | 58.1 | |
| 7:55 | EUR | Germany Manufacturing PMI Jul F | 65.9 | 65.6 | 65.6 | |
| 8:00 | EUR | Eurozone Manufacturing PMI Jul F | 62.8 | 62.6 | 62.6 | |
| 8:30 | GBP | Manufacturing PMI Jul F | 60.4 | 60.4 | 60.4 | |
| 13:45 | USD | Manufacturing PMI Jul F | 63.1 | 63.1 | ||
| 14:00 | USD | ISM Manufacturing PMI Jul | 60.8 | 60.6 | ||
| 14:00 | USD | ISM Manufacturing Prices Paid Jul | 93.2 | 92.1 | ||
| 14:00 | USD | ISM Manufacturing Employment Jul | 49.9 | |||
| 14:00 | USD | Construction Spending M/M Jun | 0.30% | -0.30% |
Euro Still Holds a Strong Position
The major currency pair is stable at the beginning of August, growing slightly. EURUSD is rising to 1.1870.
The dollar is still coping with the negative influence of the comments by the Fed's head Jerome Powell. Last week, he stated that interest rates are far from being lifted because the labor market has obstacles to overcome. This disarmed dollar fans who had previously relied on the idea that the Fed would be winding the stimulation up quite soon.
Still, Friday statistics saved the dollar from a more serious slump. Personal expenses of Americans in July grew by 1% m/m against the forecast 0.7% of growth and a preceding decline by 0.1% m/m. The income stabilized and grew by 0.1% m/m after a slump by 2.2% m/m in June. An active anti-coronavirus vaccination canpaign made consumers more mobile, spending more on traveling and leisure.
Moreover, the final CCI by University of Michigan in June grew to 81.2 points from 80.8 points previously. This also supported the dollar.
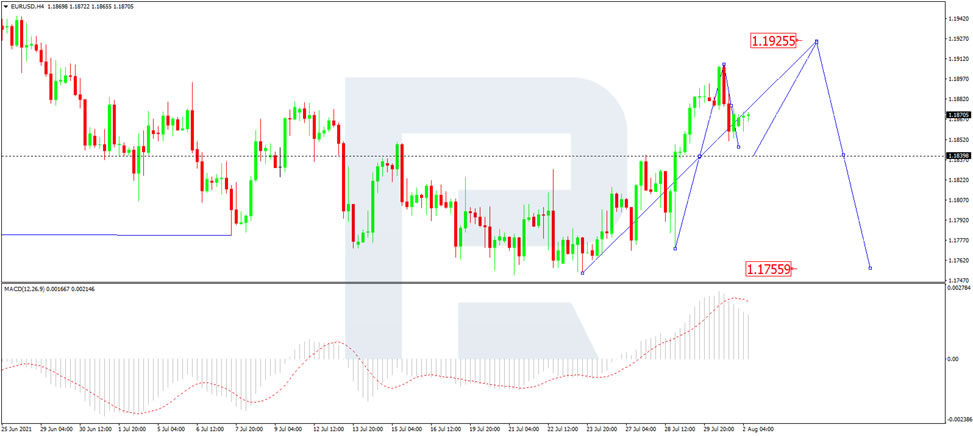
On H4, EUR/USD quotations have completed a wave of growth to 1.1840. At the moment, the market has formed a consolidation range around this level, broke through the high of the range, and performed a link of growth to 1.1908. Practically, this level is regarded as the local goal of a correction. Today, the price might drop to 1.1840 (a test from above). After that, another structure of growth to 1.1925 is expected. There the correction should be over, followed by a wave of decline to 1.1755.
Technically, this scenario is confirmed by the MACD. Its signal line has escaped the histogram area and is declining to zero.
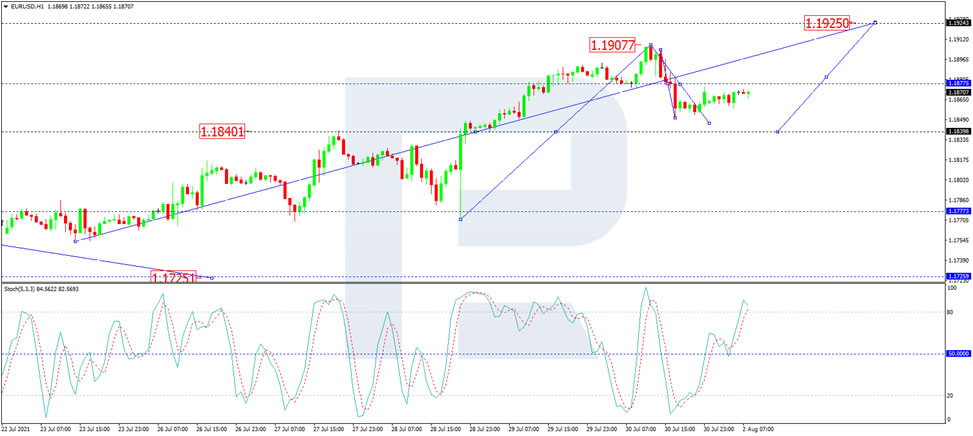
On H1, EUR/USD quotations have reached 1.1908 and are trading in a wave of decline to 1.1840. At the moment, the market broke through 1.1875 downwards and completed a link of decline to 1.1850. Today, we expect a link of growth to 1.1875 (a test from below), followed by a decline to 1.1840. Then another structure of growth to 1.1925 might develop.
Technically, this scenario is confirmed by the Stochastic oscillator. Its signal line is trading above 80, which presumes a soon decline to 50, and after it is broken away — to 20.
The US Economic Growth Exceeds Expectations
The new trading month started with the market participants focusing on Friday’s NFP report. Because the Federal Reserve of the United States has a dual mandate, one that focuses on both price stability and job creation, the way the labor market performs is viewed as decisive for the future path of monetary policy.
While inflation has reached the Fed’s target, there is still a lot of room for improvement in the labor market. Fed’s definition of full employment leaves room for more strength before the rates could be lifted.
In the middle of last week, the Fed signaled that it is in no rush to lift the rates. Most likely, it remains intentionally behind the curve, wanting to see more strength in the labor market before acting.
But inflation and economic growth may trigger action from the Fed sooner than the market expects. We’ve seen the Gross Domestic Product released last week coming out much stronger than the expectations.
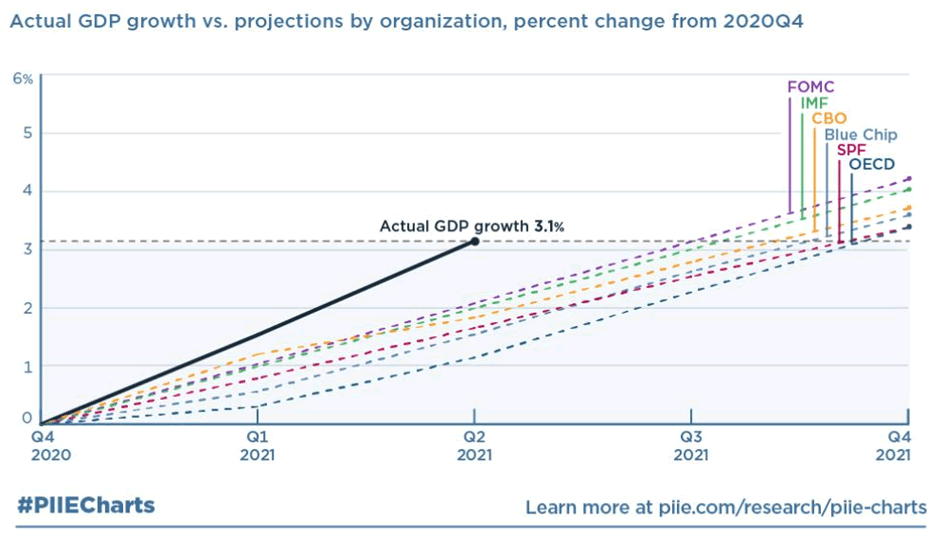
US GDP Grows Much Faster Than Forecasters Expected
The chart above shows a projection for the US GDP made by various institutions in the last quarter of 2020. All of them, including the FOMC, IMF, and OECD, have underestimated the growth of the US economy.
As it turned out, the actual growth path out of the economic recession is much steeper, with positive spillover effects for the main US trade partners. Because the United States is the largest economy in the world, a stronger economic recovery there is enough to add one percentage point or more to global growth.
Before the passage of the America Rescue plan, most forecasters expected that the economy would grow by 3/4%-4.2% in the four quarters of 2021. But the data released last week shows that the economy grows at an annualized rate of 6.4%, much higher than expected.
The solid growth should support the equity markets and keep the US dollar offered. Because most central banks in the developed world have adopted similar monetary policies, which are still loose, the market is dominated by risk-on/risk-off gyrations. Until we see central banks lifting rates, the chances are that the markets will remain correlated.