Sample Category Title
GBP/USD Breaks Channel
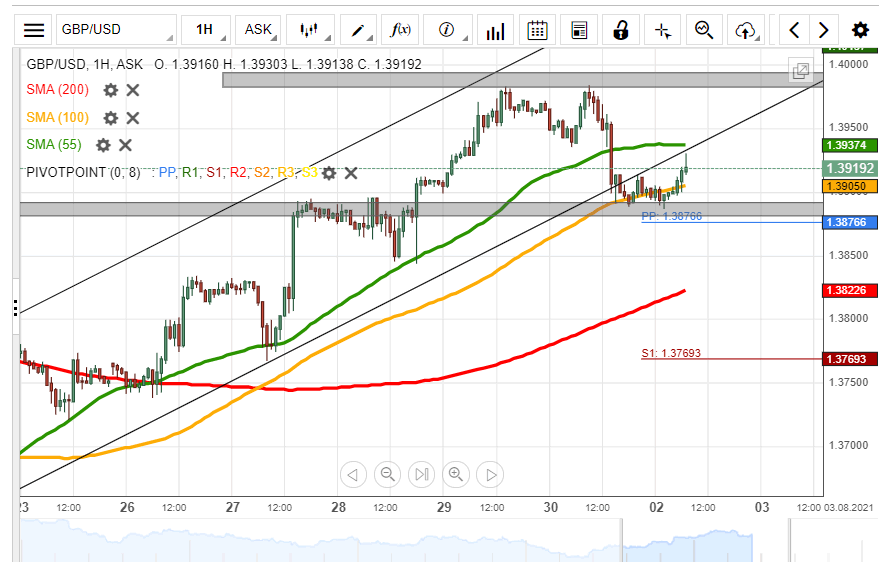
On Friday, the British Pound edged lower by 86 pips or 0.62% against the US Dollar. The currency pair breached the lower boundary of an ascending channel pattern during Friday's trading session.
Given that a breakout had occurred, the exchange rate is likely to continue to decline during the following trading session. The possible target for sellers will be near the 200– hour SMA at 1.3816.
On the other hand, the GBP/USD currency exchange rate could reverse from the weekly pivot point at 1.3876 and target the resistance level at 1.4015 within this session.
USD/JPY Could Target 200– Hour SMA
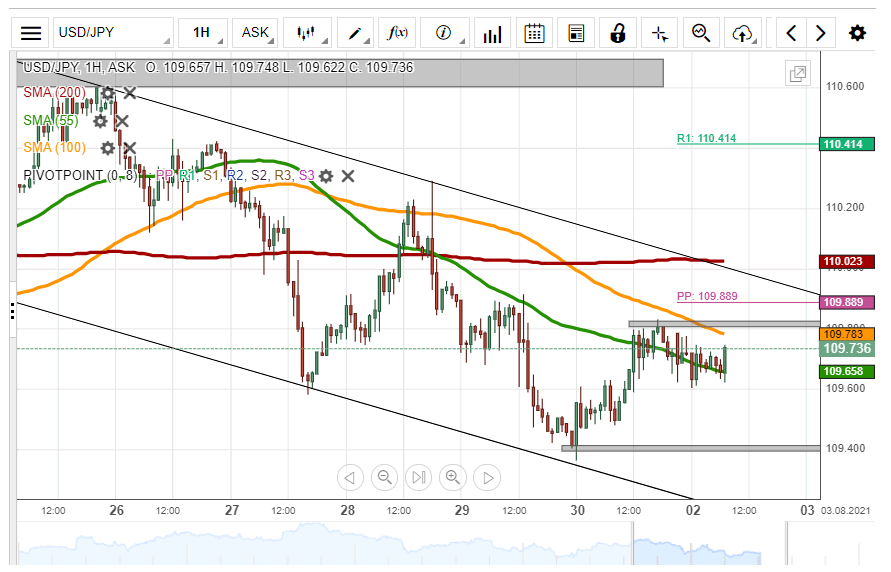
On Friday, the US Dollar edged higher by 40 pips or 0.35% against the Japanese Yen. The currency pair breached the 55– hour simple moving average during Friday's trading session.
As for the near future, the USD/JPY exchange rate is likely to continue to edge higher. Buyers could target the 200– hour SMA at 110.02 within the following trading session.
Although, the 100– hour moving average at 109.80 could provide resistance for the currency exchange rate in the shorter term.
XAU/USD Nears 1808.12
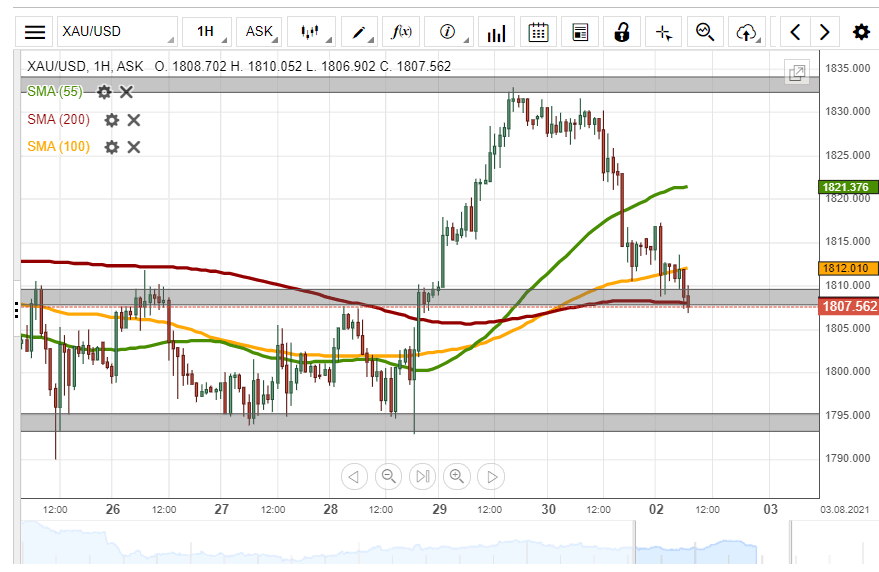
On Friday, the yellow metal's price plummeted by 195 pips or 1.07%. The commodity breached the 55– hour simple moving average during Friday's trading session.
By and large, the XAU/USD exchange rate could continue to edge lower during the following trading session. The possible target for bearish traders will be near the 1795.00 area.
However, sellers are likely to encounter support at 1808.12 within Monday's trading session.
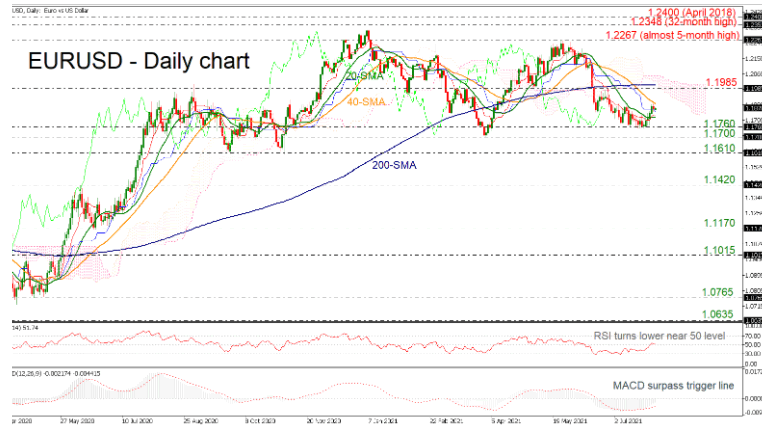
EURUSD Pulls Back Off 40-Day SMA Around 1.1900
EURUSD found strong resistance at the 40-day simple moving average (SMA), which was hovering near the 1.1900 psychological level.
The RSI is ticking lower, trying to fall beneath its neutral threshold of 50; however, the MACD is still extending its bullish bias above its trigger line in the negative region. In trend indicators, the red Tenkan-sen line is approaching the blue Kijun-sen line, suggesting a positive bias.
If the price jumps above the 40-day SMA, immediate resistance could come from the 1.1985 and the 200-day SMA before moving towards the almost five-month high of 1.2267. Surpassing these obstacles, the 32-month peak of 1.2348 could attract attention.
Otherwise, a continuation of the negative move could meet the 1.1760 and the 1.1700 significant levels. The latter may act as a turning point before moving lower until the 1.1610 support.
Looking at the bigger picture, EURUSD has been in a neutral tendency since January and any climbs above the 200-day SMA may add optimism for a brighter outlook.
XRPUSD Still Bullish
Technical analysis
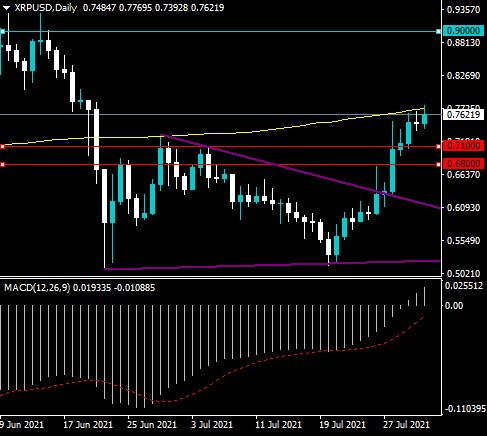
The XRPUSD pair continues to enjoy strong dip-buying demand and is testing back towards its trend defining key 200-day moving average.
The MACD indicator on the daily time frame still shows that XRPUSD has significant upside potential, and a bullish breakout from a falling wedge pattern is underway.
What the possible outcomes are
In our most likely scenario, the XRPUSD pair will start to rally towards the $1.0500 level after breaking above its key 200-day moving average.
Alternatively, XRPUSD consolidates around its key 200-day moving average, and then correct one final time back towards the 0.6800 support level.
Key levels
Support 0.7100 0.6800
Resistance 0.9000 1.0500
BTCUSD Cautiously Bullish
Technical analysis
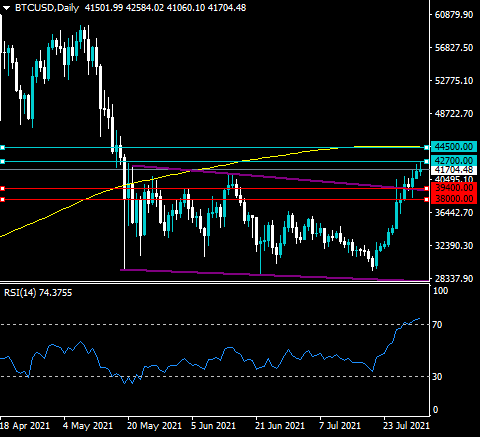
The daily time frame shows that the RSI indicator is bullish, however, the indicator is now overbought, increasing the chances of a technical pullback are increasing.
The daily time frame shows that the BTCUSD pair has now broken above a large falling price channel and could be heading into a much higher trading range.
What the possible outcomes are
In our most likely scenario, the BTCUSD pair tests towards its trend defining 200-day moving average, around the $44,500 resistance area.
Alternatively, the BTCUSD pair will pullback towards the former breakout area from the falling price channel before rallying back the 200-day moving average.
Key levels
Support $39,400 $38,000
Resistance $42,700 $44,500
EURUSD Bullish Hold
Technical analysis
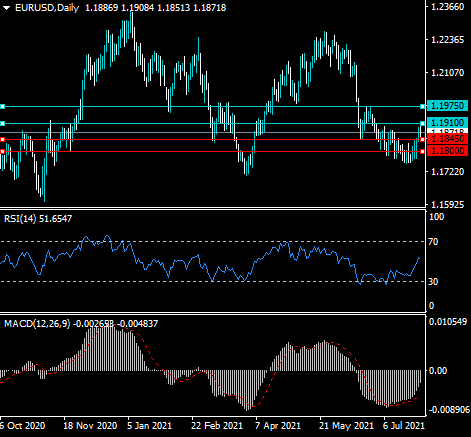
The Relative Strength Index has turned bullish on the daily time frame for the first-time since early June this year and continues to hold above 50.
The EURUSD pair still has bullish MACD price divergence extending up to 1.1975. This increases the chances of further medium-term upside for the EURUSD pair.
What the possible outcomes are
In our most likely scenario, the EURUSD pair will dip towards the 1.1845 support level and then start to recover towards the 1.1975 resistance level.
Alternatively, the EURUSD could remain range bound between the 1.1800 and 1.1900 level until a new fundamental catalyst emerges to prompt a range break.
Key levels
Support 1.1845 1.1800
Resistance 1.1910 1.1975
USDJPY Very Bearish
Technical analysis
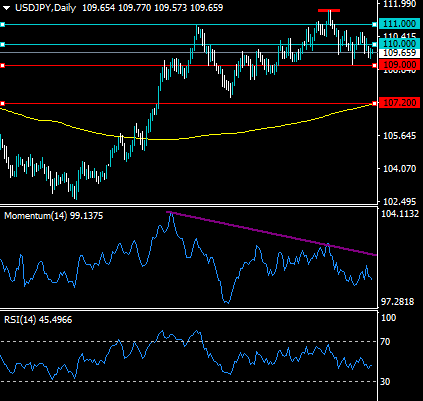
The daily time frame shows that the USDJPY pair continues to trade under the neckline of a large head and shoulders pattern and is vulnerable to heavy losses.
The RSI indicator on the daily time frame is heavily bearish and the Momentum indicator shows large amount of negative price divergence has formed, and extends down to the 107.20 level.
What the possible outcomes are
In our most likely scenario, the USDJPY pair will fall towards its 200-day moving average as the bearish head and shoulders pattern starts to play out to the downside.
Alternatively, the USDJPY pair may just range trade between the 109.00 and 110.00 levels as traders remain undecided ahead of the Non-farm Payrolls job report this Friday.
Key levels
Support 109.00 107.20
Resistance 110.00 111.00
NZDUSD Neutral Bias
Technical analysis
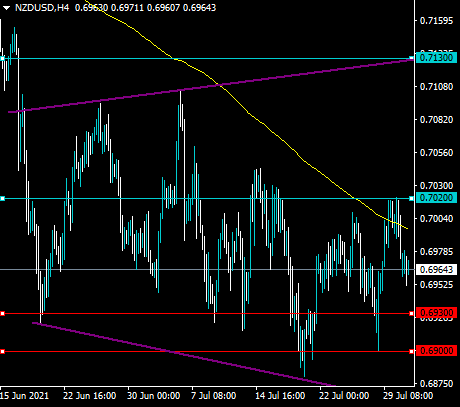
The NZDUSD pair is trading under the 0.7000 level again after being rejected from its trend defining key 200-period moving average on the four-hour time frame.
The four-hour time frame also shows that a bullish triple-bottom pattern formation will take shape if the NZDUSD pair continues to hold above the 0.6900 support level.
What the possible outcomes are
In our most likely scenario, the NZDUSD pair will pullback towards the 0.6930 level and then recover back towards the 200-period moving average on the four-hour time frame as a triple bottom starts to form.
Alternatively, the NZDUSD eventually breaks under the 0.6900 level and falls towards the bottom of a broadening wedge pattern.
Key levels
Support 0.6930 0.6900
Resistance 0.7020 0.7130
Australian Stocks Jump As Square Moves To Acquire Afterpay
Global stocks started the month on a positive note as investors focused on strong corporate results and the ongoing trend of mergers and acquisitions. According to the Wall Street Journal, deals worth more than $3.3 trillion were announced this year. This is slightly below the $3.5 trillion deals that were announced last year. The latest blockbuster deal was announced on Sunday. In a statement, Square announced that it will acquire Afterpay in an all-stock deal worth more than $29 billion. This will be the biggest takeover of an Australian company ever. Afterpay allows customers to buy products and then pay over time without interest if they make their payment on time. The buy now, pay later industry has boomed, with Klarna being valued at more than $45 billion.
The Australian dollar retreated slightly after relatively strong economic data from Australia. According to the Australian Industry Group (AIG), Australia’s manufacturing PMI declined from 63.2 in June to 60.8 in July. Similarly, data by Markit showed that the manufacturing PMI declined from 58.6 to 56.9. These numbers show that the manufacturing sector held relatively steady even as the reported new wave of coronavirus affected the country. This is because a PMI reading of 50 and above is a sign that an industry did well. The currency will next react to the latest Reserve Bank of Australia (RBA) interest rate decision.
The economic calendar will be relatively muted today. Being the first trading day of the month, the calendar will have the latest manufacturing PMIs by Markit. Economists expect that the PMI remained steady in most countries like the UK, US, and the Eurozone even as the countries went through a new wave of Delta virus. In Germany, the statistics agency will publish the latest retail sales numbers. Economists expect the data to show that retail sales declined by 2.2% in June. Meanwhile, in Switzerland, the statistics agency will publish the latest inflation and retail sales data.
EURUSD
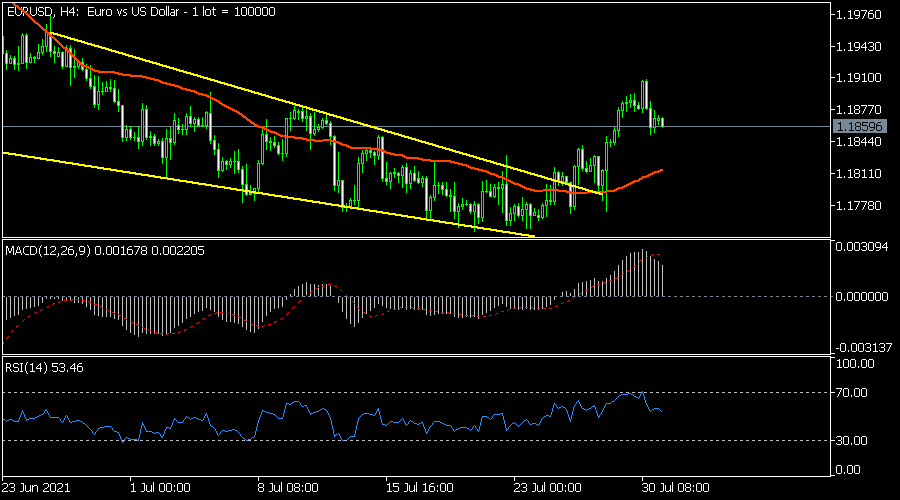
The EURUSD pair was little changed during the Asian session. It is trading at 1.1859, which is slightly below last week’s high of 1.1900. On the four-hour chart, the pair is slightly above the 25-day moving average while the RSI and MACD have started easing. The price is also slightly above the upper side of the falling wedge pattern. Therefore, the stock will likely resume the bullish momentum as traders target the key resistance at 1.1950.
USDCHF
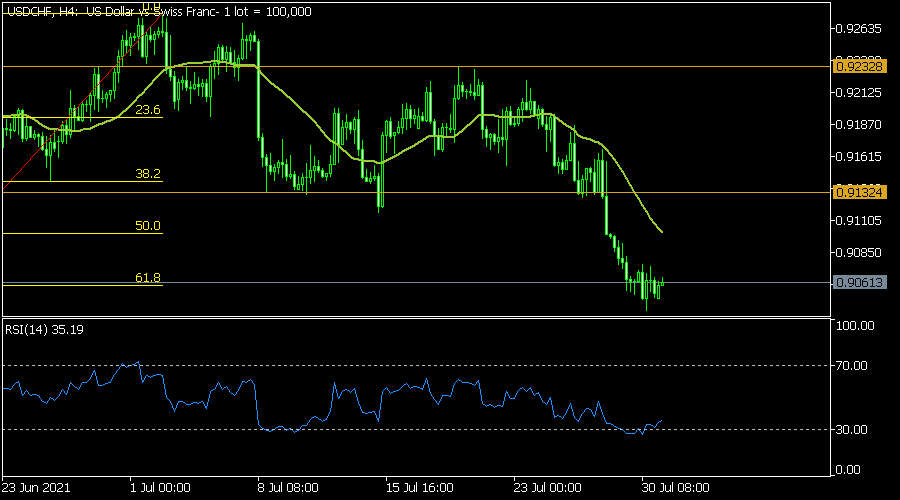
The USDCHF traded at 0.9062 during the Asian session. This price was slightly above last week’s low of 0.9040. On the four-hour chart, the price was slightly above the 61.8% Fibonacci retracement level. It has also moved below the neckline of the double-top pattern at 0.9130. It also declined below the 25-day and 50-day moving averages while the Relative Strength Index (RSI) has been in a downward trend. Therefore, the pair will likely resume the downward trend as traders target the next key support at 0.900.
SPX500
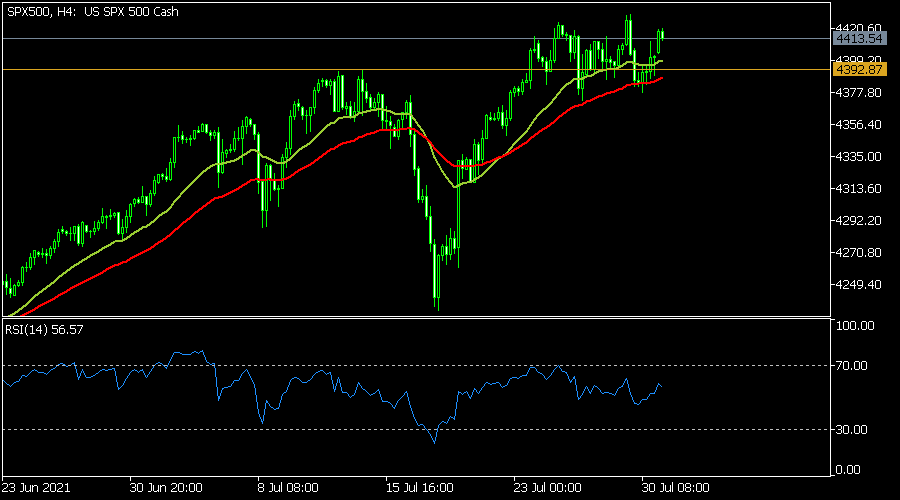
The SPX500 tilted upwards during the American session as the M&A trend kept rising. The index was trading at $4,413 during the Asian session. This price was slightly below the all-time high of $4,430. On the four-hour chart, the price is slightly above the 25-day moving average. It also seems to be forming a bullish flag pattern while the Relative Strength Index (RSI) is at 56. Therefore, the index will likely break out higher later this week.