Sample Category Title
AUD/USD Weak USD Might Boost The AUD
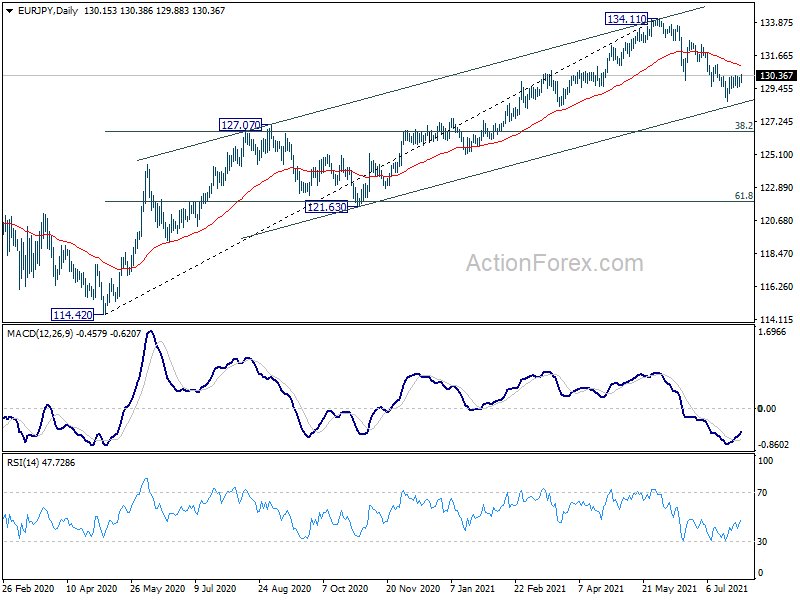
The AUD/USD is going up as the USD weakened after the FED meeting yesterday. Technically it's the zone where buyers are.
0.7344-0.7420 is the zone where we see buyers. If the price makes a continuation move towards 0.7575 we should see a stronger momentum up. For bulls, the most important is to have a close above 0.7411. That should make the new buyers join and lead the price higher towards the next level.
Gold Analysis: Reaches 1,820.00 Level
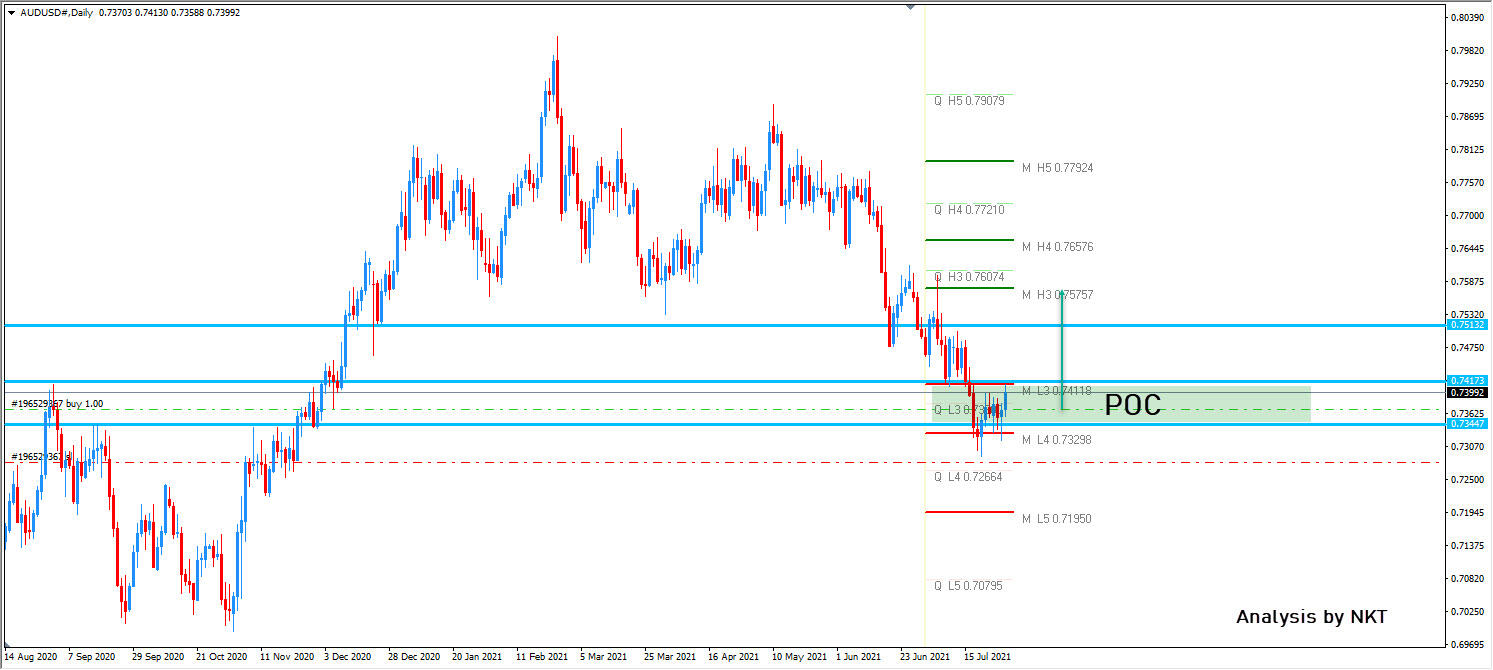
On Wednesday, the Federal Reserve's monetary statement caused a drop, which tested the support zone below the 1,795.00 mark. The support zone held and the yellow metal's price started a surge, which passed the resistance of the 55, 100 and 200-hour simple moving averages and broke the upper trend line of a channel down pattern. By the middle of Thursday's trading, the rate had reached the 1,820.00 mark.
In the case that the price continues to surge, the metal could reach the resistance zone that surrounds the 1,825.00 mark. Above it, other round price levels could provide resistance.
On the other hand, a potential decline would look for support in the 1,810.00 level before reaching the 55, 100 and 200-hour simple moving averages.
USD/JPY Analysis: Remains Below 110.00
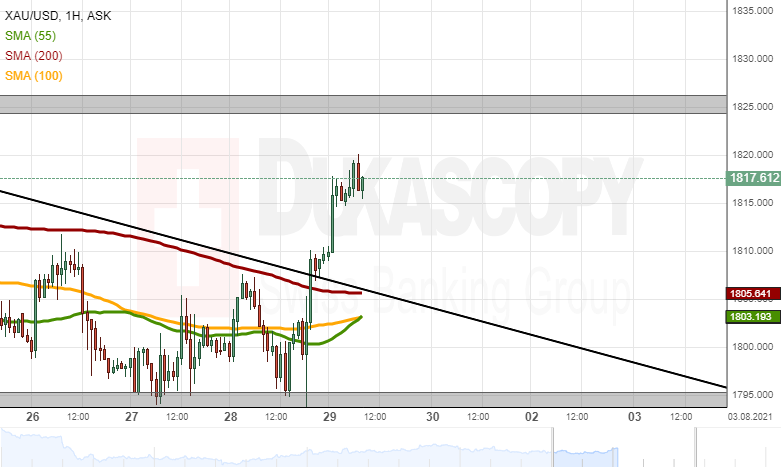
The USD/JPY managed to pass the resistance cluster that was located from 110.00 to 110.20. The rate managed to do so due to the initial surge that was caused by the US Federal Reserve on Wednesday at 18:00. However, the jump was followed by a decline. On Thursday, the rate had retreated and traded almost sideways below the 110.00 level.
In the case of a decline, the pair would look for support in the weekly S1 simple pivot point at 109.58 and the 109.60 marks, which provided support on Tuesday.
On the other hand, a surge would once again test the resistance of the 55, 100, and 200-hour simple moving averages and the weekly simple pivot point in the 109.93 to 110.14 zone.
GBP/USD Analysis: Breaches 1.3900 Mark
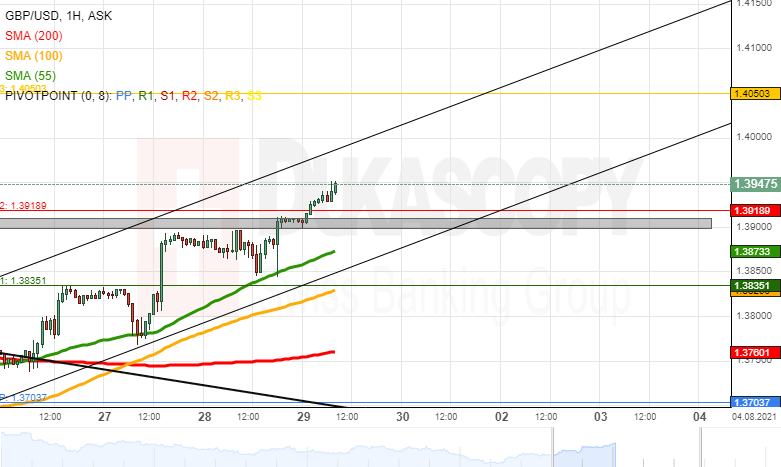
The GBP/USD currency exchange rate has passed the resistance of the 1.3900 marks and the weekly R2 simple pivot point at 1.3919. The next target for the rate appears to be the 1.4000 level.
If the rate reaches and passes the resistance of the 1.4000 marks, the pair, in theory, should reach for the combined resistance of the 1.4050 marks and the weekly R3 simple pivot point at the same exact level.
However, if the 1.4000 mark holds, as it did in late June, the pair could look for support in the 1.3900 level and trade sideways until it is approached by the 55 and 100-hour simple moving averages from below.
EUR/USD Analysis: Reaches Above 1.1850
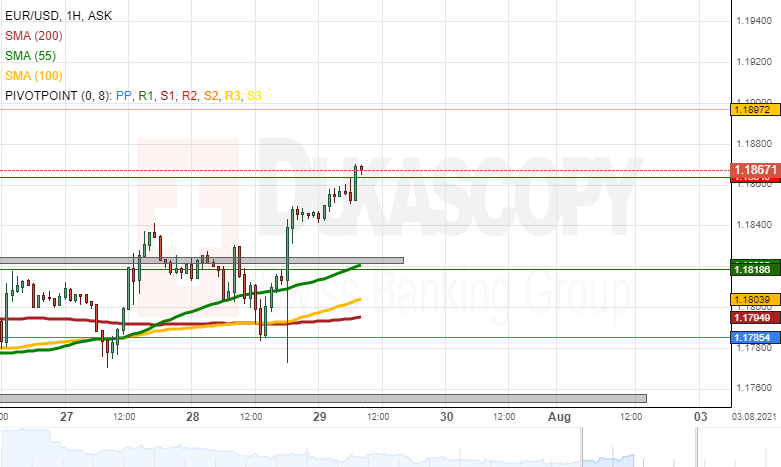
Despite an initial sharp drop that was caused by the Federal Reserve on Wednesday, on Thursday, the EUR/USD had recovered and reached above the resistance of the 1.1850 marks. In addition, the rate had passed the resistance of the weekly R2 simple pivot point at 1.1864.
In the near term future, the pair could continue to surge and reach for the resistance of the weekly R3 simple pivot point at 1.1897 and the 1.1900 marks.
On the other hand, a potential decline would look for support in the weekly R2 simple pivot point at 1.1864 and the 1.1850 marks.
NAS 100 Recoups Losses
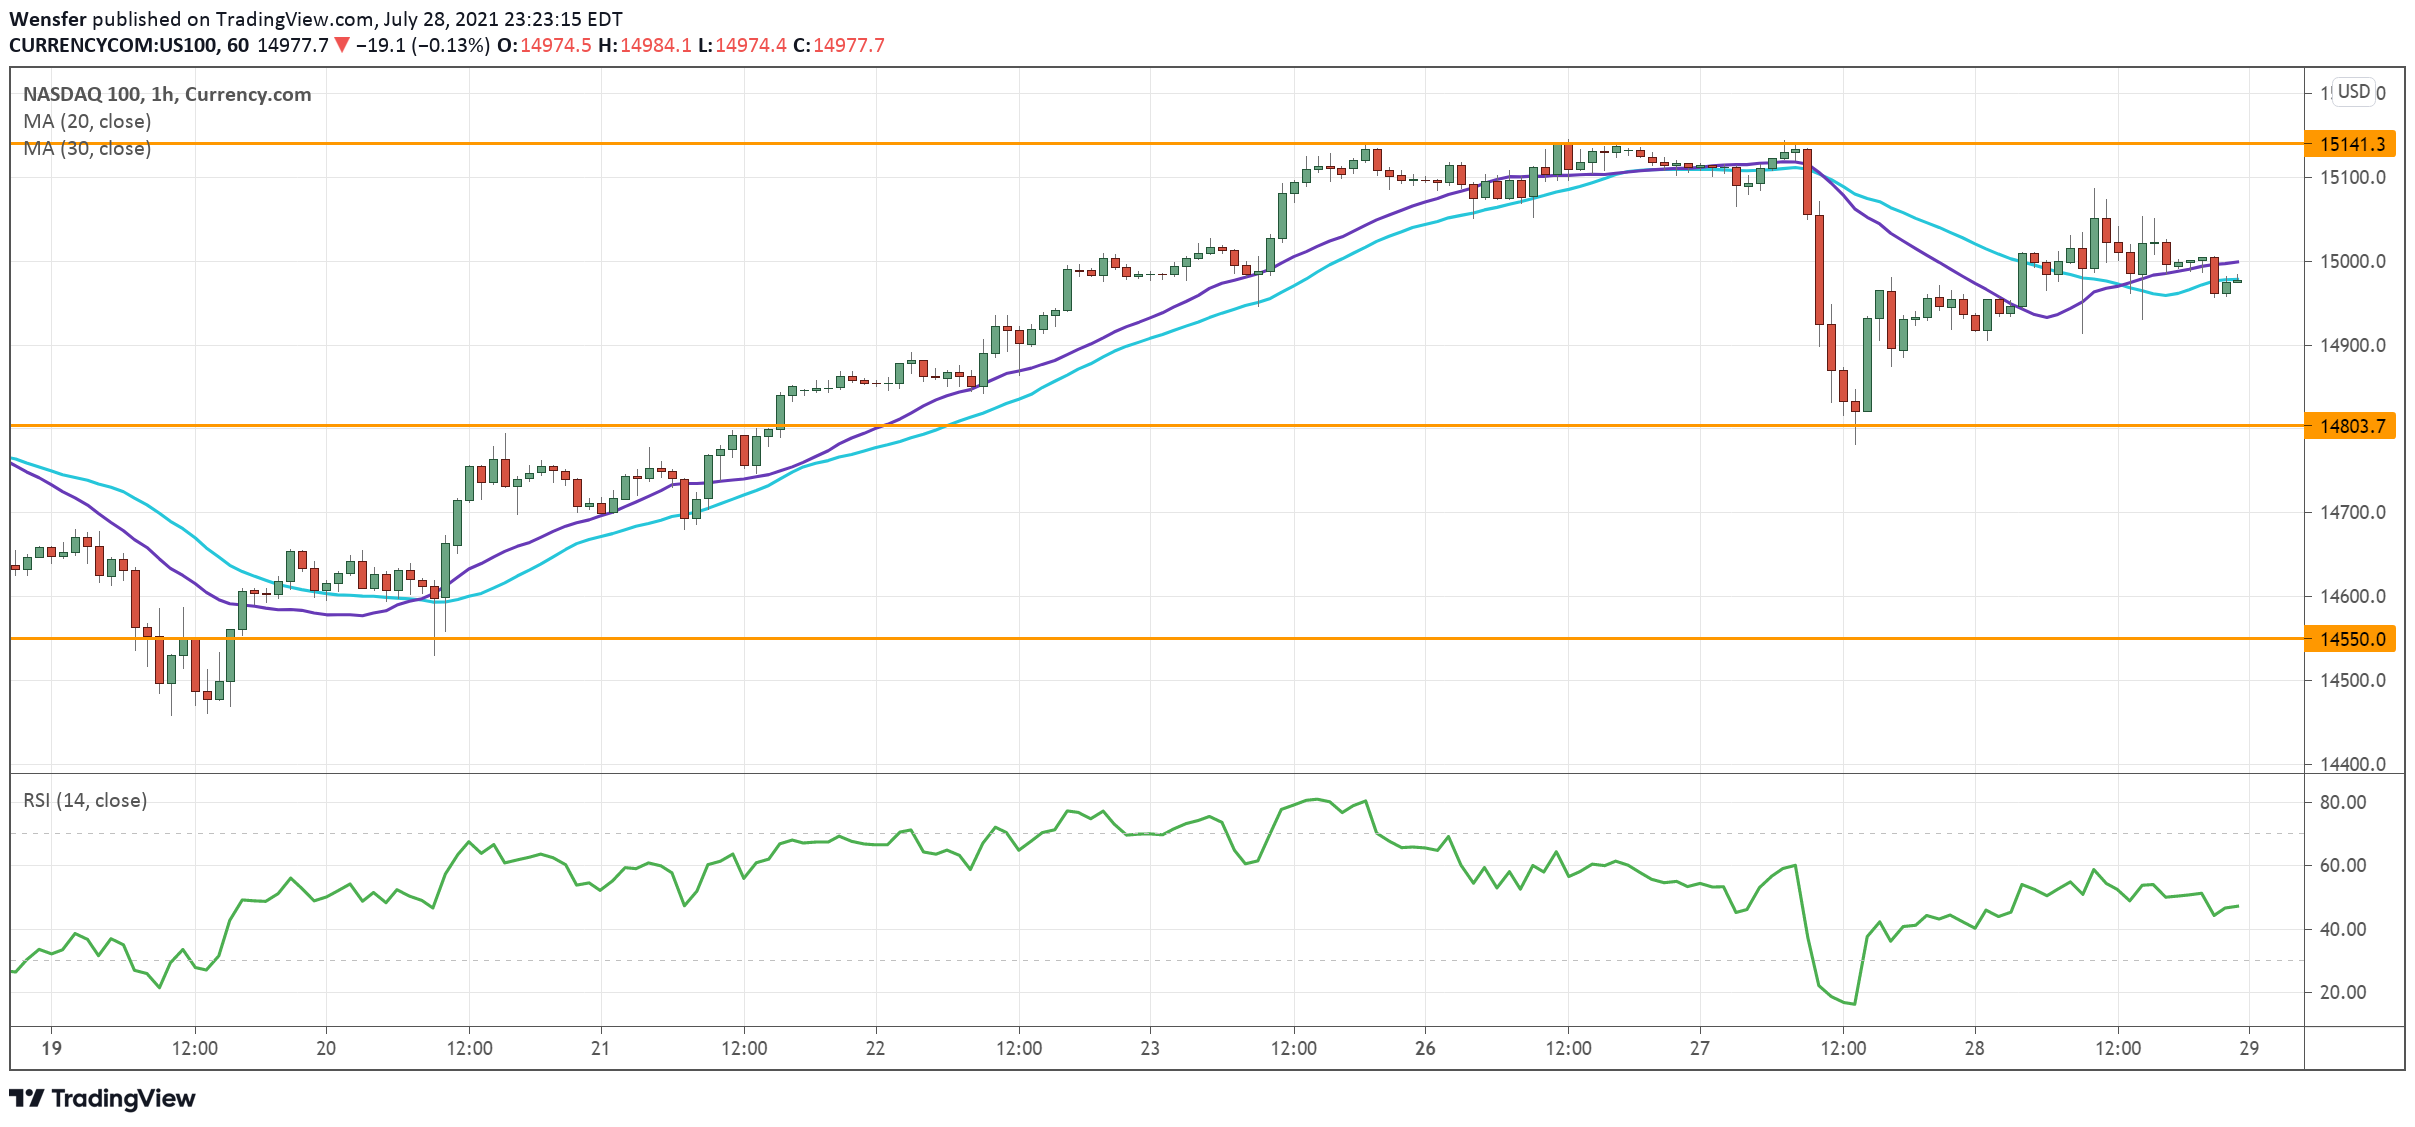
The Nasdaq 100 recovers from profit-takings as investors continue to digest Q2 earnings.
The technical pullback has found bids on the 20-day moving average (14800). Buyers were quick to see the oversold RSI as a bargain indicator.
The bullish mood remains intact as long as the price is above the previous demand zone near 14550 from the daily chart.
Consolidation may run its course for a few more hours as short-term bulls rebuild their stakes. Those armed with patience may wait for a clean break above the peak at 15140.
CAD/JPY Tests Psychological Level
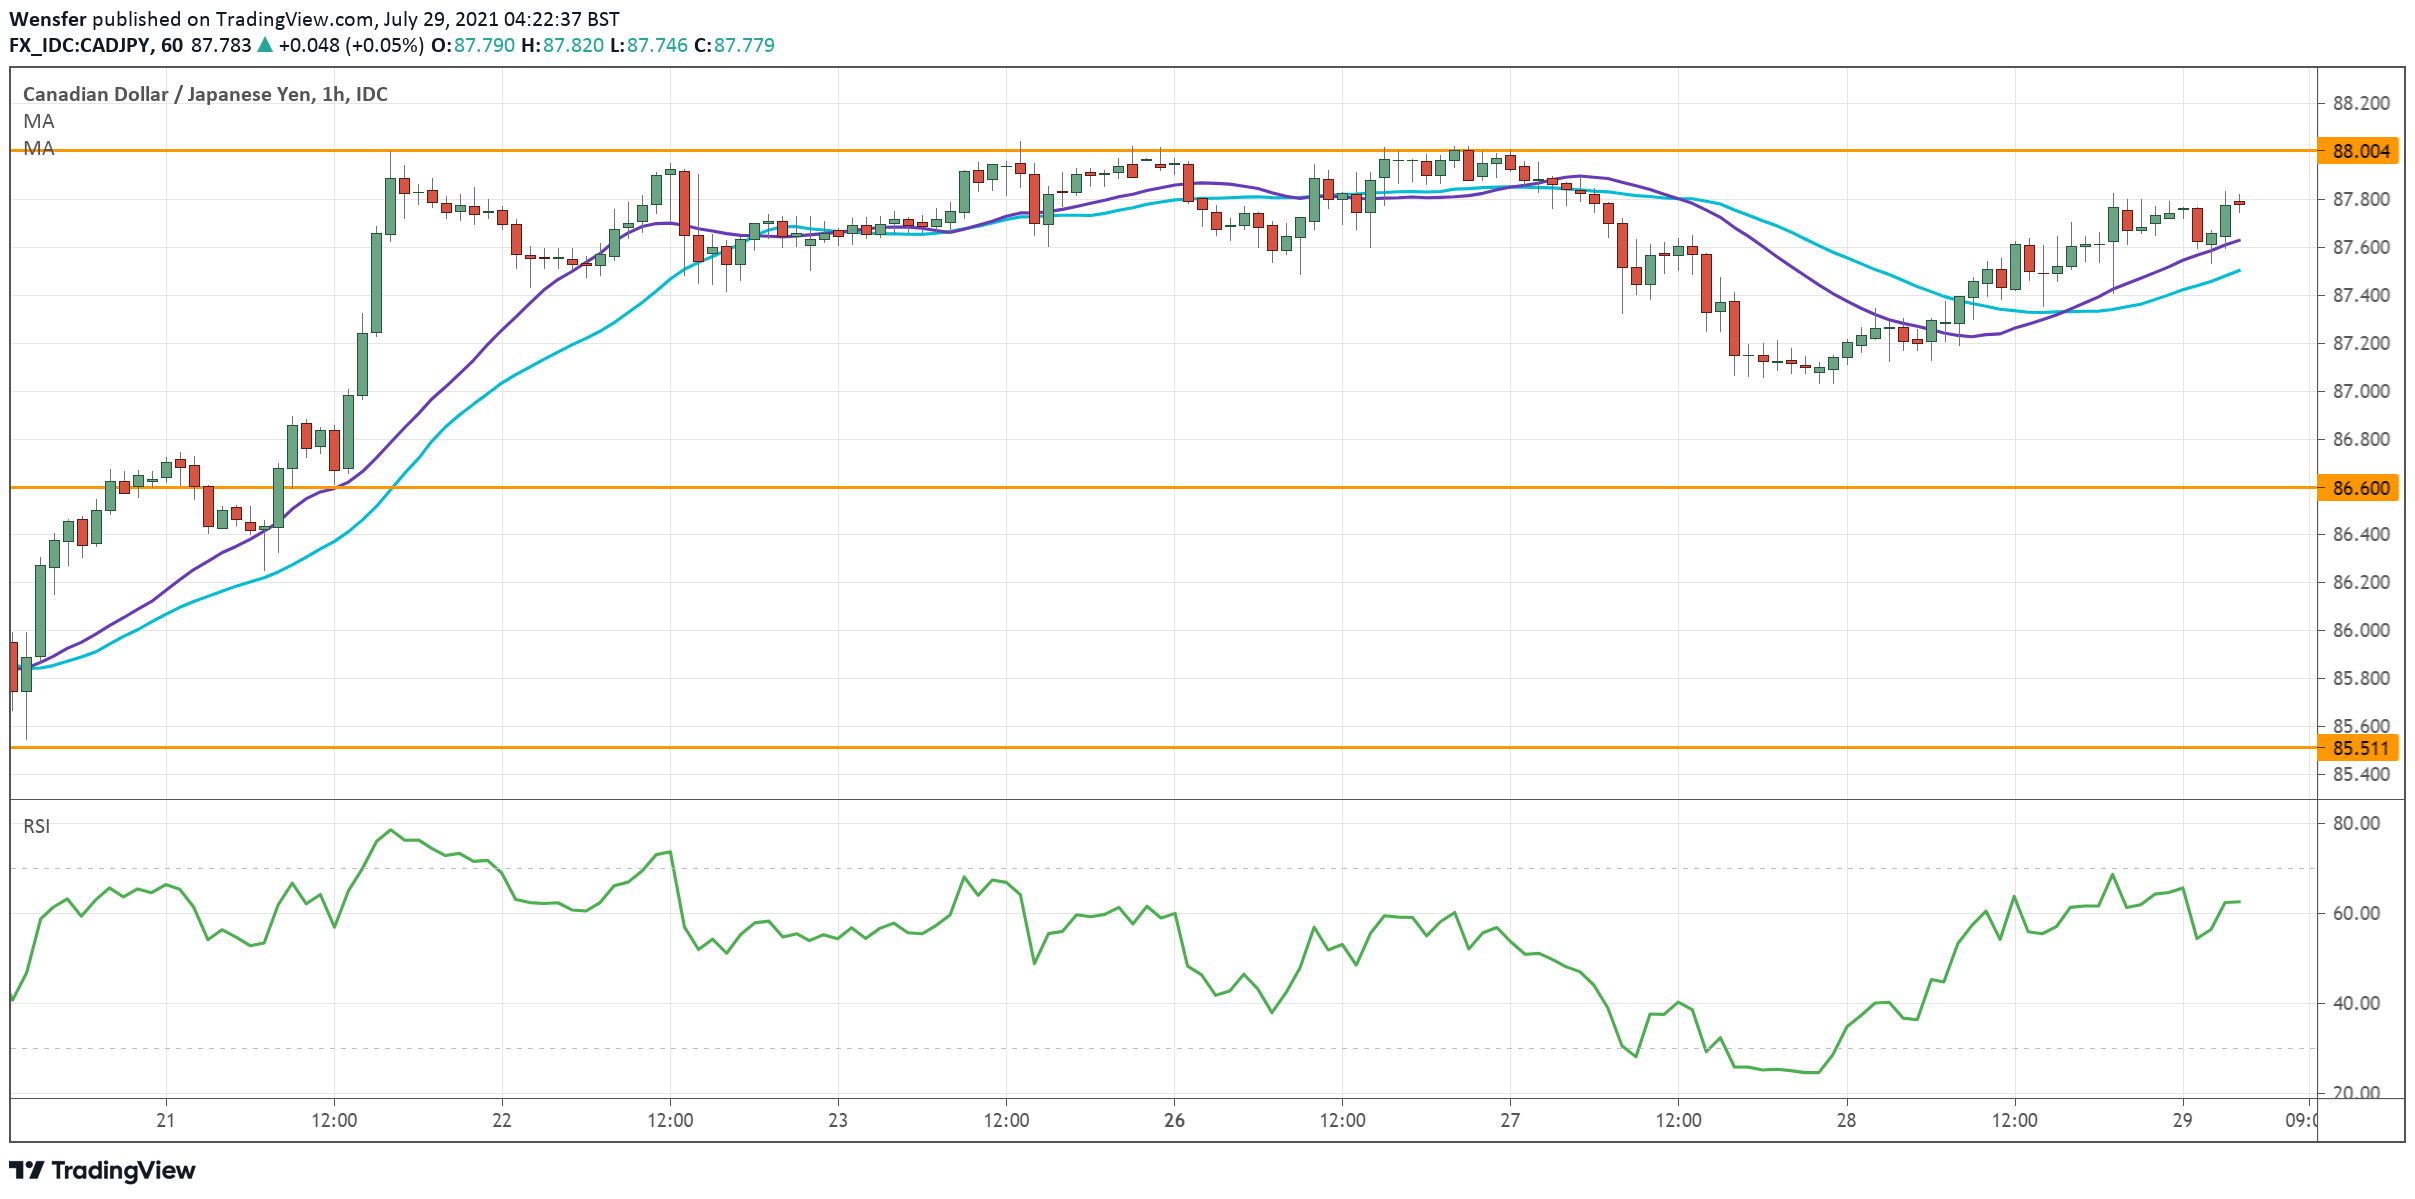
The Canadian dollar inched higher after a better-than-expected CPI in June.
The bulls are looking to extend the rebound from 85.50, a major support on the daily chart, in order to resume the fifteen-month long uptrend.
The break above the support-turned-resistance of 87.60 has put the bears under pressure. The psychological level of 88.00 has so far capped the loonie’s advance.
However, an oversold RSI may help gather more buying interest. 86.60 is the immediate support if the consolidation drags on.
EUR/USD Attempts Reversal
The US dollar tumbled after Fed Chairman Jerome Powell said it is nowhere near a rate hike.
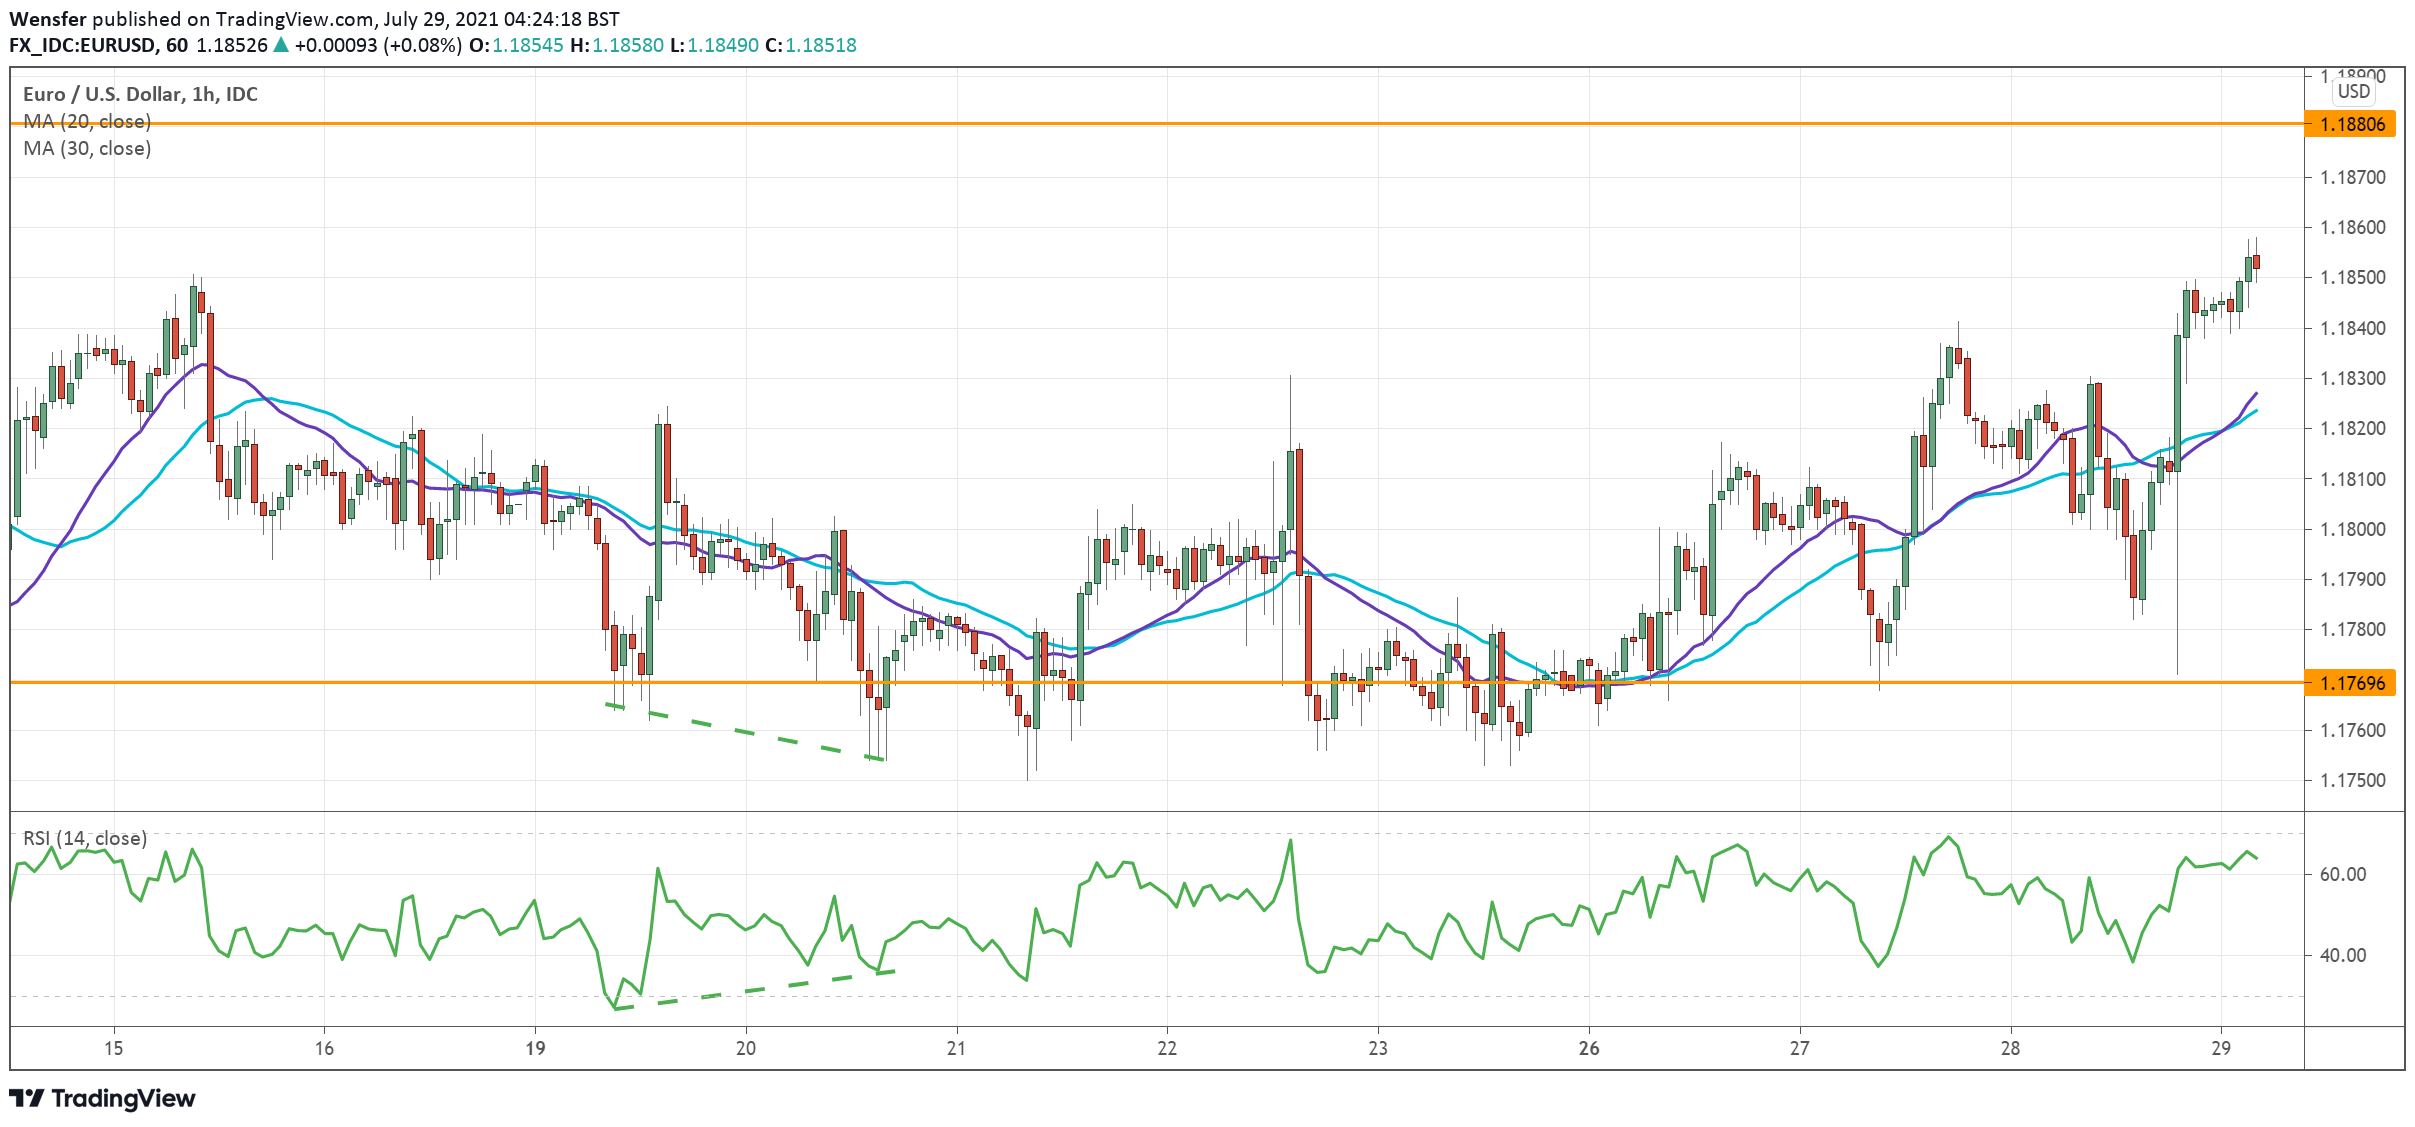
The RSI divergence was a giveaway that the sellers may have taken their feet off the pedals. The break above 1.1820 suggests that buyers were trying to get back into the game.
As the pair grinds its way up, a close above 1.1850 may foreshadow a U-turn in the coming days, prompting sellers to cover.
1.1880 could be the last hurdle and its clearance may trigger a runaway rally. 1.1770 is a fresh support in case of a pullback.
GBP/JPY Daily Outlook
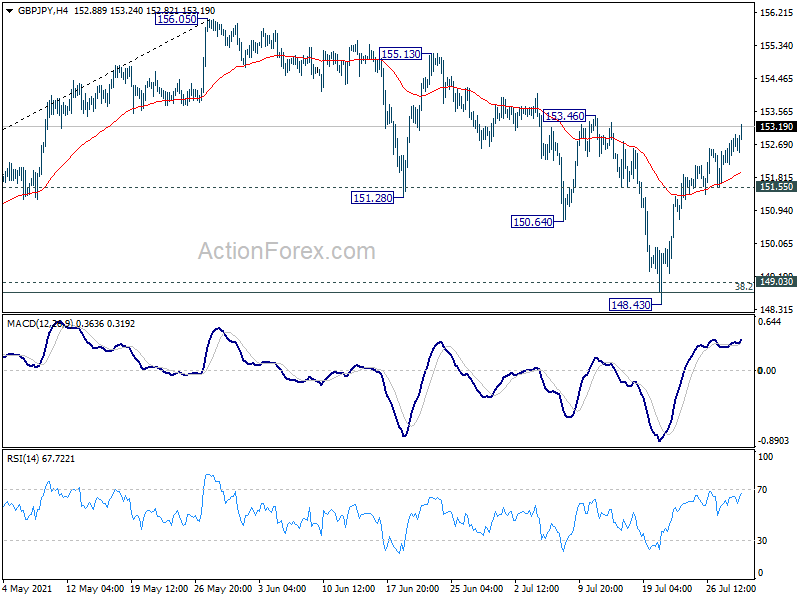
Daily Pivots: (S1) 152.35; (P) 152.67; (R1) 153.16; More...
GBP/JPY's rise from 148.43 is still in progress and intraday bias stays on the upside. Decisive break of 153.46 resistance will pave the way back to retest 156.05 high. On the downside, break of 151.55 minor support will mix up the near term outlook and turn intraday bias neutral first.
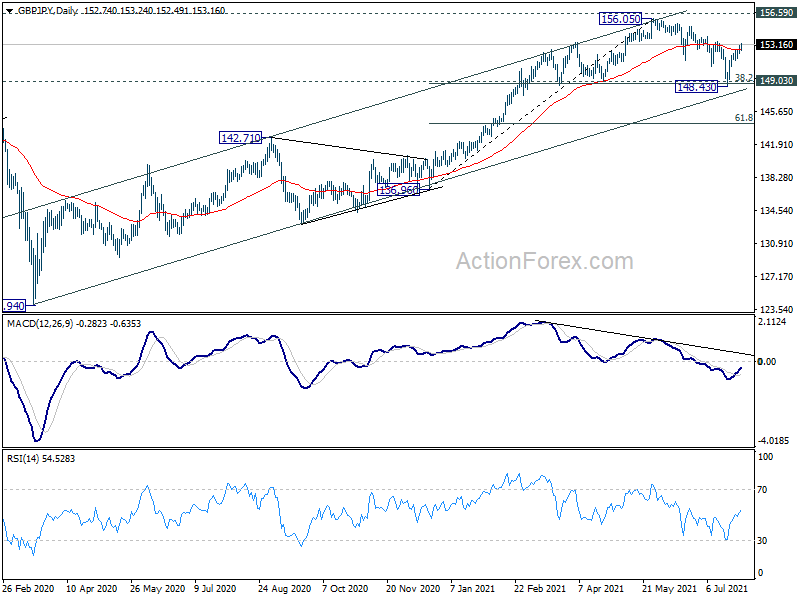
In the bigger picture, rise from 123.94 is seen as the third leg of the pattern from 122.75 (2016 low). Focus remains on 156.59 resistance (2018 high). Sustained break there should confirm long term bullish trend reversal. Next target is 61.8% retracement of 195.86 (2015 high) to 122.75 at 167.93. On the downside, sustained break of 149.03 support, however, will argue that rise from 123.94 has completed. Further break of 142.71 would open up the bearish case for retesting 122.75 low.
EUR/JPY Daily Outlook
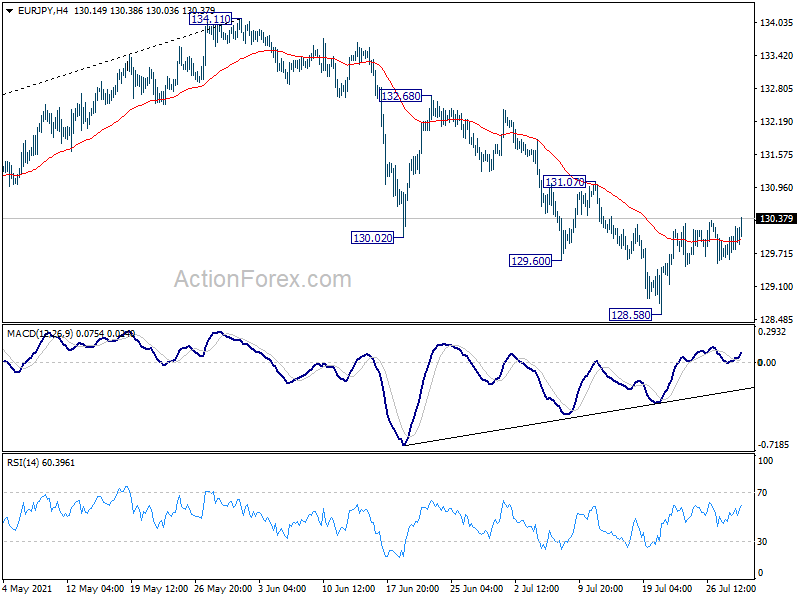
Daily Pivots: (S1) 129.79; (P) 130.02; (R1) 130.40; More....
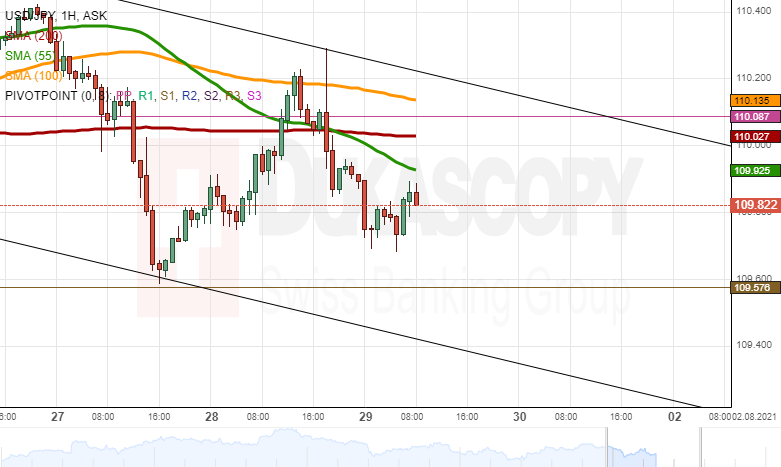
Intraday bias in EUR/JPY remains neutral for the moment. On the upside, break of 131.07 resistance will argue that choppy fall from 134.11 has completed. Intraday bias will be turned back to the upside for 132.68 resistance first. On the downside, break of 128.58 will resume the fall from 134.11, and target 127.07 resistance turned support next.
In the bigger picture, rise from 114.42 is seen as a medium term rising leg inside a long term sideway pattern. As long as 127.07 resistance turned support holds, further rise is still expected to retest 137.49 (2018 high). However, firm break of 127.07 will argue that the medium term trend has reversed, and open up the case for retesting 114.42.