Sample Category Title
EUR/GBP Daily Outlook
Daily Pivots: (S1) 0.8504; (P) 0.8514; (R1) 0.8527; More...
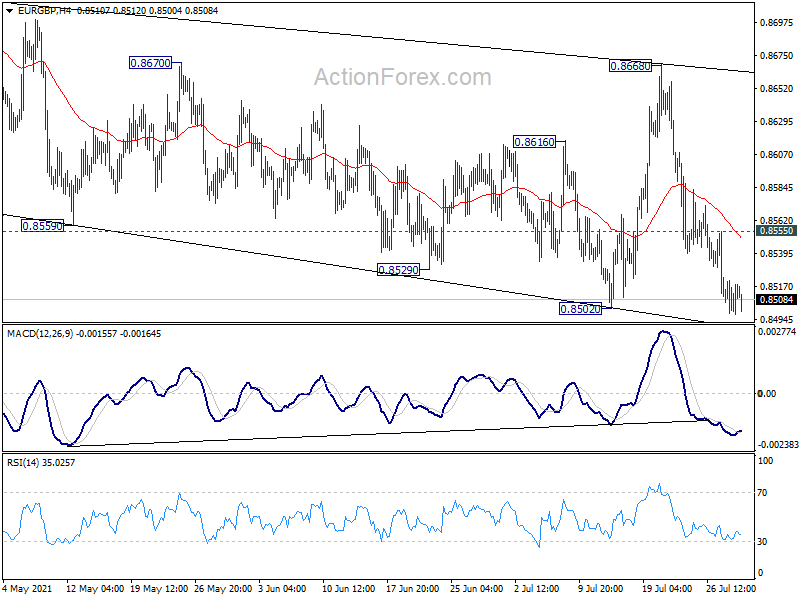
Intraday bias in EUR/GBP remains on the downside at this point. Choppy corrective fall from 0.8718 is still in progress and could target a retest on 0.8470 low. On the upside, above 0.8555 minor resistance will turn intraday bias neutral again first. But risk will stay mildly on the downside as long as 0.8668 resistance holds.
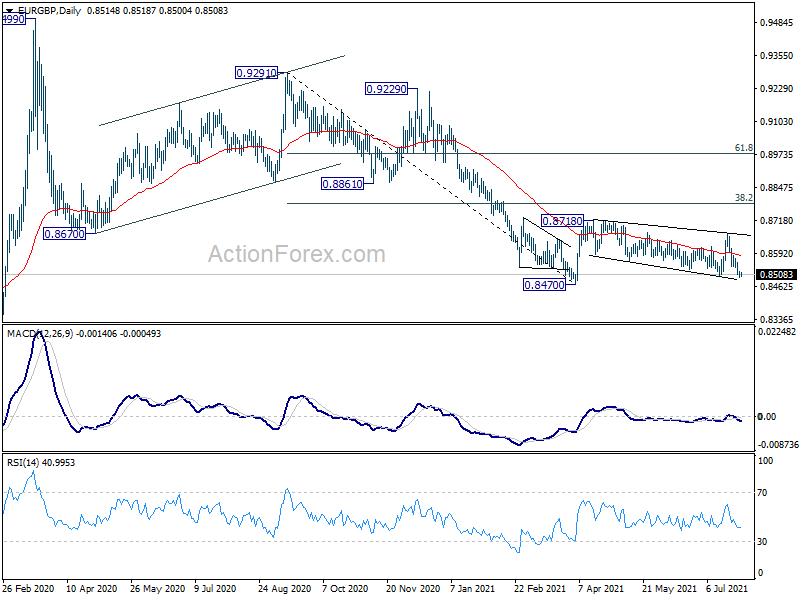
In the bigger picture, price actions from 0.9499 are still seen as developing into a corrective pattern. That is, up trend from 0.6935 (2015 low) would resume at a later stage. This will remain the favored case as long as 0.8276 support holds. However, firm break of 0.8276 support will suggest that rise from 0.6935 has completed and turn medium term outlook bearish.
EUR/AUD Daily Outlook
Daily Pivots: (S1) 1.6026; (P) 1.6063; (R1) 1.6099; More...
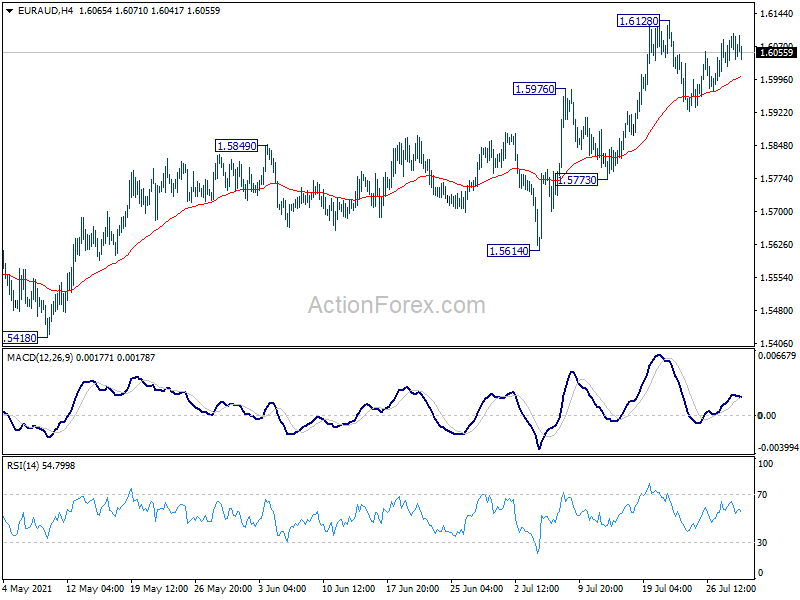
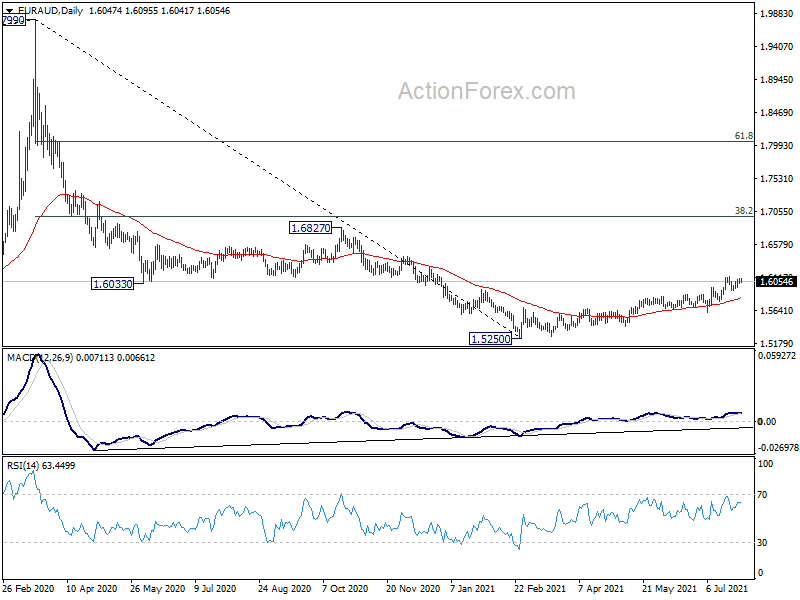
Intraday bias in EUR/AUD remains neutral for the moment as consolidation from 1.6128 is extending. Overall, near term outlook stays bullish as long as 1.5773 support holds. On the upside, break of 1.6128 will resume the rise from 1.5250, as a correction to fall from 1.9799, to 1.6827 resistance next.
In the bigger picture, current development argues that a medium term bottom is formed at 1.5250, on bullish convergence condition in daily MACD. Rise from 1.5250 is seen as a correction to the down trend from 1.9799 first. Stronger rise would be seen to 38.2% retracement of 1.9799 to 1.5250 at 1.6988 next. This will remain the favored case for now, as long as 1.5614 support holds.
EUR/CHF Daily Outlook
Daily Pivots: (S1) 1.0767; (P) 1.0792; (R1) 1.0804; More....
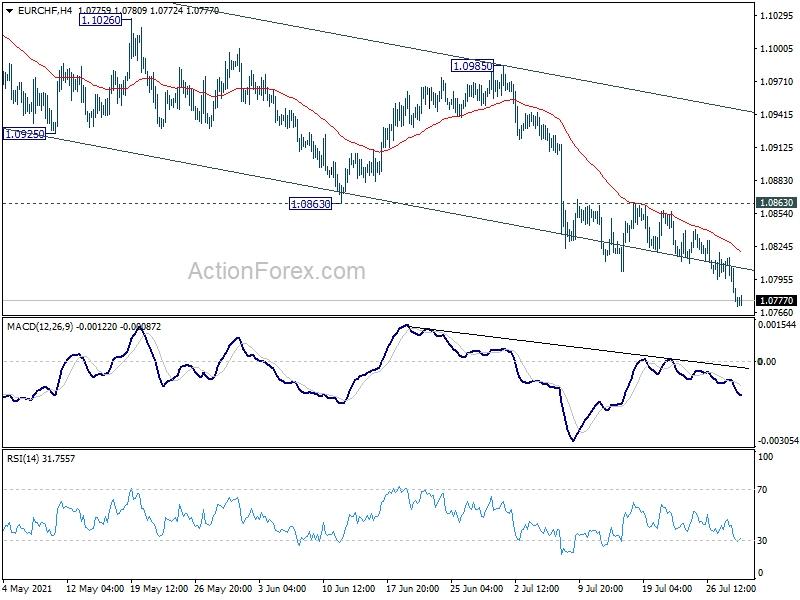
Intraday bias in EUR/CHF stays on the downside as fall from 1.1149 is in progress. Break of channel support suggest downside acceleration. Next target is 1.0737/51 cluster support. Sustained break there will pave the way back to 1.0505 low. On the upside, break of 1.0863 resistance is needed to indicate short term bottoming. Otherwise, outlook will stay bearish in case of recovery.
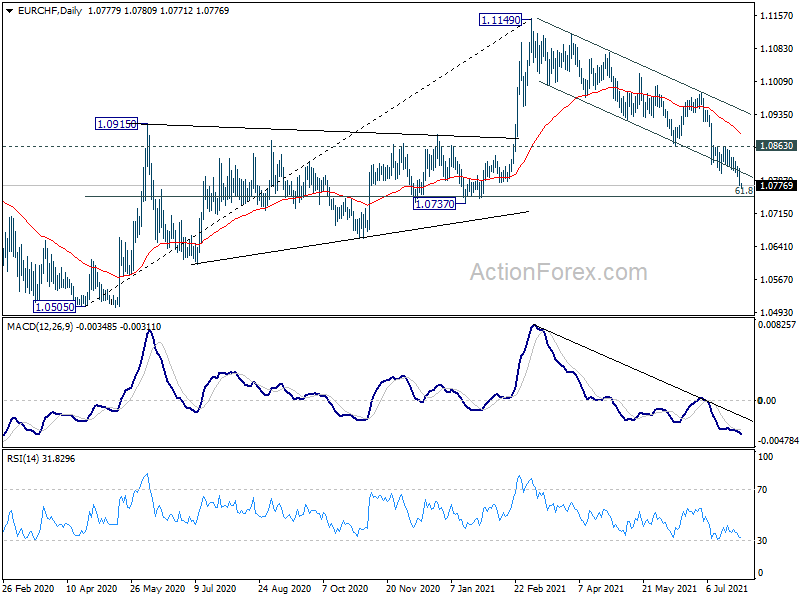
In the bigger picture, current development argues that rebound from 1.0505 (2020 low) might be completed with three waves up to 1.1149 already, after hitting 1.1078 long term fibonacci level. On the downside, sustained trading below 55 week EMA (now at 1.0880) will affirm this bearish case. Further break of 1.0737 cluster support (61.8% retracement of 1.0505 to 1.1149 at 1.0751) will bring retest of 1.0505 low.
Fed Has Cemented The Dollar’s Fall
The Fed did not give any clear signals about the start of the stimulus rollback at the end of its regular meeting, indicating only the existence of discussion about it. That's not to say that stock markets breathed a sigh of relief, as key indices only managed to recover some of the losses incurred earlier in the week. Chinese stock indices bounced back from multi-month lows, but their gains today are limited and unsustainable.
The yield curve has flattened somewhat in the debt market, indicating expectations of a more measured monetary policy normalisation. Technically, this is a breeding ground for rising equity indices and a weaker dollar, although equities are experiencing some hesitation so far, bumping close to the top.
There is more certainty in the currency market, where the dollar is under some pressure. The intraday charts clearly show a weakening reversal, with the dollar index jumping from 92.5 to 92.77 in the first minutes but then coming under sustained pressure, dropping to 92.1 by the start of European trading on Thursday.
The daily charts also show a bullish advance from the upper end of last months' trading range. While technically, the dollar's rise stalled as early as last week, it was worth waiting for the market's reaction to the Fed meeting to be more confident of the trend.
The US central bank comments and approach favour the USD sellers, forming the basis for a pullback to the lower boundary of the trading range around 89.60.
Interestingly, an important technical signal - the golden cross - did not work at all, and we saw a systematic weakening of the DXY instead of the anticipated rise.
The world's most popular currency pair, EURUSD, has another boost on the decline to the 1.16-1.17 area. The development of this movement opens the way to the highs of this year, at 1.22-1.23.
The rising trend has also established itself in GBPUSD. Earlier this month, the pair got support on a decline below 1.36, where the 200-day moving average was. Sterling is well-positioned to return to the highs above 1.42 in a matter of weeks and continue to climb higher levels while plenty of competitors are lagging. Increased traction in the Pound is provided by both the booming house prices and the rising stock markets, which directly impact speculative interest in the British currency.
The next signals from the Fed are not expected before the Jackson Hole symposium at the end of August. Until then, the weakening of the dollar could be very pronounced.
AUDJPY Still Bearish
Technical analysis
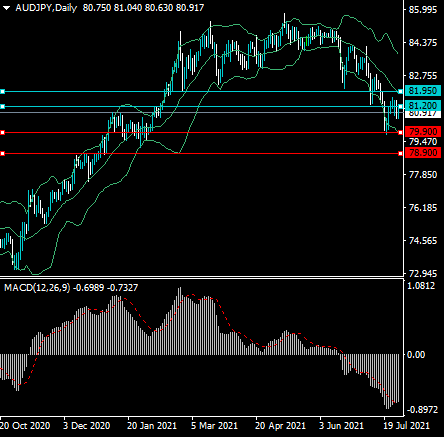
The AUDJPY pair is bearish and is close to stage a major technical breakout under its lower daily Bollinger Band. The Bollinger Bands are also slopping downwards, which is bearish.
The daily time frame shows that significant amounts of bearish MACD price divergence has formed. The MACD price divergence extends down towards the 78.90 level.
What the possible outcomes are
In our most likely scenario, the bearish price trend will remain in place and the AUDJPY pair will continue to decline back towards the 78.90 level over the medium-term time horizon.
Alternatively, the AUDJPY pair will stage another technical test back towards the mid-line of the Bollinger Band, around 81.95, and then start to sell-off again.
Key levels
Support 78.90 79.90
Resistance 81.20 81.95
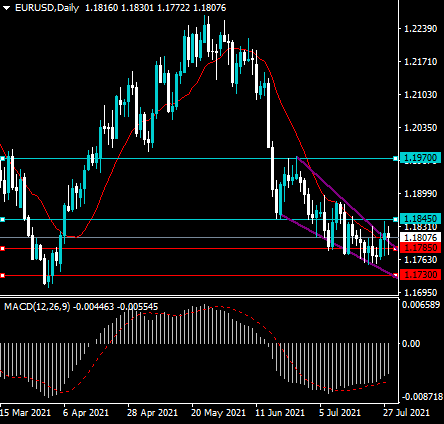
EURUSD Bullish Bias
Technical analysis
The EURUSD has broken above a large falling wegde pattern on the daily time frame, and has stopped making new lower daily lows.
According to the daily time frame the EURUSD pair has significant amounts of bullish MACD price divergence extending up to 1.1975. This increases the chances of a price rebound.
What the possible outcomes are
In our most likely scenario, the EURUSD pair will eventually rise back towards the 1.1970 level in order for bullish MACD price divergence to be reversed.
Alternatively, the EURUSD could test the top the falling wedge pattern, around the 1.1785 level, one final time before rising.
Key levels
Support 1.1785 1.1720
Resistance 1.1845 1.1970
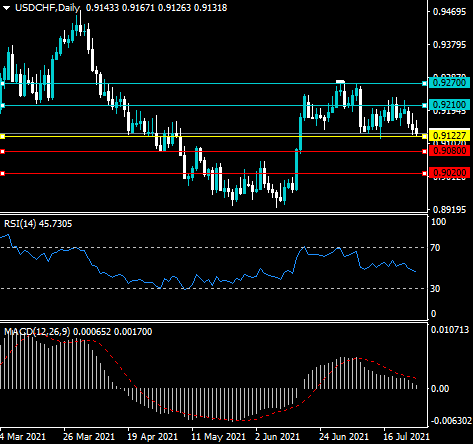
USDCHF Bearish Bias
Technical analysis
The daily time frame shows that the USDCHF pair is close to the neckline of a bearish head and shoulders pattern with 120 points of downside potential.
Bearish MACD and RSI price divergence is also warning that the USDCHF pair could stage a significant decline at any time.
What the possible outcomes are
In our most likely scenario, the USDCHF pair will starts to decline back towards the 0.9020 level as the mentioned head and shoulders pattern and divergence unfold to the downside.
Alternatively, the USDCHF pair could test back towards the 0.9210 level and then start to decline back towards the 0.9020 level.
Key levels
Support 0.9100 0.9020
Resistance 0.9210 0.9210
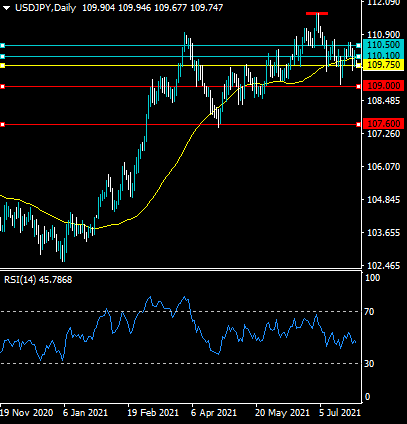
USDJPY Turning Bearish
Technical analysis
The daily time frame shows that the USDJPY pair is testing under the neckline of a large bearish head and shoulders pattern with nearly 200 points of downside potential.
The MACD indicator on the daily time frame is bearish, while the RSI indicator on the mentioned time frame also remains below 50.
What the possible outcomes are
In our most likely scenario, the USDJPY pair will starts to decline back towards the 107.60 level as the mentioned head and shoulders pattern starts to unfold to the downside.
Alternatively, the USDJPY pair will simply continue to remain range bound and trade in a price range between the 109.00 and 110.00 levels.
Key levels
Support 109.00 107.60
Resistance 110.10 110.50
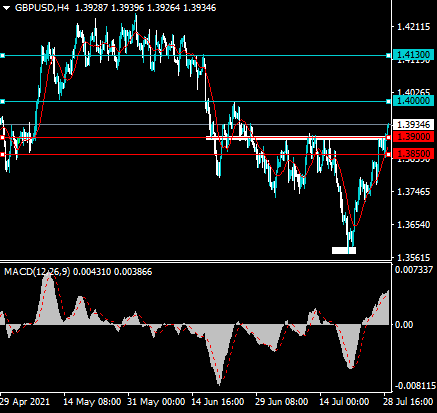
GBPUSD Still Bullish
Technical analysis
The GBPUSD pair looks to be forming a large inverted head and shoulders pattern, with the pattern being confirmed if the price reaches the 1.4000 resistance level.
The four-hour time frame shows that significant amounts of bullish MACD price divergence is being reversed. The MACD price divergence extends all the way up towards the 1.4000 level.
What the possible outcomes are
In our most likely scenario, the GBPUSD pair advances towards the 1.4000 resistance and forms a large inverted head and shoulders pattern with significant upside potential.
Alternatively, the GBPUSD pair will rally all the way through to the 1.4130 resistance level as buying momentum continues to take hold and the 1.4000 resistance level fails to contain the advance.
Key levels
Support 1.3900 1.3860
Resistance 1.4000 1.4130
AUDUSD Snaps Key Barrier, But Stronger Efforts Needed
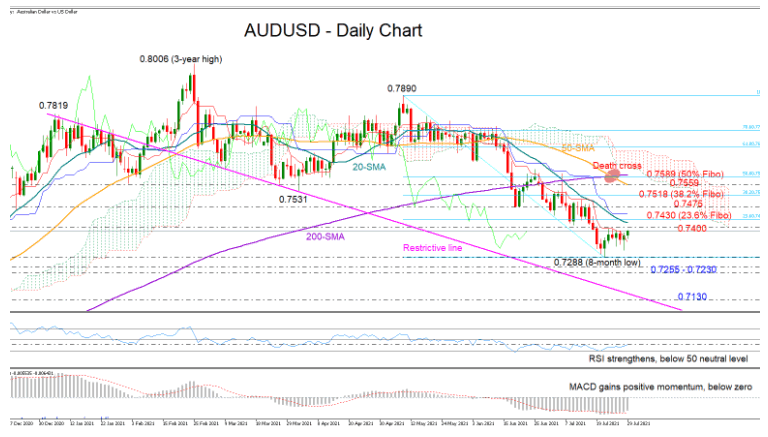
AUDUSD opened above the red Tenkan-sen line on Thursday, with scope to finally snap the Ichimoku line, which held the bulls under control since mid-June, and re-challenge the nearby 0.7400 resistance territory.
The positive momentum in the RSI is currently endorsing the bullish action above the eight-month low of 0.7288, though some caution is still required as the indicator has yet to create a new higher high, maintaining a sideways trajectory below its 50 neutral level. The upside reversal in the MACD is also encouraging, but a break into the positive zone would generate stronger bullish signals.
In other cautious warnings, the 50- and 200-day simple moving averages (SMAs) have completed a death cross for the first time since 2018, flagging a definitive negative trend reversal.
In the short term, the price may attempt to close above the 0.7400 – 0.7430 area, which encapsulates the 20-day SMA and the 23.6% Fibonacci retracement of the 0.7890 – 0.7288 downleg. If efforts prove successful, the bulls could accelerate towards the 38.2% Fibonacci of 0.7518 unless the 0.7475 barrier capes the rally. Steeper increases could meet the 50-day SMA at 0.7559, while a decisive step above the 50% Fibonacci of 0.7589 and the 200-day SMA could be a bigger achievement.
Should selling pressures resurface, the spotlight will turn back to the 0.7288 low, a break of which could find immediate support within the 0.7255 – 0.7230 region, last seen in November. If the latter fails to act, the pair could stretch its downtrend towards the restrictive line from January around 0.7130.
In brief, buying pressures could persist in AUDUSD, though only a close above 0.7030 would confirm a bullish bias. In terms of the market's prevailing trend, the downward direction may stay intact for now.