Sample Category Title
EUR/CAD 4H Chart: Bulls Likely To Prevail
The EUR/CAD currency pair bounced off a support level at 1.4615 on July 2. As a result, the European single currency surged by 2.11% against the Canadian Dollar during this period.
Everything being equal, the exchange rate could continue to surge during the following trading sessions. The potential target for buyers will be near the 1.5100 level.
However, the currency exchange rate could encounter resistance at 1.4900 during this week's trading sessions.
EUR/AUD 4H Chart: Could Continue To Edge Higher
The common European currency has surged by 2.05% against the Australian Dollar since July 8. The currency pair tested the upper boundary of an ascending channel pattern at 1.5950 during last week's trading sessions.
All things being equal, the exchange rate could continue to edge higher during the following trading sessions. A breakout through the upper line of the channel pattern could occur.
However, if the ascending channel holds, the EUR/AUD currency exchange rate will make a pullback towards the 1.5700 level within this week's trading sessions.
Crude Oil Is Steady Early In The Week
Early in another week of July, the oil market is looking neutral: market concerns about lack of decisions from OPEC+ sputtered out, while weekly reports on the Natural Gas Storage and Crude Oil Inventories are already included in prices. As a result, Brent is trading at $75.40.
The cartel and its allies will have to come to an agreement anyway: the global economic recovery will require more energies, and if OPEC+ wants to preserve market stability, as well as the balance between supply and demand, it will have to find a compromise. It doesn’t mean that the direct confrontation between the cartel and UAE disappeared but the parties are highly likely to come to a compromiseб at least for a while.
Given the current recovery rates, the global supply shortage is estimated at 3 million barrels per day. OPEC+ has good chances to eliminate this gap.
The USA is still influenced by a seasonal factor, which affects weekly reports on the Crude Oil Inventories and they show slight declines. It allows bulls to remains quite active.
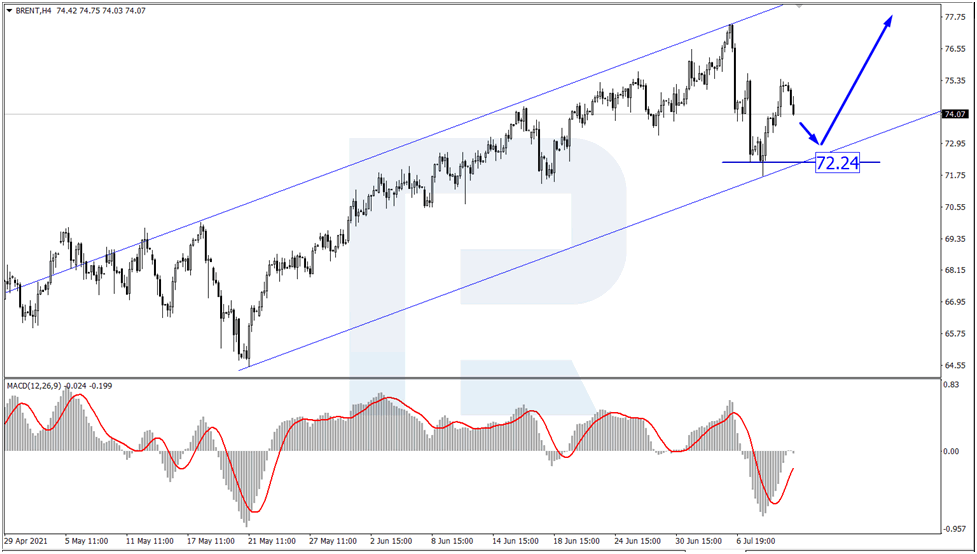
In the H4 chart, after updating the highs, Brent is still forming the correctional wave. Today, the asset may reach 72.24. After completing the correction, the instrument may resume trading within the uptrend with the target at 78.00. From the technical point of view, this scenario is confirmed by MACD Oscillator: its signal line is still moving below, thus indicating the correctional wave.
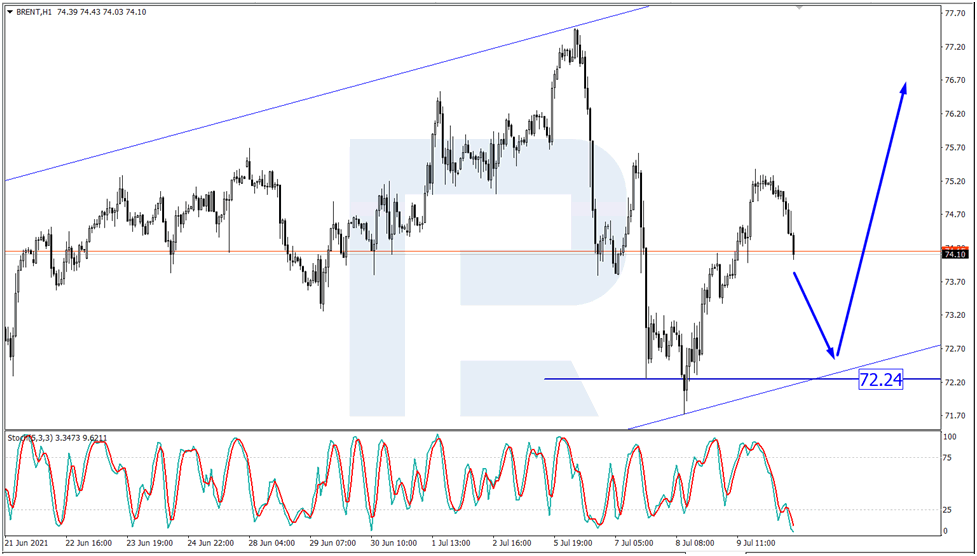
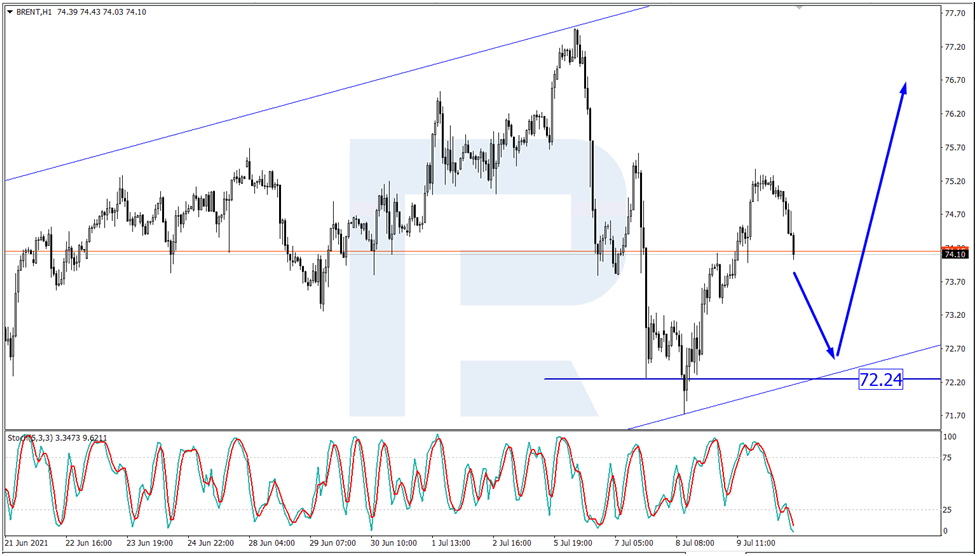
 As we can see in the H1 chart, the situation is pretty similar. Brent continues correcting downwards and may soon reach 72.24. From the technical point of view, this idea is confirmed by the Stochastic Oscillator: its signal line is moving below 25, thus indicating that the correction continues.
EUR/USD Faces No Resistance
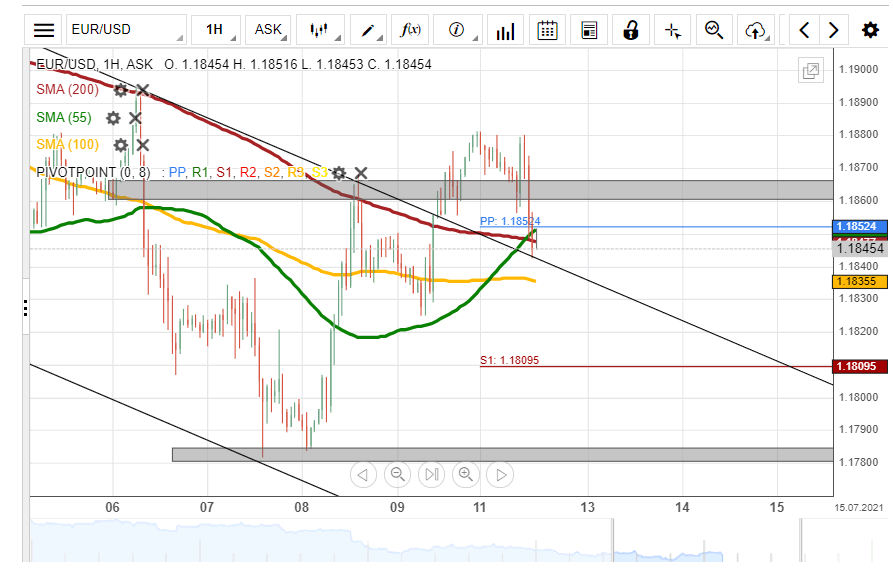
At mid-day on Friday, the EUR/USD passed the resistance zone above the 1.1860 level and the 200-hour simple moving average. By doing so the rate passed the last technical resistance up to the 1.1923 level where the weekly R1 simple pivot point is located at.
In theory, the currency exchange rate should surge up to the weekly R1 simple pivot point at 1.1923. However, note that the rate could find resistance in the round level of 1.1900.
On the other hand, a potential decline would find support in the weekly simple pivot point at 1.1852 and the 55 and 200-hour simple moving averages near the 1.1850 mark.
GBP/USD Finds Resistance Near 1.3900
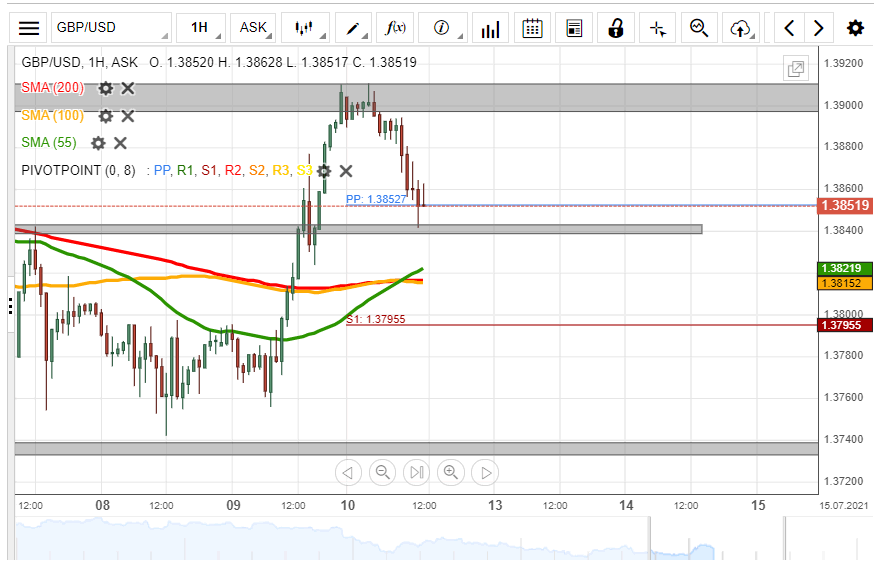
During the early hours of this week's trading, the GBP/USD currency exchange rate bounced off the resistance of a zone that surround the 1.3900 level. By the middle of Monday's trading, the rate was expected to look for support near the 1.3850 level.
Near the 1.3850 level, the rate could find support in the weekly simple pivot point at 1.3853 and the last week's significant zone near 1.3840. If these levels would be passed, the pair could reach the combined support of the 55, 100 and 200-hour simple moving averages near 1.3820.
Meanwhile, a potential surge would once again test the resistance of the zone near 1.3900 before reaching the weekly R1 simple pivot point at 1.3963.
USD/JPY Trades Above 110.00
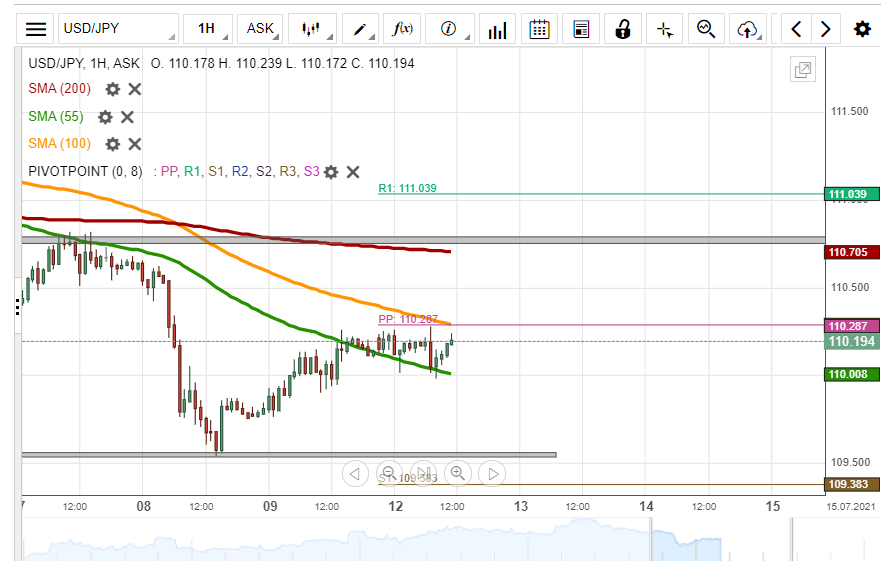
On Monday, the USD/JPY recovery reached above the 110.00 mark. However, the rate encountered resistance at 110.29 where the weekly simple pivot point and the 100-hour simple moving average were located at.
In the case that the rate surges above the technical resistance levels near 110.30 , the pair could reach for the 200-hour simple moving average and the July 7 high level.
On the other hand, a potential decline would look for support in the 110.00 level and the 55-hour simple moving average. In the case that the rate passes below the 110.00 mark, it could reach for the 109.55 level.
GOLD Breaks Pattern
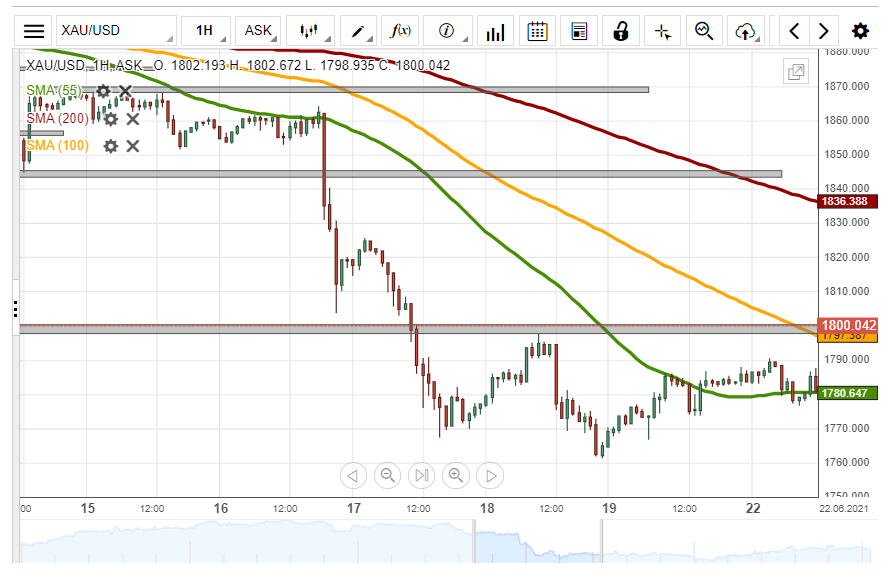
On Monday morning, the yellow metal passed the support of the channel up pattern, which had guided the rate since June 29. Moreover, the 55 and 100-hour simple moving averages failed to provide the rate with support. However, the price found support in the 1,800.00 level.
In the near term future, the price could recover due to the support of the 1,800.00 mark. A potential surge of the bullion would most likely encounter resistance in the last week's high level just below the 1,820.00 mark.
Meanwhile, a decline below the 1,800.00 mark could look for support in the zone near the 1,790.00 level and the 200-hour simple moving average.
ECB de Guindos: We will discuss new forward guidance next week
ECB Vice President Luis de Guindos said in an event today, "next week we will discuss new forward guidance that includes new definition of price stability."
"The formulation of the forward guidance has to be modified to include the new definition of price stability", he added.
The comment was inline with Preisdent Christine Lagarde that there will be "some interesting variations and changes" in the upcoming July 22 meeting.
USD Weakens From The Improved Market Sentiment
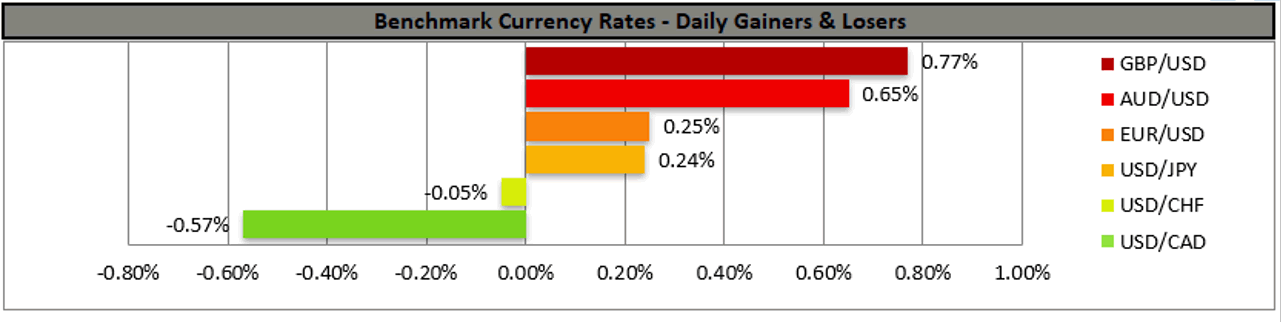
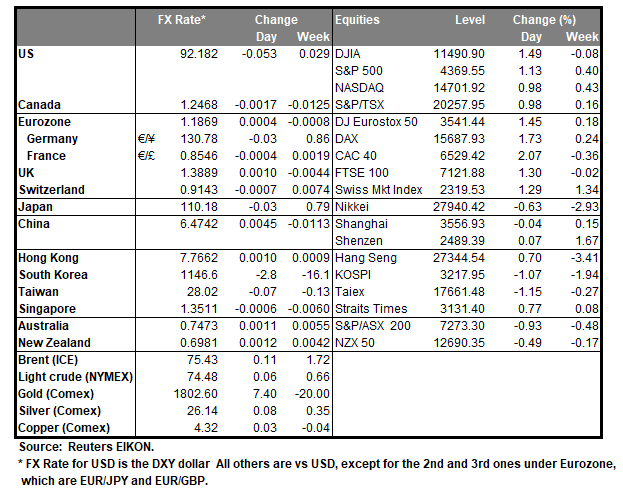
USD weakened on Friday against a number of its counterparts as worries tended to subside and the market’s focus turns towards the US CPI rates on Tuesday to see whether the inflationary pressures in the US economy are to be confirmed. US stockmarkets tended to benefit from the risk on appetite of the markets with Nasdaq and S&P 500 closing at record highs, while Dow Jones was at similar territories. Gold prices tended to benefit from a weaker greenback on Friday for an eighth day in a row, yet today during the Asian session gold prices tended to ease somewhat with investors focusing on the US inflation rates and Fed Chairman Powell's testimony this week. The Loonie gained against the greenback on Friday, as Canada’s employment data for June provided support given that the employment change figure outperformed market expectations and the unemployment rate dropped, implying a tightening of the Canadian employment market. The pound gained and investors seemed quite optimistic, given that the UK government reaffirmed this week plans to end social and economic COVID-19 restrictions in England on July 19, yet at the same time warned that the number of coronavirus cases could climb. Oil prices rose on Friday yet rising number of COVID-19 cases and unequal access to vaccines threaten the global economic recovery.
EUR/USD benefitted from USD’s weakening on Friday yet seems to have reached a ceiling at the 1.1885 (R1) resistance line. We tend to maintain a bias for a sideways motion between the 1.1885 (R1) and the 1.1785 (S1) support level. Also please note that the RSI indicator below our 4-hour chart is just above the reading of 50, which may imply a slight advantage of the bulls. Should the bulls actually take over we may see the pair breaking the 1.1885 (R1) resistance line which was tested on Friday and aim for the 1.1995 (R2) level. Should the bears prevail, we may see EUR/USD breaking the 1.1785 (S1) support line and start aiming for lower grounds, which could signal a return to low levels not seen for the pair since the early days of April.
On the other hand, the Japanese currency also tended to experience safe haven outflows as it weakened even more than the USD breaking the 109.90 (S1) resistance line, now turned to support. As the pair seems to have broken the downward trendline guiding it since the 2nd of July, we switch our bearish outlook in favour of a sideways motion bias initially. Should buyers be in control of the pair’s direction, we may see it breaking the 110.90 (R1) resistance line and aim for higher grounds. Should the market display a selling interest for the pair, we may see it breaking the 109.90 (S1) support line and aim for the 109.25 (S2) level.
Other economic highlights today and the following Asian session:
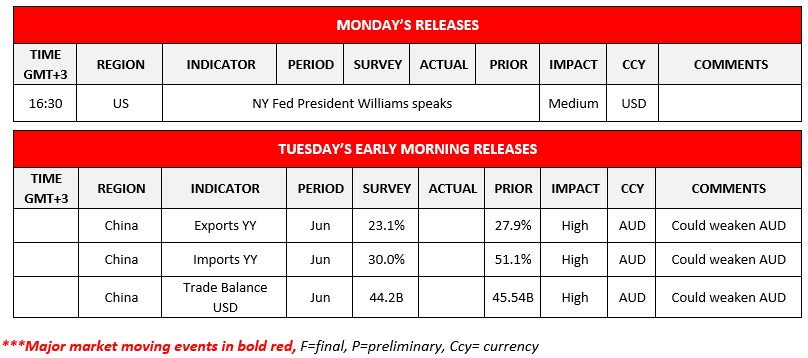
Today we have a rather empty calendar yet we highlight for Aussie traders the release of China’s trade data for June, as Australian exporters of raw material are expected to keep a close eye on the import growth rate.
As for the rest of the week
On Tuesday, we note Germany’s and France’s final HICP rate for June and the US CPI rates for June. On Wednesday, we get New Zealand’s RBNZ interest rate decision, UK’s and Sweden’s CPI rates for June, Eurozone’s industrial production for May, Turkey’s CBRT interest rate decision and from Canada BoC’s interest rate decision. On Thursday, we get Australia’s employment data for June, China’s industrial output and for June and GDP growth rate for Q2, UK’s employment data for May, the US New York Fed manufacturing for July, the weekly initial jobless claims figure, the Philly Fed business index for July and the US industrial production for June. On Friday, we highlight New Zealand’s CPI rates for Q2, Japan’s BoJ interest rate decision, Eurozone’s final HICP rate for June and from the US the retail sales for June and the preliminary University of Michigan consumer sentiment for July.
EUR/USD H4 Chart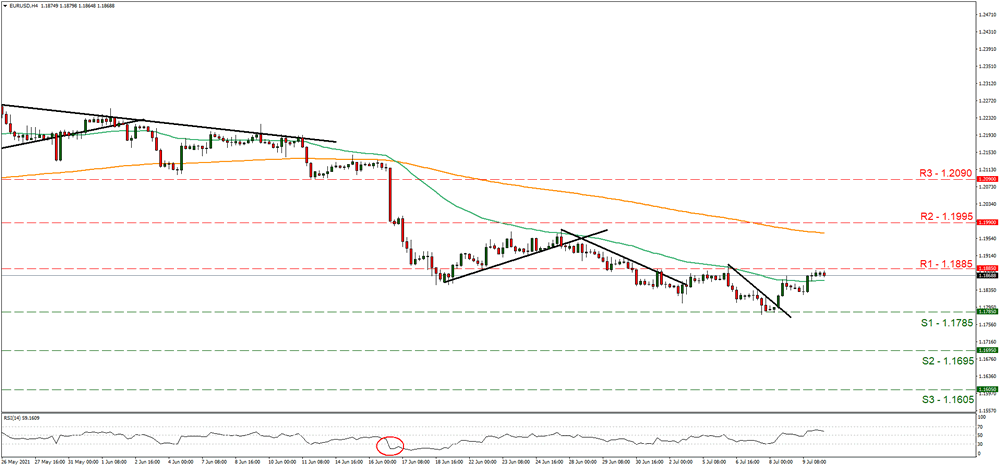
Support: 1.1785 (S1), 1.1695 (S2), 1.1605 (S3)
Resistance: 1.1885 (R1), 1.1995 (R2), 1.2090 (R3)
USD/JPY H4 Chart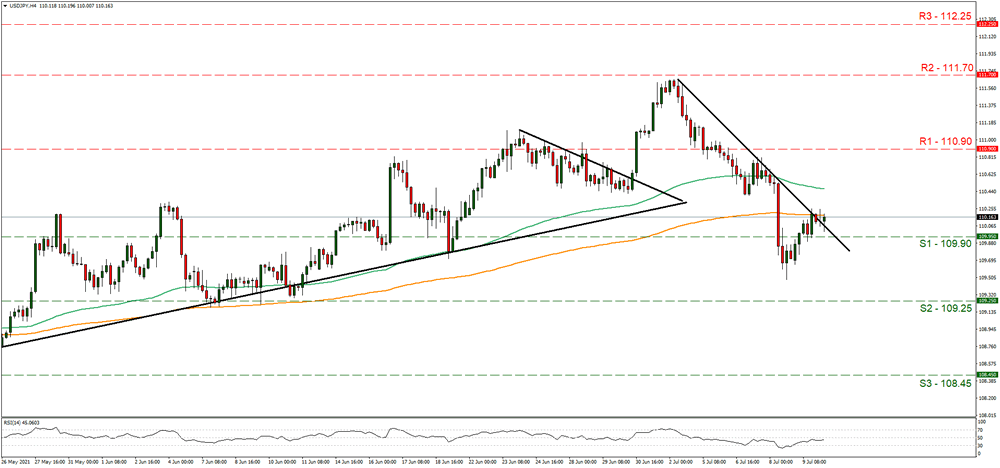
Support: 109.90 (S1), 109.25 (S2), 108.45 (S3)
Resistance: 110.90 (R1), 111.70 (R2), 112.25 (R3)
The Analytical Overview Of The Main Currency Pairs
The EUR/USD currency pair
Technical indicators of the currency pair:
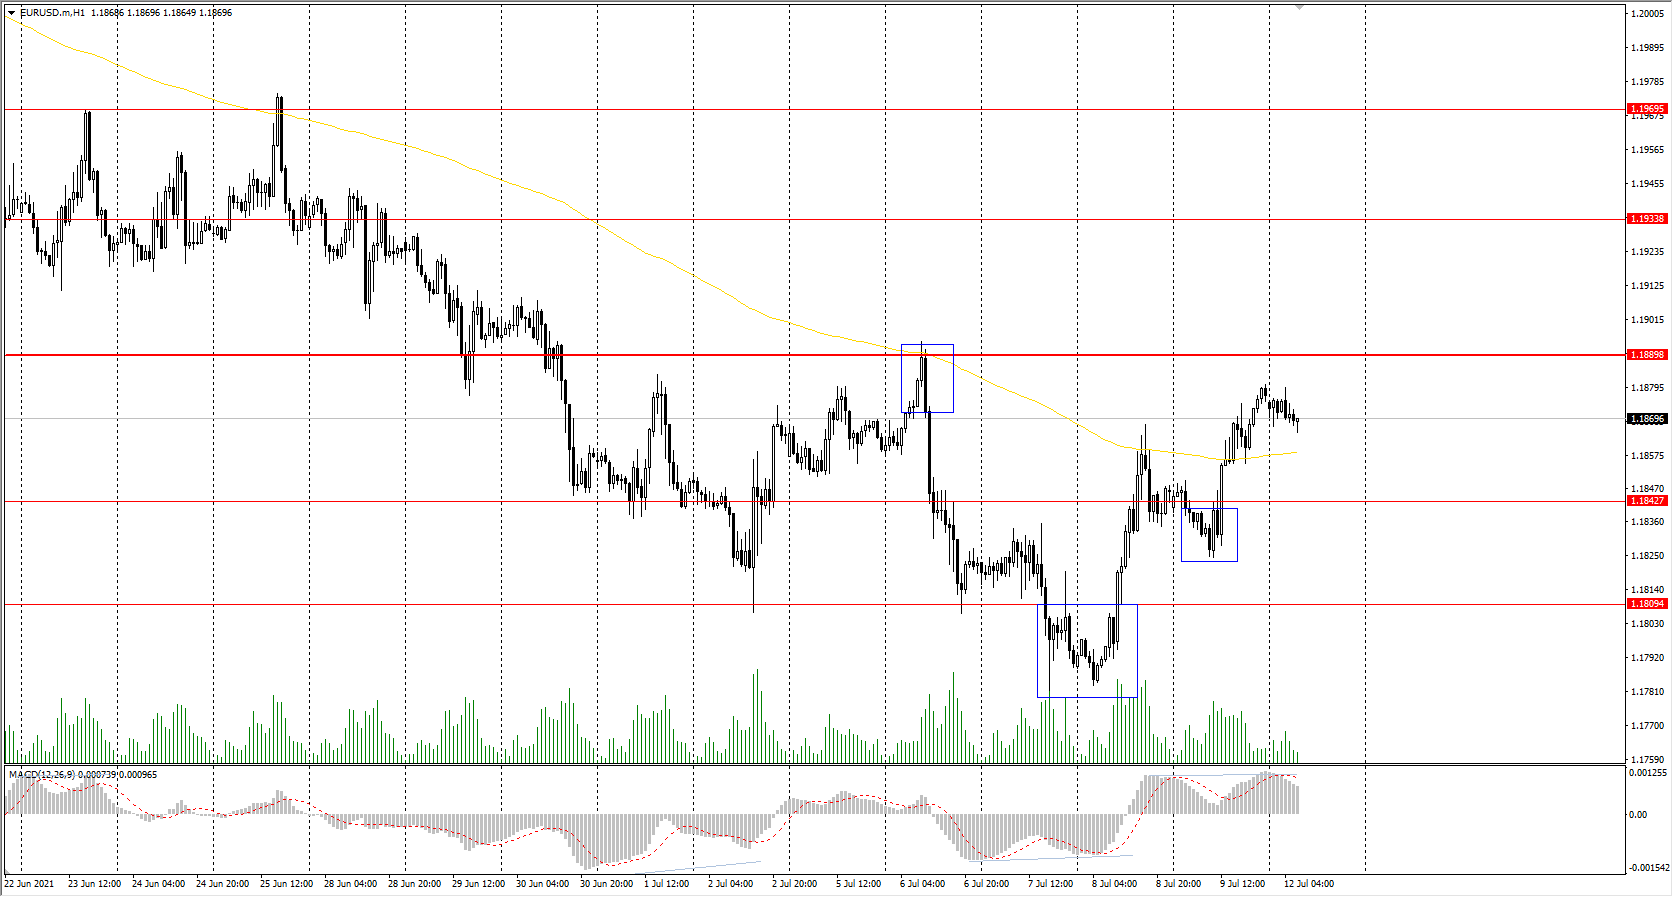
Prev Open: 1.1841
Prev Close: 1.1873
% chg. over the last day: +0.27%
At the end of last week, ECB President Christine Lagarde said it wouldn’t be the right time to cut the stimulus. The ECB program will be changed after March 2022. Considering the central bank has kept the inflation target unchanged at 2%, the fundamental picture plays in favor of the European currency.
Trading recommendations
Support levels: 1.1843, 1.1809, 1.1746, 1.1609
Resistance levels: 1.1889, 1.1934, 1.1969
The trend is still bearish. The price is still below the change priority level. But the buying pressure is increasing. Now the price has already broken through 2 resistance levels and is trading above the moving average. The MACD indicator is in the positive zone with slight divergence. Under such market conditions, it is better to trade intraday. For sell positions, traders should wait for a pullback to the priority change level and see the reaction of sellers showing that they are ready to defend the level. Entries for long positions can be searched on support levels.
Alternative scenario: if the price breaks out through the 1.1889 resistance level and fixes above, the general uptrend is likely to be resumed.
The GBP/USD currency pair
Technical indicators of the currency pair:
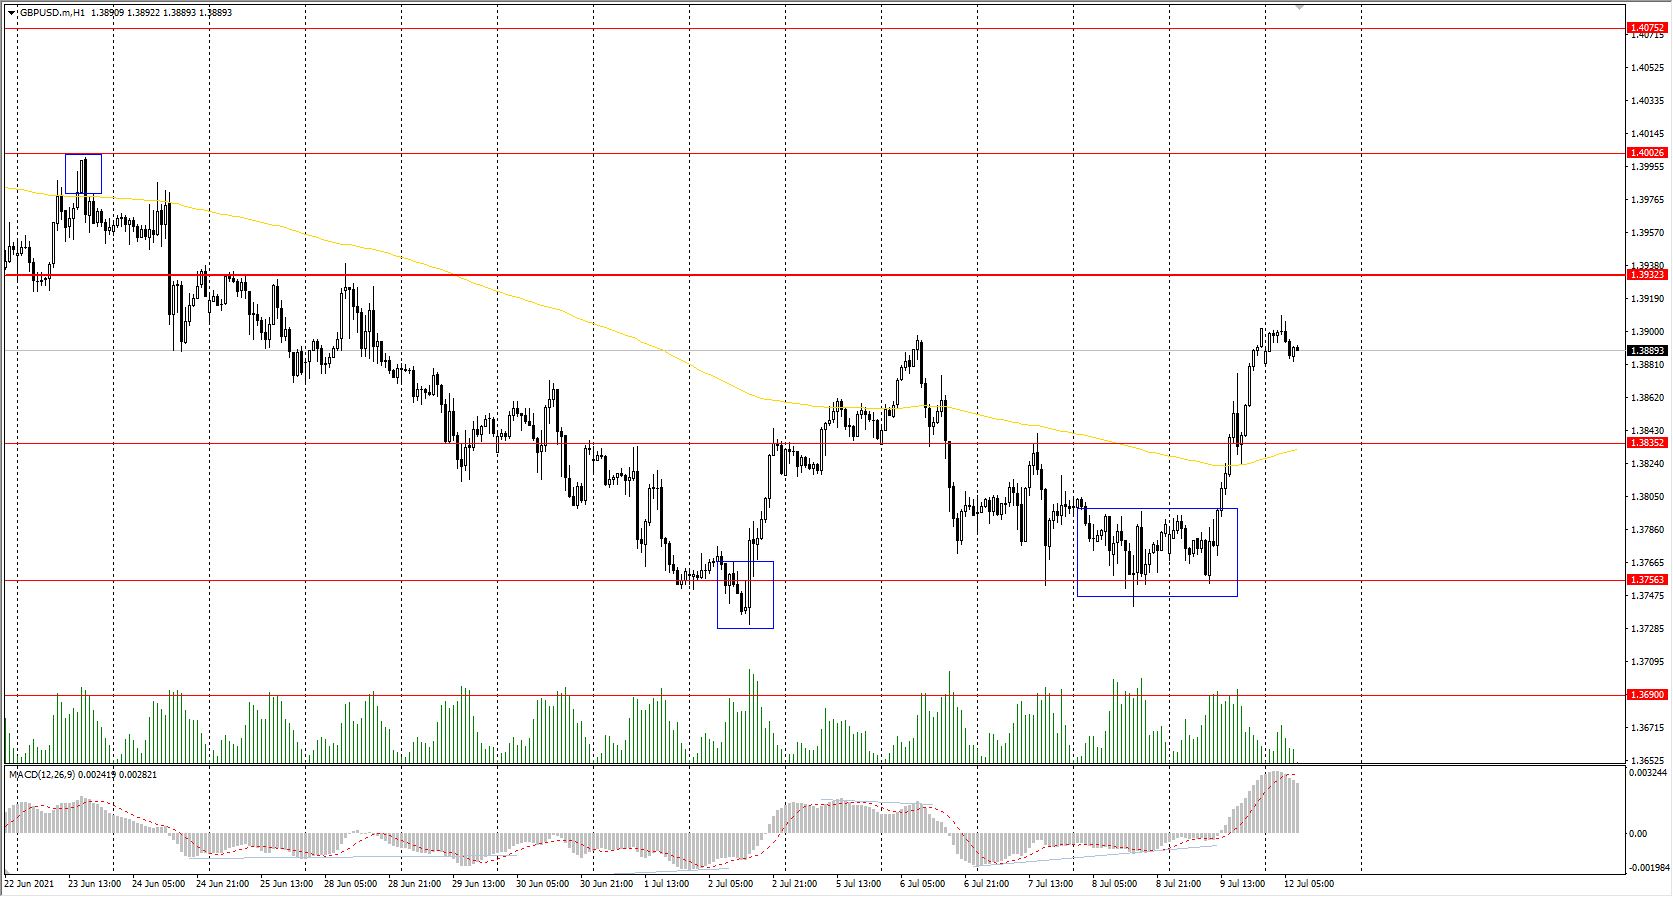
Prev Open: 1.3772
Prev Close: 1.3902
% chg. over the last day: +0.94%
On Friday, the UK reported GDP for the quarter. The data was negative as GDP growth was only 0.8% instead of the forecasted 1.5%. The reasons for the slowdown are a general shortage of chips, a decrease in auto production, a decrease in the construction sector, and continuing strict restrictions across the country. However, despite the slowdown, UK GDP increased for the fourth month in a row.
Trading recommendations
Support levels: 1.3835, 1.3756
Resistance levels: 1.3923, 1.4002, 1.4075, 1.4101, 1.4138, 1.4191
The GBP/USD trend is bearish on the H1 timeframe. But the buyer's pressure is growing rapidly. The price is moving to the priority change level. The MACD indicator is in the positive zone with no signs of divergence. Under such market conditions, it is better to trade intraday. For sell positions, traders should wait for a pullback to the priority change level and see the reaction of sellers showing that they are ready to defend the level. Entries for long positions can be searched on support levels.
Alternative scenario: if the price breaks out through the 1.3922 resistance level and consolidates above, the bearish scenario is likely to be canceled.
The USD/JPY currency pair
Technical indicators of the currency pair:
Prev Open: 109.73
Prev Close: 110.11
% chg. over the last day: +0.35%
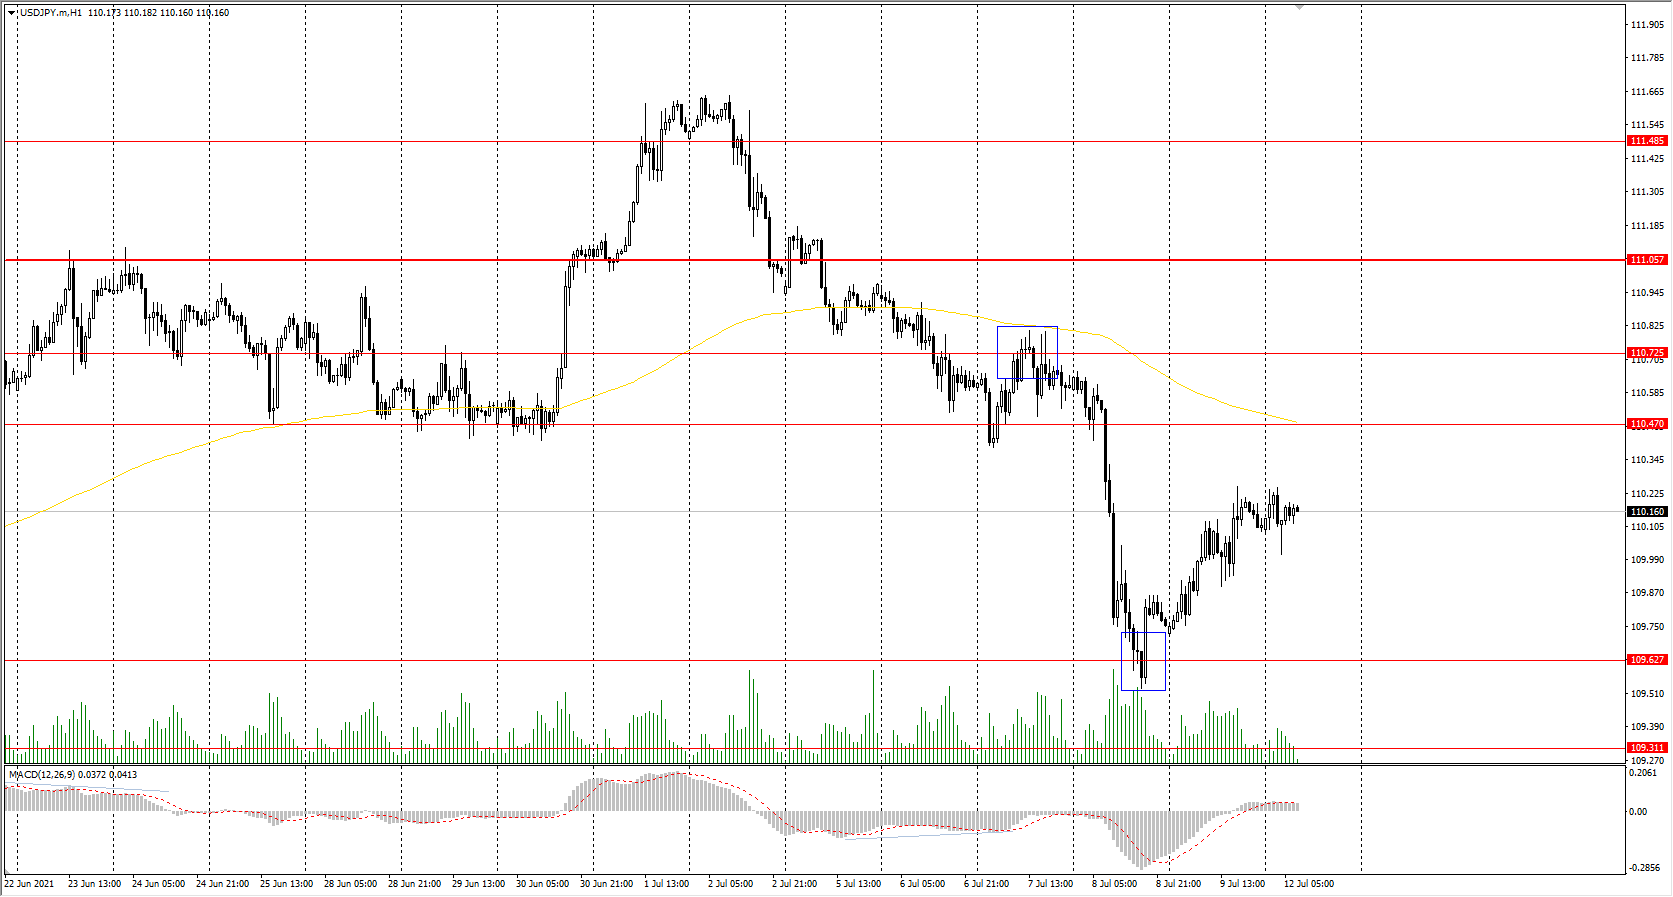
The Japanese yen futures corrected slightly due to a slight increase in US government bond yields (inverse correlation). The general fundamental picture is in favor of a decrease in the USD/JPY currency pair now. A lot will depend on the rhetoric of the Bank of Japan on the interest rate at the end of this week.
Trading recommendations
Support levels: 109.63, 109.31
Resistance levels: 110.47, 110.73, 111.06, 111.48, 110.73, 112.18
From the point of view of technical analysis, the trend on the H1 timeframe is downward. After the sharp drop in quotes on Thursday, the price slightly corrected on Friday. The MACD indicator returned to the zero line. Under such market conditions, traders can look for sell positions from the resistance levels within the day. There are no optimal entry points for long positions now.
Alternative scenario: if the price rises above 111.05, the uptrend is likely to be resumed.
The USD/CAD currency pair
Technical indicators of the currency pair:
Prev Open: 1.2521
Prev Close: 1.2440
% chg. over the last day: -0.65%
Canada's economy has almost completely recovered the jobs lost during the third wave of the pandemic. According to Statistics Canada, the economy added 230,700 jobs in June, and the unemployment rate fell to 7.8%, from 8.2% in May. This is the lowest rate since March 2020. The positive labor market data led the Canadian dollar futures to grow and the USD/CAD (inverse correlation) to fall on Friday.
Trading recommendations
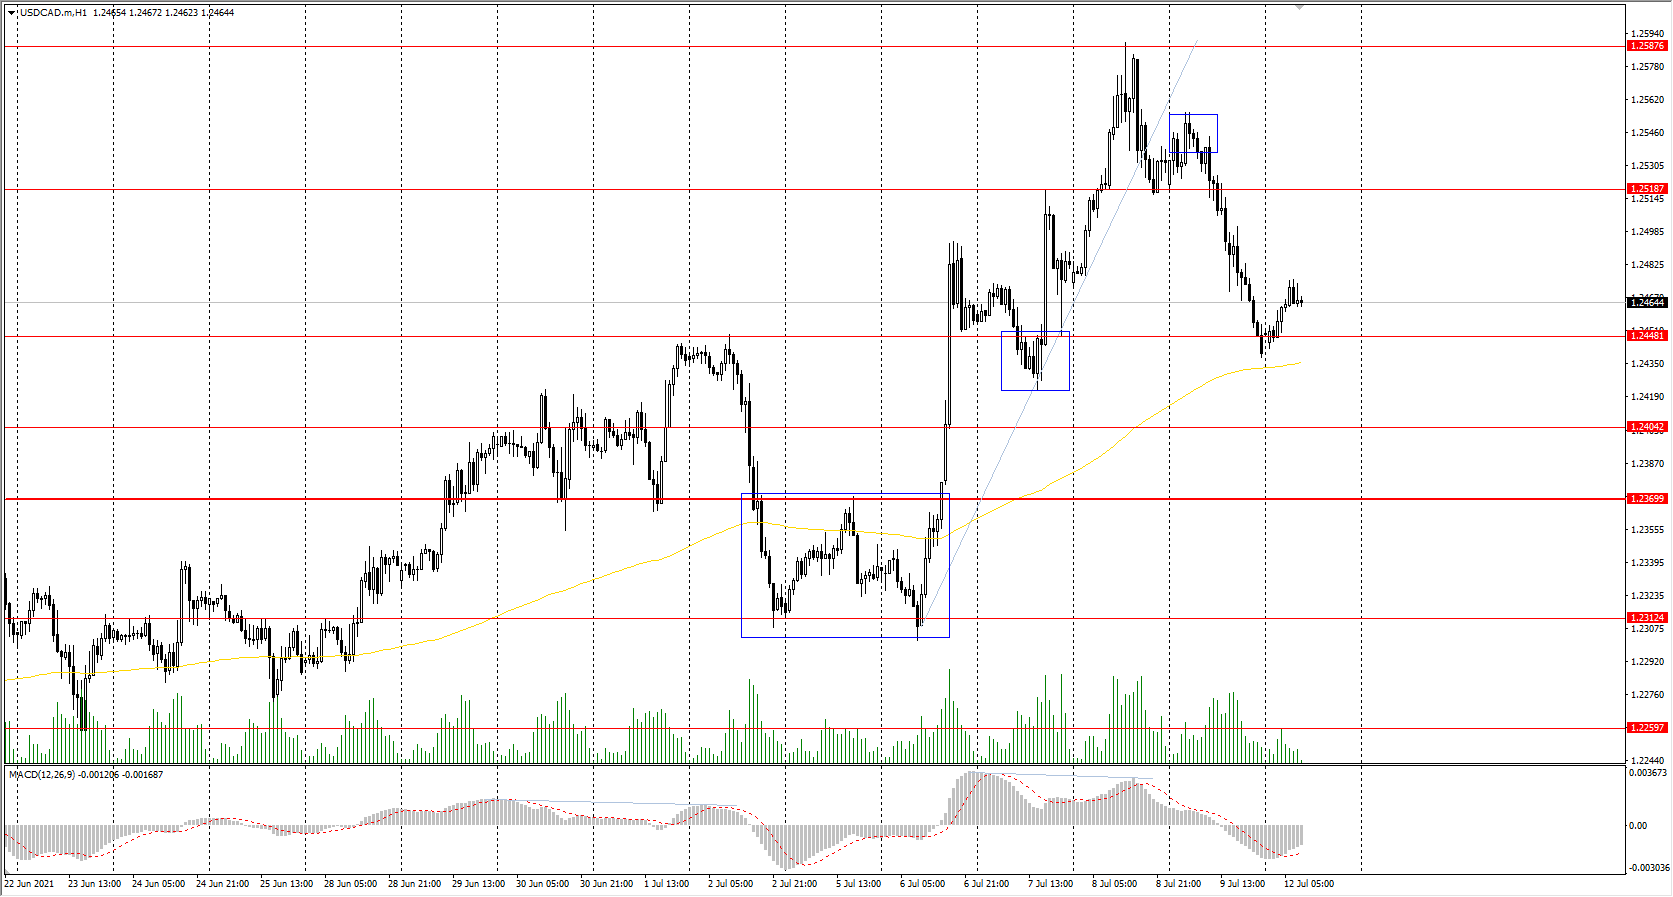
Support levels: 1.2448, 1.2404, 1.2347, 1.2312, 1.2260, 1.2190
Resistance levels: 1.2519, 1.2587
Technically, the trend remains bullish. The price is still trading above the moving average and above the priority change level. The MACD indicator went into the negative zone. Under such market conditions, it is best to trade on the lower timeframes. Buyers may look for trades from the support levels within the day. There are no optimal entry points to open sell positions now.
Alternative scenario: if the price breaks down through the 1.2370 support level and fixes below, the downtrend is likely to be resumed.