Sample Category Title
Fading Sentiment, Fading US Dollar
US dollar under pressure
The US dollar underperformed last week as US bond yields continued to fall. Notably, US yields staged a corrective jump on Friday, the first in eight sessions, yet the US dollar continued to move lower. That suggests that Friday’s US yield jump is temporary, and that momentum has well and truly turned for now for the firmer US dollar trade. Fading expectations about the pace of the global reflation trade appear to be the main culprit, although I suspect technical issues in the US bond market, capping yields, are also playing their part.
Having topped out just above 92.80 last week, the dollar index has fallen to 92.17 as of this morning in Asia, falling by 0.27% on Friday. The 91.50 level looms as the critical support/pivot point for the index now. A daily close below 91.50 and its 100 and 200-day moving averages (DMAs) just below will signal an extended period of dollar weakness that would target 90.00. That said, nerves ahead of the US CPI data tomorrow should limit the downside for the greenback for now. An EM equity washout this week would also limit losses there, with the greenback most likely to feel the pressure versus the major currency space.
EUR/USD still languishes at 1.1870 today, ahead of inflation data tomorrow as well. EUR/USD needs to close above 1.1900 to regain upward momentum. GBP/USD looks more constructive at 1.3890 today, with UK data expected to be positive this week. A close above 1.3900 this evening sets the scene for a test of its main pivot level at 1.4000 later this week.
Although Asian currencies have regained some lost ground versus the US dollar over the last week, they face data-related challenges in the coming week. Suppose China, India, Malaysian, Singapore, and Indonesian data suggest that the regional recovery pace is slowing or has halted. In that case, the AFX space is likely to retreats versus the greenback as investors rotate into the DM space. Similarly, a US Core CPI print above 4.0% will increase concerns that US monetary policy, and Asian monetary policy, will soon diverge in their respective tracks. Again, that risks AFX underperformance versus the greenback.
AUD/USD Pair Started A Decent Recovery From The 0.7450 Resistance Zone
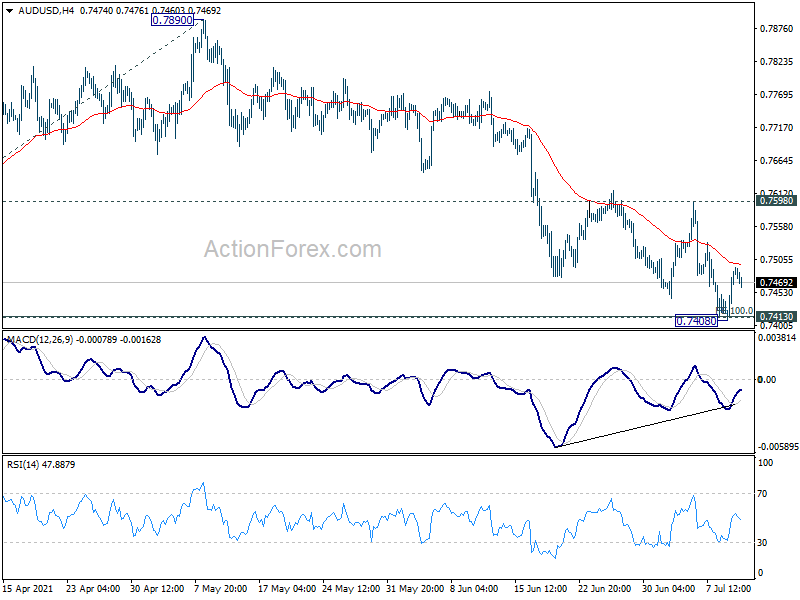
The Aussie Dollar formed a support base above the 0.7400 level and started a decent recovery against the US Dollar. The AUD/USD pair climbed above the 0.7450 resistance zone.
There was also a break above a key bearish trend line with resistance near 0.7440 on the hourly chart. The pair traded above the 0.7480 level and settled above the 50 hourly simple moving average.
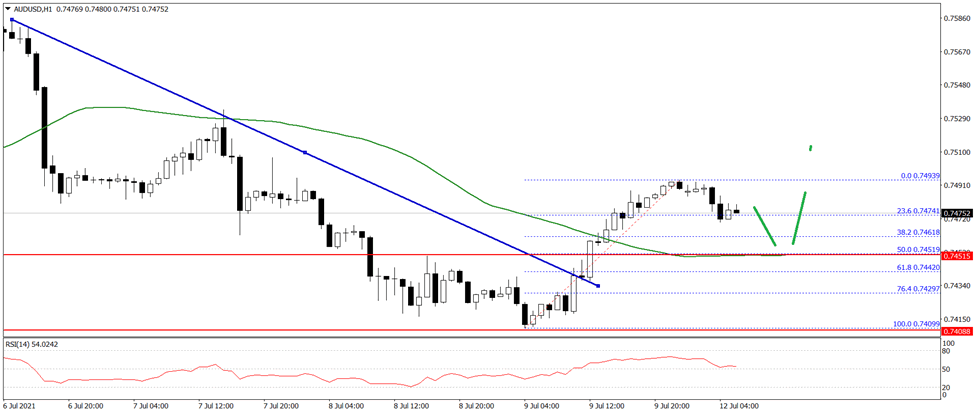
It is now correcting gains and trading below 0.7480 on FXOpen. The first major support is near the 0.7450 level and the 50 hourly SMA, below which the pair could revisit the 0.7410 support zone in the near term.
Conversely, there could be a fresh increase above the 0.7490 resistance level. The first major resistance on the upside is near the 0.7500 level, above which the pair is likely to accelerate higher towards the 0.7550 level.
EUR/USD Daily Outlook
Daily Pivots: (S1) 1.1841; (P) 1.1861; (R1) 1.1897; More...
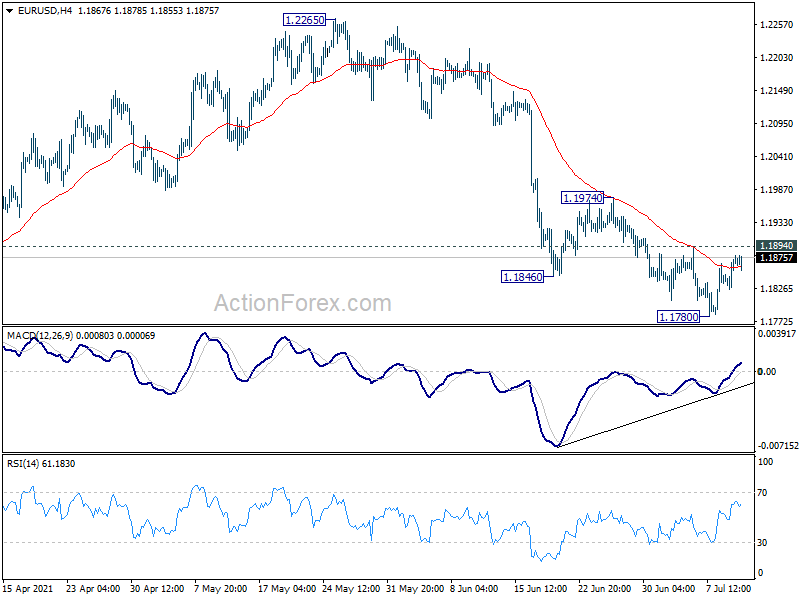
Intraday bias in EUR/USD remains neutral first. Considering bullish convergence condition in 4 hour MACD. Break of 1.1894 minor resistance will indicate short term bottoming at 1.1780. Corrective pattern from 1.2348 might have completed too. Intraday bias will be turned back to the upside for 1.1974 resistance for confirmation. Sustained break there will pave the way back to 1.2265/2348 resistance zone. On the downside, break of 1.1780 will extend the correction to retest 1.1703 support instead.
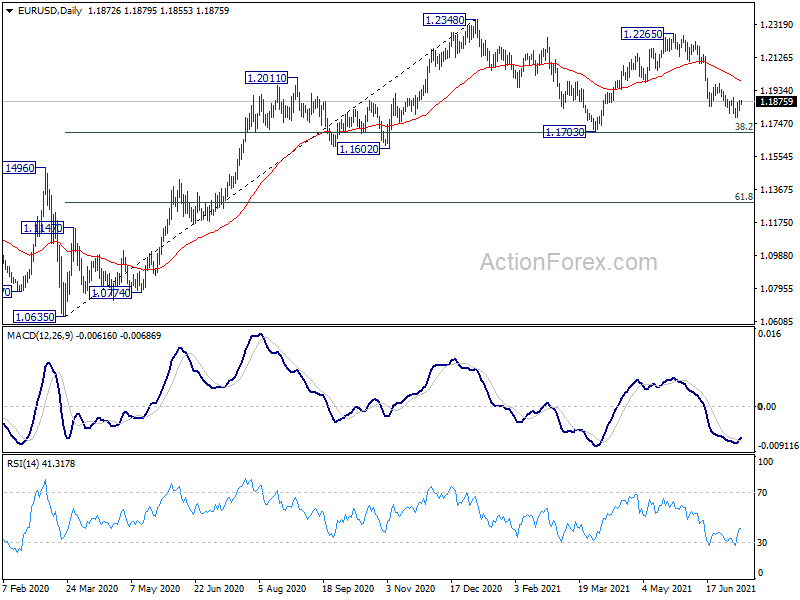
In the bigger picture, rise from 1.0635 is seen as the third leg of the pattern from 1.0339 (2017 low). Further rally could be seen to cluster resistance at 1.2555 next, (38.2% retracement of 1.6039 to 1.0339 at 1.2516). This will remain the favored case as long as 1.1602 support holds. Reaction from 1.2555 should reveal underlying long term momentum in the pair. However sustained break of 1.1602 will argue that the rise from 1.0635 is over, and turn medium term outlook bearish again.
GBP/USD Daily Outlook
Daily Pivots: (S1) 1.3804; (P) 1.3852; (R1) 1.3949; More....
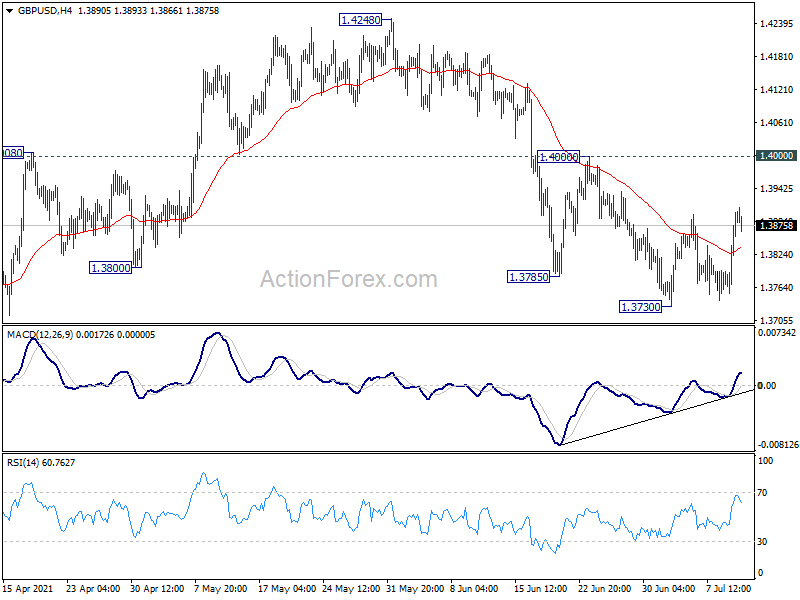
Intraday bias in GBP/USD remains neutral at this point. On the downside, break of 1.3730 will resume the fall from 1.4248, as the third leg of the consolidation pattern from 1.4240, to 1.3668 support and possibly below. On the upside, break of 1.4000 will turn bias back to the upside for retesting 1.4240/8 resistance zone instead.
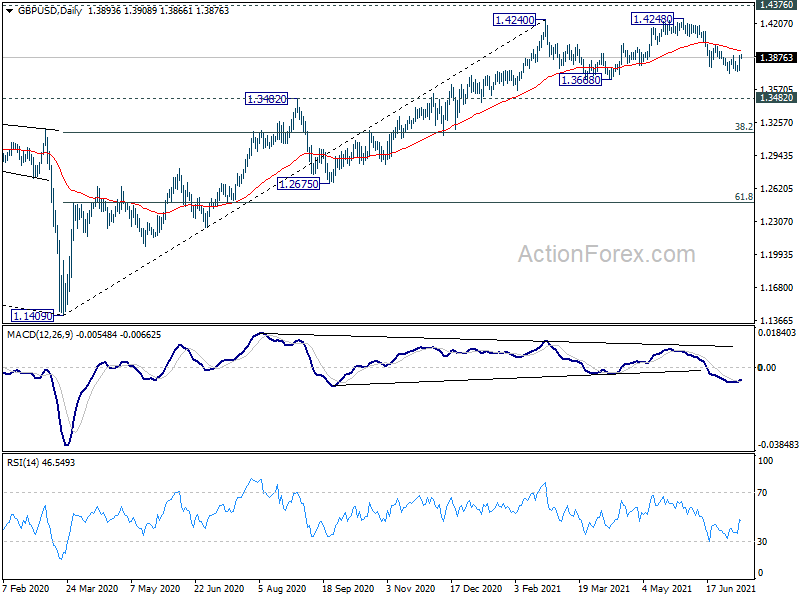
In the bigger picture, as long as 1.3482 resistance turned support holds, up trend from 1.1409 should still continue. Decisive break of 1.4376 resistance will carry larger bullish implications and target 38.2% retracement of 2.1161 (2007 high) to 1.1409 (2020 low) at 1.5134. However, firm break of 1.3482 support will argue that the rise from 1.1409 has completed and bring deeper fall to 1.2675 support and below.
USD/CHF Daily Outlook
Daily Pivots: (S1) 0.9124; (P) 0.9150; (R1) 0.9163; More....
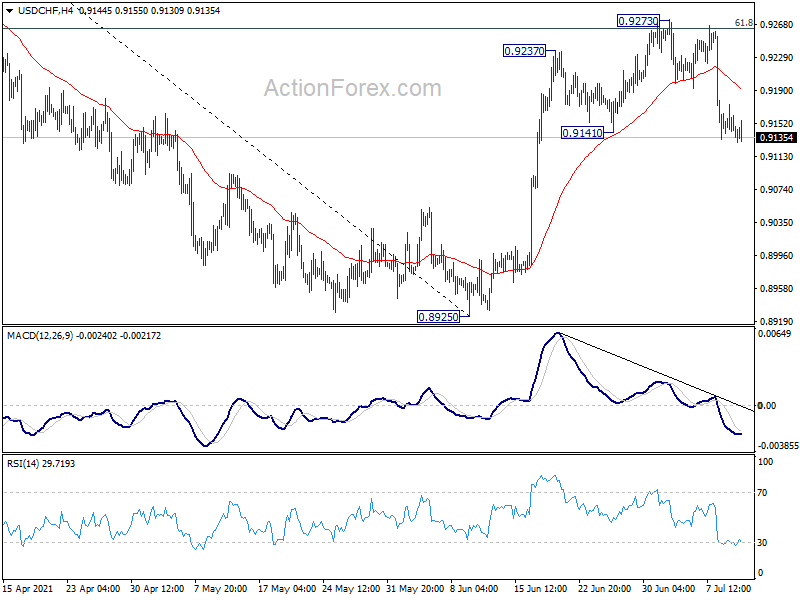
Intraday bias in USD/CHF remains on the downside at this point. Rebound form 0.8925 could completed completed at 0.9273, after rejection by 61.8% retracement of 0.9471 to 0.8925 at 0.9262. Sustained trading below 55 day EMA (now at 0.9121) will pave the way back to retest 0.8925 low. For now, risk will stay on the downside as long as 0.9273 resistance holds, in case of recovery.
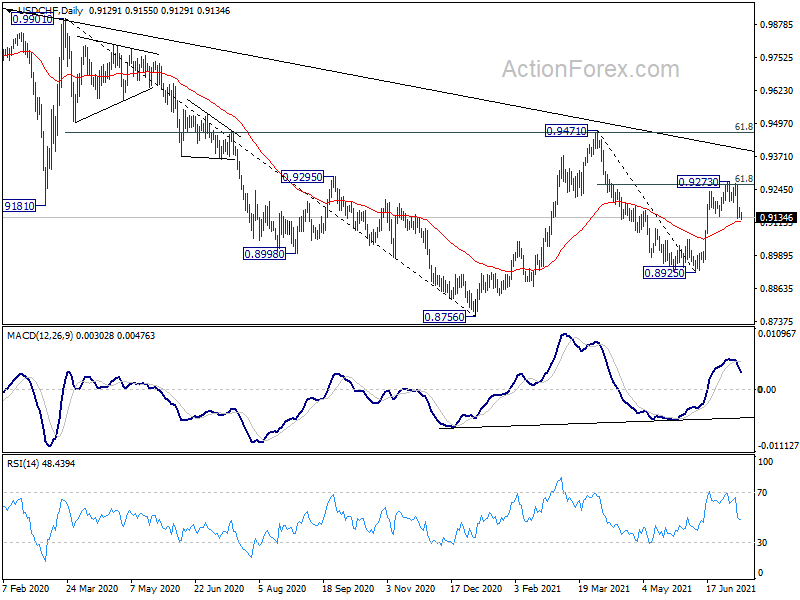
In the bigger picture, medium term outlook is currently neutral with focus on 0.9471 resistance. Sustained break there will indicate completion of whole decline from 1.0342 (2016 high). Medium term outlook will be turned bullish for a test on 1.0342 high. But, rejection by 0.9471 again will revive bearishness for another fall through 0.8756 low.
USD/JPY Daily Outlook
Daily Pivots: (S1) 109.81; (P) 110.03; (R1) 110.33; More...
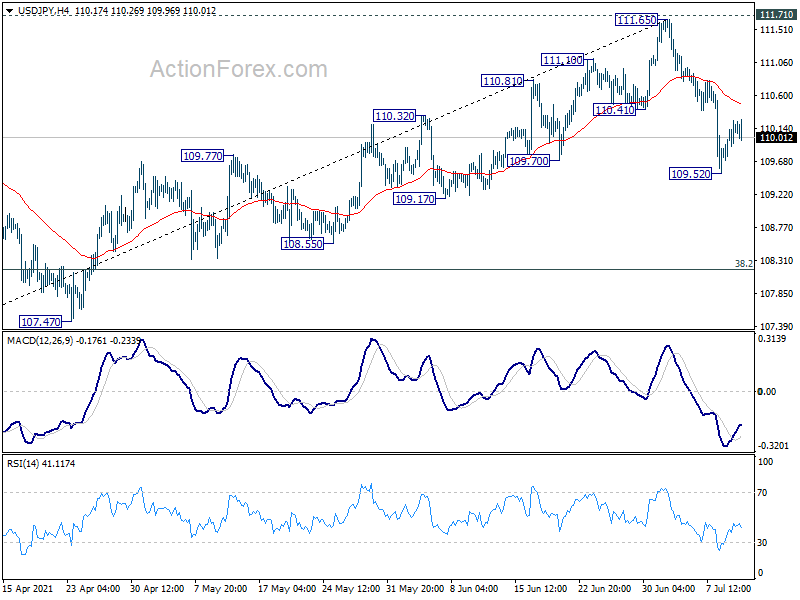
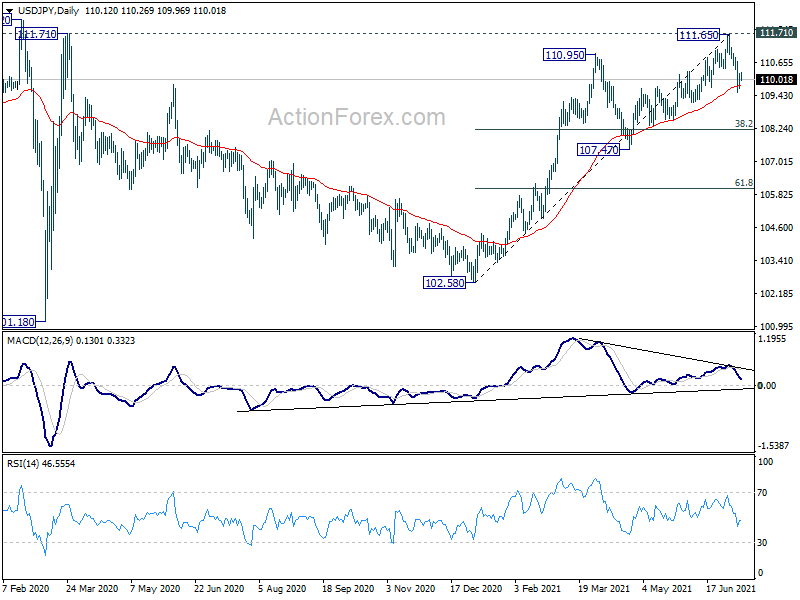
Intraday bias in USD/JPY remains neutral for consolidation above 109.52 temporary low. But risk stays on the downside with 111.65 resistance intact. On the downside, break of 109.52, and sustained trading below 55 day EMA (now at 109.78) will suggests that it's at least correcting the rise from 102.58. Deeper fall would be seen to 38.2% retracement of 102.58 to 111.65 at 108.18 next.
In the bigger picture, medium term outlook is staying neutral with 111.71 resistance intact. Though, as notable support was seen from 55 day EMA, rise from 102.58 is mildly in favor to extend higher. Decisive break of 111.71/112.22 resistance will suggest long term bullish reversal. Rise from 101.18 could then target 118.65 resistance (Dec 2016) and above. However, sustained break of 55 day EMA would revive some medium term bearishness, and open up deep fall back towards 102.58 support.
AUD/USD Daily Report
Daily Pivots: (S1) 0.7435; (P) 0.7465; (R1) 0.7519; More...
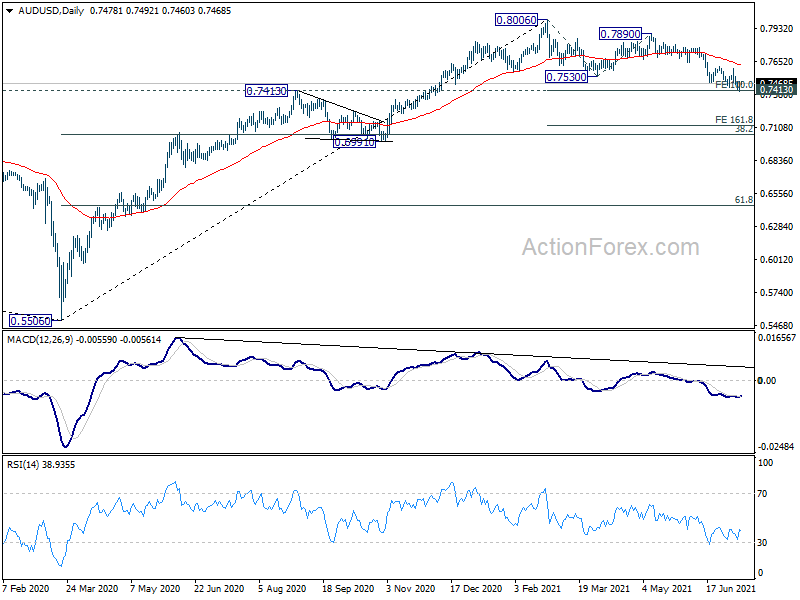
Intraday bias in AUD/USD remains neutral at this point. We're continue to expect strong support from 100% projection of 0.8006 to 0.7530 from 0.7890 at 0.7414 to complete the correction from 0.8006. On the upside, break of of 0.7598 resistance will turn bias back to the upside for 0.7890 resistance first. However, sustained break of 0.7414 will argue it's at least in larger scale correction, and target 161.8% projection of 0.8006 to 0.7530 from 0.7890 at 0.7120 next.
In the bigger picture, rise from 0.5506 medium term bottom could either be the start of a long term up trend, or a corrective rise. Reactions to 0.8135 key resistance will reveal which case it is. Rejection by 0.8135 key resistance, followed by firm break of 0.7413 resistance turned support, will favor the latter case. Deeper decline would be seen to 38.2% retracement of 0.5506 to 0.8006 at 0.7051 first.
Virgin Galactic: SPCE Stock To Space
Last week was quite unsettling for financial markets, but investor optimism is high at the beginning of the new week. US stocks closed mostly higher last Friday, and Asian indices rallied for relief in Monday's session.
The reasons for investor optimism are real: Major global central banks still maintain a soft stance and are prepared to step up support if the upside momentum wears off. For instance, last week, the Chinese central bank lowered its reserve requirement rate, a policy easing to support an economy that has started to show signs of slowing growth.
ECB President Christine Lagarde said that she would announce new monetary stimulus rules in the next 10 days after winding down the existing emergency measures on Monday morning. She also said that the ECB would follow a renewed monetary policy strategy at its next meeting, which envisages a temporary inflation tolerance above 2%. Potentially, the PBC and ECB moves show that central banks stick to easy policy, which has brought back demand for risky assets.
In contrast to last week's dynamics, we see both strengthening in equities and commodities and weakening in the dollar and other defensive currencies. The VIX fear index is back to 16 after jumping from 15 to 22 late last week. All this confirms the bullish sentiment of the markets.
However, the bulls have an important test. This week kicks off the corporate earnings season, where record year-over-year corporate earnings growth is expected.
Among individual tickers worth mentioning is Richard Branson's successful flight on Virgin Galactic. In the run-up to the flight, which took place on Sunday, there was a strong rally in SPCE, but prices stepped down from the highs on Thursday and Friday.
The lack of a rally in SPCE shares would be a worrying signal that investors have become saturated with the stock. The same could be valid for the whole market, which has put very optimistic expectations in the quotes, which will not be easy to confirm.
It would be ironic if the markets were to enter broad-based profit-taking this week on the back of the highly optimistic expectations. However, central banks have coped very well with their role as the last line of support for the economy.
USD/CAD Daily Outlook
Daily Pivots: (S1) 1.2411; (P) 1.2484; (R1) 1.2525; More...
Intraday bias in USD/CAD remains neutral for consolidation below 1.2589 temporary top. Another rise is still in favor as long as 1.2301 support holds. Break of 1.2589 will target 1.2653 structural resistance to confirm larger bullish reversal. However, on the downside, break of 1.2301 support will dampen the bullish case and turn bias back to the downside for 1.2005 low instead.
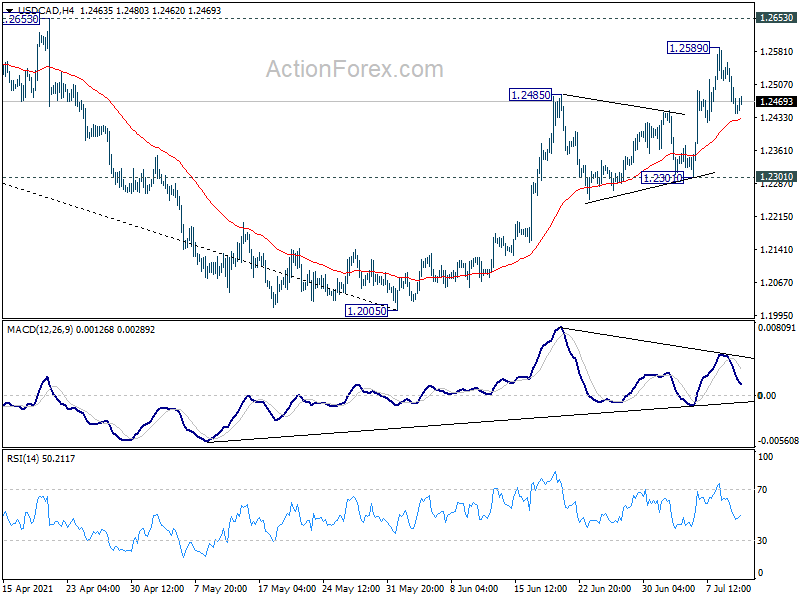
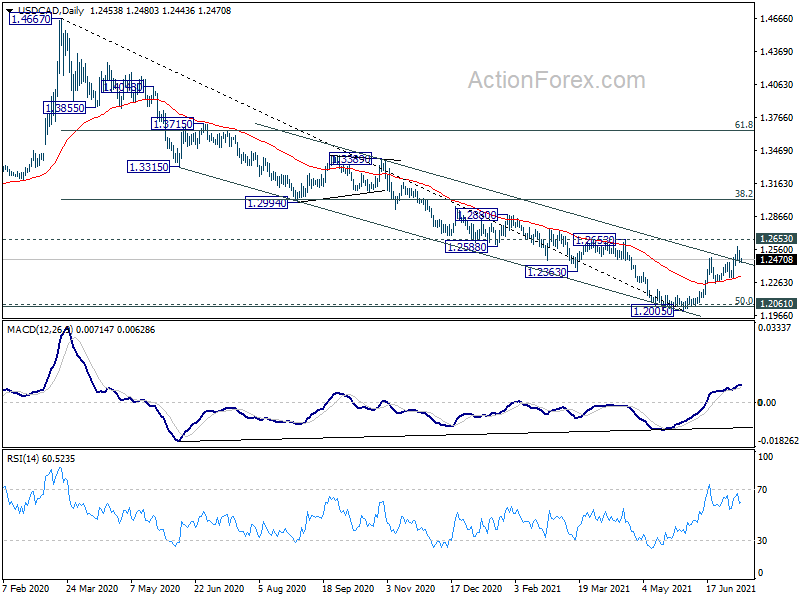
In the bigger picture, fall from 1.4667 is seen as the third leg of the corrective pattern from 1.4689 (2016 high). It might have completed after hitting 1.2061 (2017 low) and 50% retracement of 0.9406 to 1.4689 at 1.2048. Sustained break of 38.2% retracement of 1.4667 to 1.2005 at 1.3022 will pave the way to 61.8% retracement at 1.3650. Overall, medium term outlook remains neutral at worst with 1.2048/61 support zone intact.
USDJPY Bullish Divergence
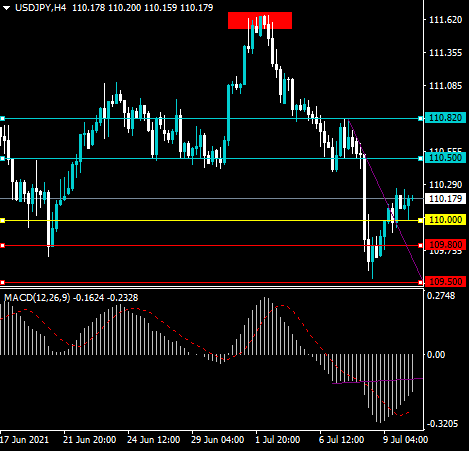
The US dollar is attempting to recover higher against the Japanese yen currency after the pair found strong technical support just above the 109.50 level. The four-hour time frame is showing that bullish MACD price divergence had formed during last weeks price drop. Watch out for a recovery towards the 110.82 area in the USDJPY pair if the bullish price divergence starts to reverse.
The USDJPY pair is only bullish while trading above the 110.00 level, key resistance is found at the 110.50 and 110.82 levels.
The USDJPY pair is only bearish while trading below the 110.00 level, key support is found at the 109.80 and 109.50 levels.