Sample Category Title
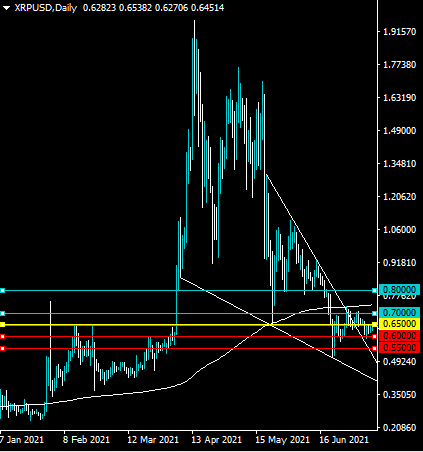
XRPUSD Wedge Watch
Ripple is on the rise on Monday as Bitcoin and other top cryptocurrencies start to look more bullish after a mixed weekend. The XRPUSD pair continues to hold above a falling wedge pattern on the daily time frame and could start to test towards the 0.8000 level. Traders should know that the bearish trend in the XRPUSD will end if the price moves above the pairs 200-day moving average, around the 0.7300 area.
The XRPUSD pair is only bullish while trading above the 0.6500 level, key resistance is found at the 0.7000 and the 0.8000 levels.
If the XRPUSD pair trades below the 0.6500 level, sellers may test the 0.6000 and 0.5500 levels.
USD/CAD Decline Likely To Continue
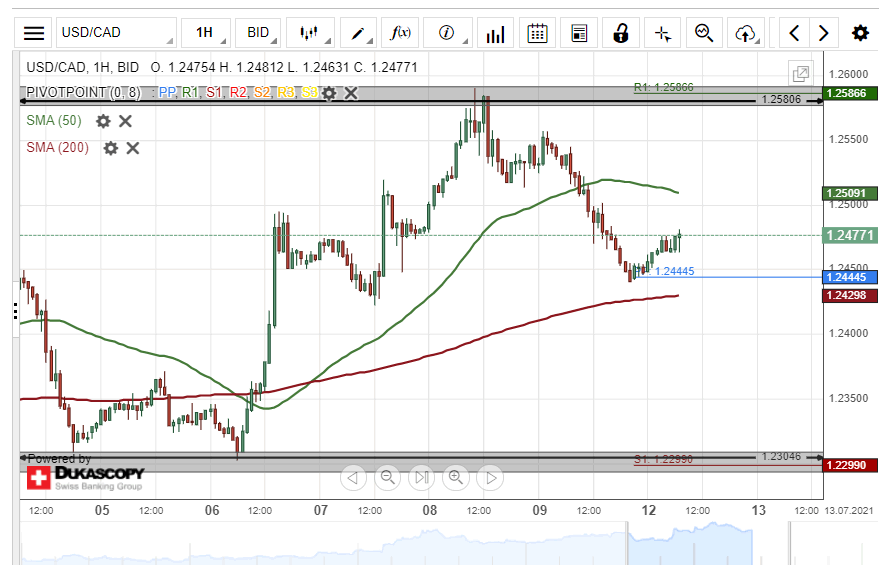
Bearish sentiment dominated the USD/CAD currency pair on Friday. As a result, the US Dollar fell by 111 pips or 0.88% against the Canadian Dollar during Friday's trading session.
Everything being equal, the currency exchange rate could continue to trend lower during the following trading session. The potential target for sellers will be near the 1.2400 level.
However, the 200– hour simple moving average at 1.2429 could a barrier for bearish traders within this session.
GBP/JPY Two Scenarios Likely
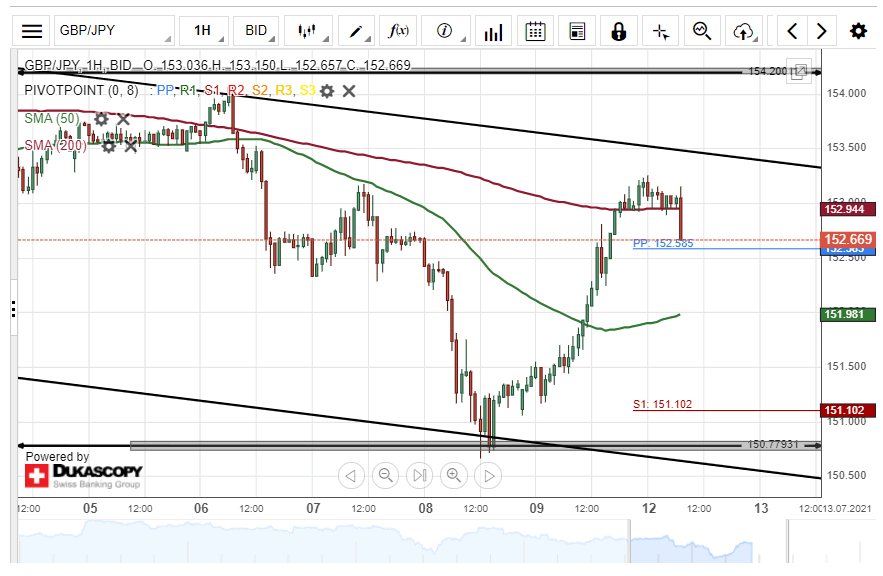
Upside risks pressured the British Pound higher against the Japanese Yen on Friday. The GBP/JPY currency pair surged by 208 pips or 1.38% during Friday's trading session.
On Monday morning, the exchange rate was trading near the upper line of a descending channel pattern at 152.98 could be set for a breakout.
If the breakout occurs, a surge towards the weekly resistance level at 154.50 could be expected today.
However, if the channel pattern holds, sellers might drive the currency exchange rate towards the 151.50 area within this session.
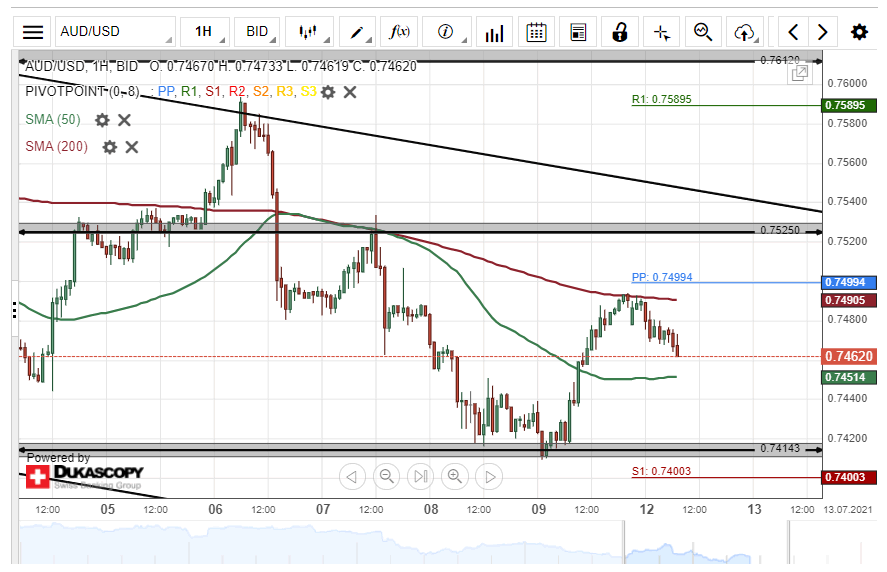
AUD/USD Tests 200- Hour SMA
On Friday, the Australian Dollar edged higher by 80 pips 1.08% against the US Dollar. The surge was stopped by the 200– hour simple moving average during Friday's trading session.
As for the near future, the AUD/USD currency exchange rate is likely to continue to trend upside. Bullish traders might target the 0.7570 area during the following trading session.
However, the 200– hour SMA at 0.7490 could still provide resistance for the exchange rate within this session.
EUR/JPY Remains Near 131.00 Level
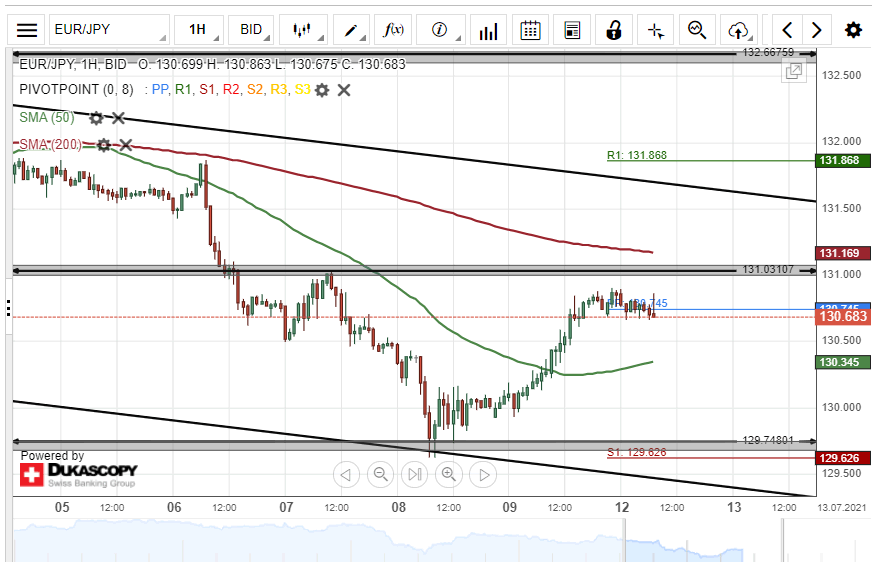
Upside risks dominated the EUR/JPY currency pair on Friday. As a result, the common European currency surged by 103 pips or 0.80% against the Japanese Yen during Friday's trading session.
Currently, the currency exchange rate is trading near a resistance level at the 131.00 region.
If the resistance line holds, a decline towards the 130.00 area could be expected within this session.
However, if the price breaks the 131.000 level, buyers could target the 131.50 mark today.
EURUSD Ticks Marginally Down Before Meeting 20-Day SMA
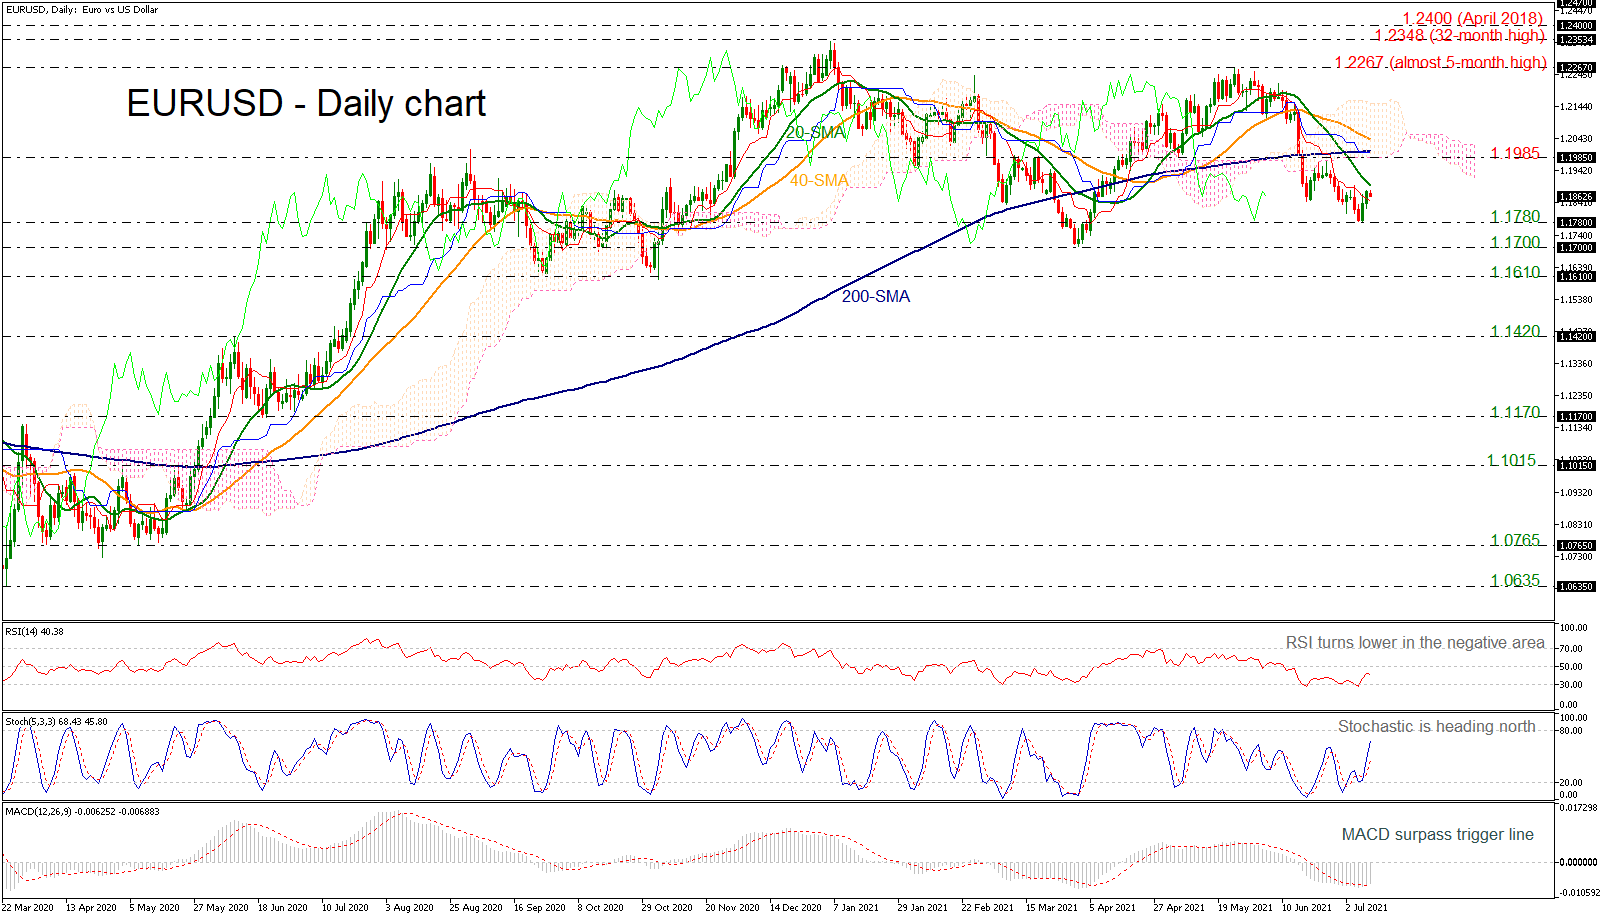
EURUSD rebounded off the 1.1780 support level, trying to meet the short-term 20-day simple moving average (SMA). However, today, the pair is losing some steam, driving the RSI lower in the negative territory. Despite the latest move, the MACD is surpassing the trigger line in the bearish region, while the stochastic is still moving north.
Immediate support for steeper declines could come from the 1.1780 barrier ahead of the 1.1700 psychological number. Overcoming these obstacles, the 1.1610 barrier, taken from the low in November 2020, could come into the spotlight before slipping to 1.1420, being the inside swing high from June 2020.
On the other side, a step above the 20-day SMA could take the market until the 1.1985 resistance, marginally beneath the 200-day SMA at 1.2000. Above this level, the 40-day SMA at 1.2040 and the upper surface of the Ichimoku cloud could come next at 1.2160. Rising higher, the almost five-month high of 1.2267 may halt the bullish actions.
Summarizing, EURUSD has been in a descending mode since May 25, but the broader outlook seems to be neutral.
Daily Tecnical Analysis
EUR/USD
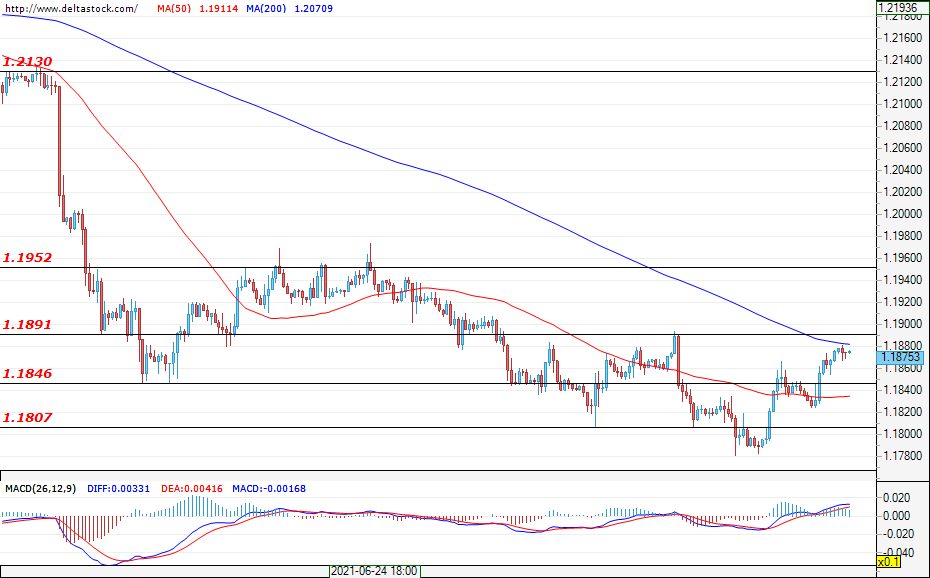
Current level - 1.1875
During the last trading session for the previous week, the currency pair managed to breach and stay above the resistance level of 1.1846. At the start of the new week, the forecasts are for the pair to test and violate the next resistance level of 1.1891, which could pave the way towards the main resistance at 1.1952. In the negative direction, the first support level lies at 1.1800. This week, investors' attention will be focused on the data on the initial jobless claims for the U.S. (Thursday; 12:30 GMT) and the CPI for the EU (Friday; 09:00 GMT).
| Resistance | Support | ||
| intraday | intraweek | intraday | intraweek |
| 1.1890 | 1.1950 | 1.1800 | 1.1750 |
| 1.1950 | 1.2130 | 1.1750 | 1.1716 |
USD/JPY
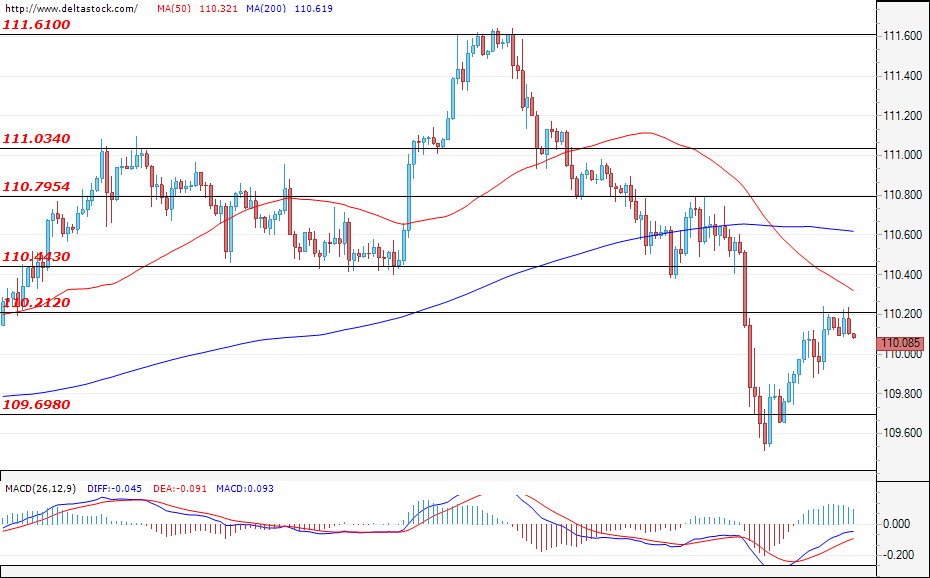
Current level - 110.08
Following the strong sell-off, the currency pair found support at the level of 109.70 at the end of last week and, at the time of writing the analysis, it is found in a corrective phase. The expectations are for the pair to test the resistance level of 110.21. If the test turns out to be successful, then the next resistance level of 110.44 would probably get tested as well. In the negative direction, the first support is found at the previously mentioned level of 109.70.
| Resistance | Support | ||
| intraday | intraweek | intraday | intraweek |
| 110.21 | 110.79 | 109.70 | 108.50 |
| 110.44 | 111.03 | 109.00 | 107.50 |
GBP/USD
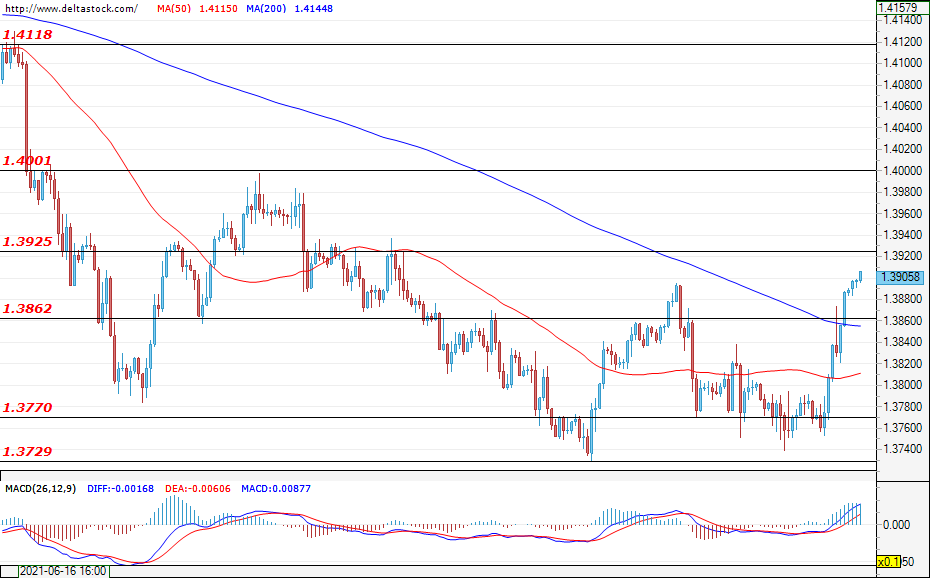
Current level - 1.3905
At the end of last week, the currency pair violated the resistance level of 1.3862 and, at the time of writing, it is headed towards a test of the next resistance level of 1.3925. If the bulls fail to gain enough momentum, then it is possible for the pair to enter a consolidation phase. In the negative direction, the former resistance level of 1.3862 is now acting as a support. This week, investors' attention will be focused on the data on the CPI for the UK (Wednesday; 06:00 GMT) and on the Claimant count employment change, again for the UK (Thursday; 06:00 GMT).
| Resistance | Support | ||
| intraday | intraweek | intraday | intraweek |
| 1.3925 | 1.4000 | 1.3860 | 1.3660 |
| 1.4000 | 1.4118 | 1.3770 | 1.3610 |
UK 100 Holds Above Daily Support
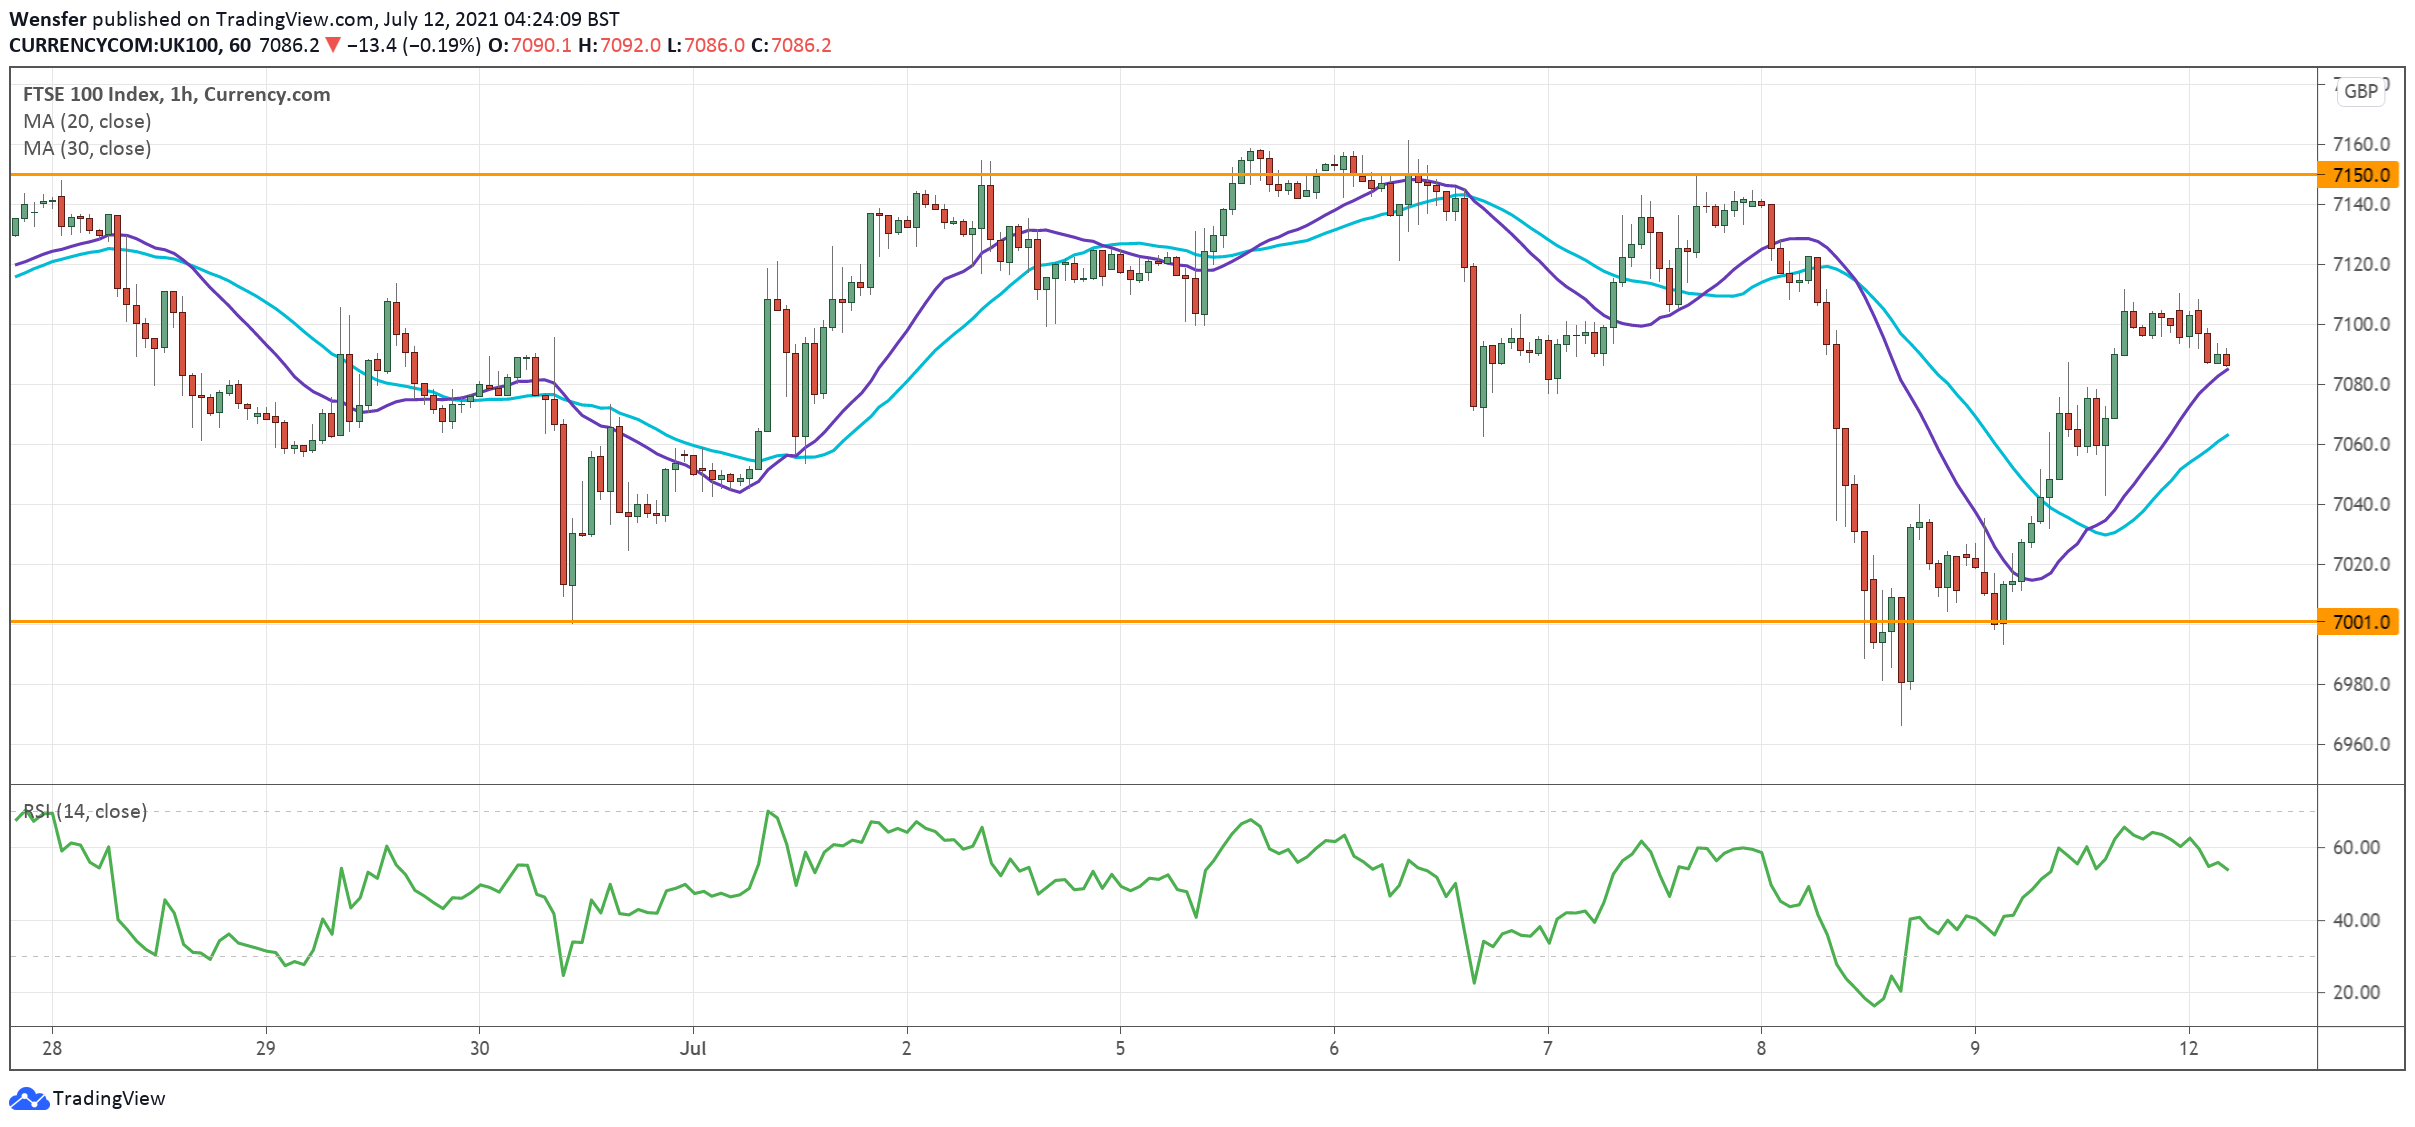
The FTSE 100 recovers as lackluster GDP growth may keep the BOE off the hawkish path.
The index is in consolidation between the daily support at 6940 and 7200. As long as the bulls bid up the price above the support, the medium-term rally is still intact.
The current volatility is a sign of short-term turnover. After the RSI rose back from an oversold situation, price action found support at the psychological level of 7000.
7150 is the resistance ahead, a breakout could challenge the peak at 7200.
CAD/JPY Recovers Temporarily
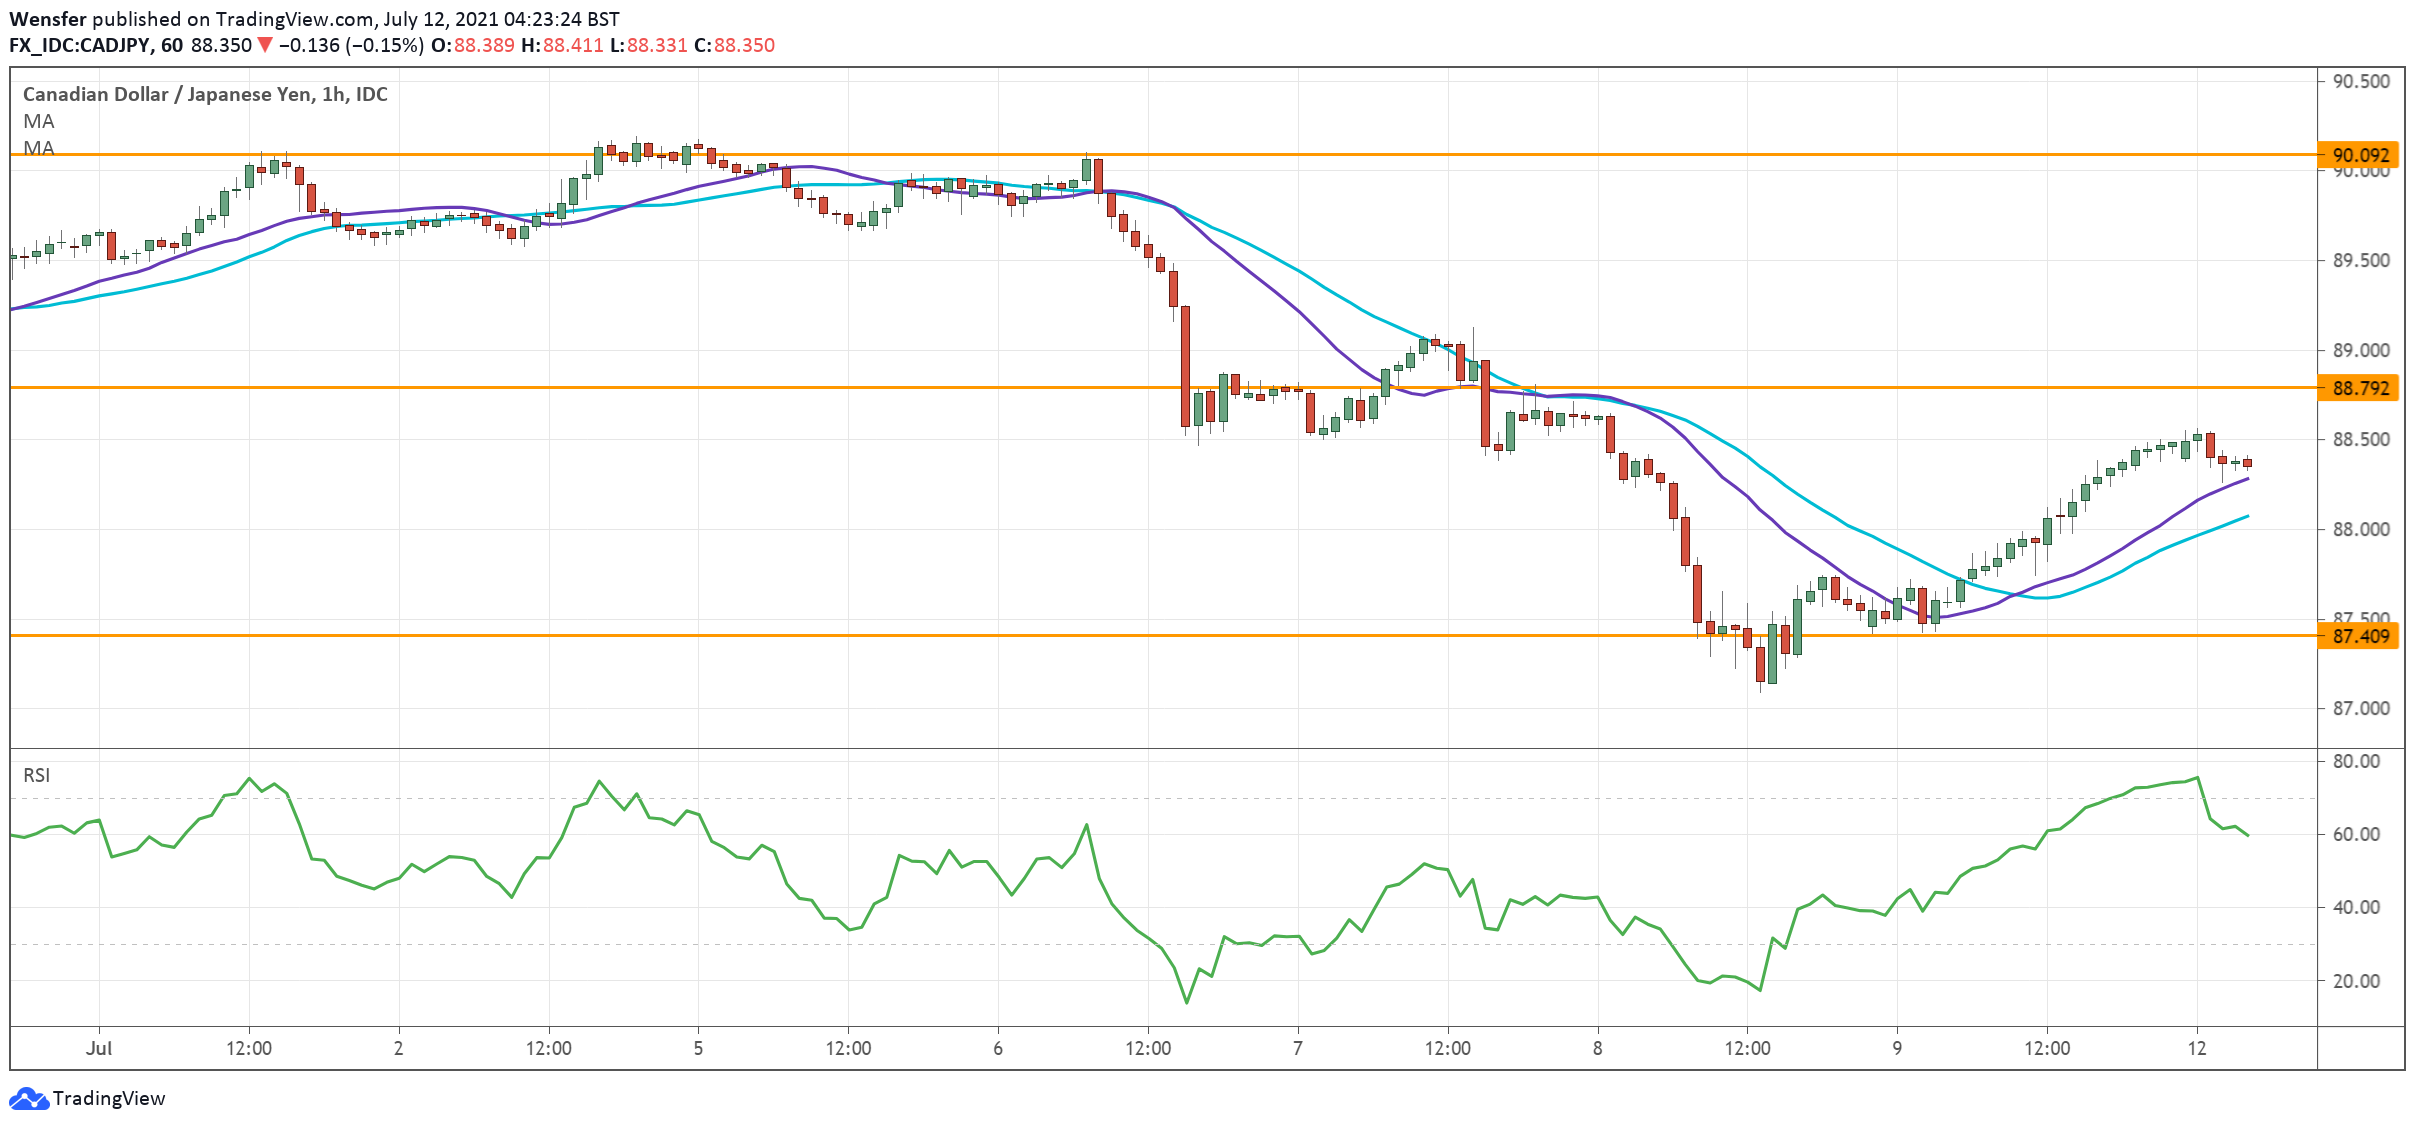
The Canadian dollar bounces back after a fall in June’s unemployment rate.
The drop below 88.00, the origin of the previous rebound, has put the loonie back on the correction path.
The RSI’s double-dip into the oversold zone has prompted intraday players to take profit, momentarily driving up the price.
This may turn out to be a dead cat bounce as the pair tests the supply area around 88.80. A drop below 87.40 could lead to another round of sell-off towards the major demand zone around 86.50 on the daily chart.
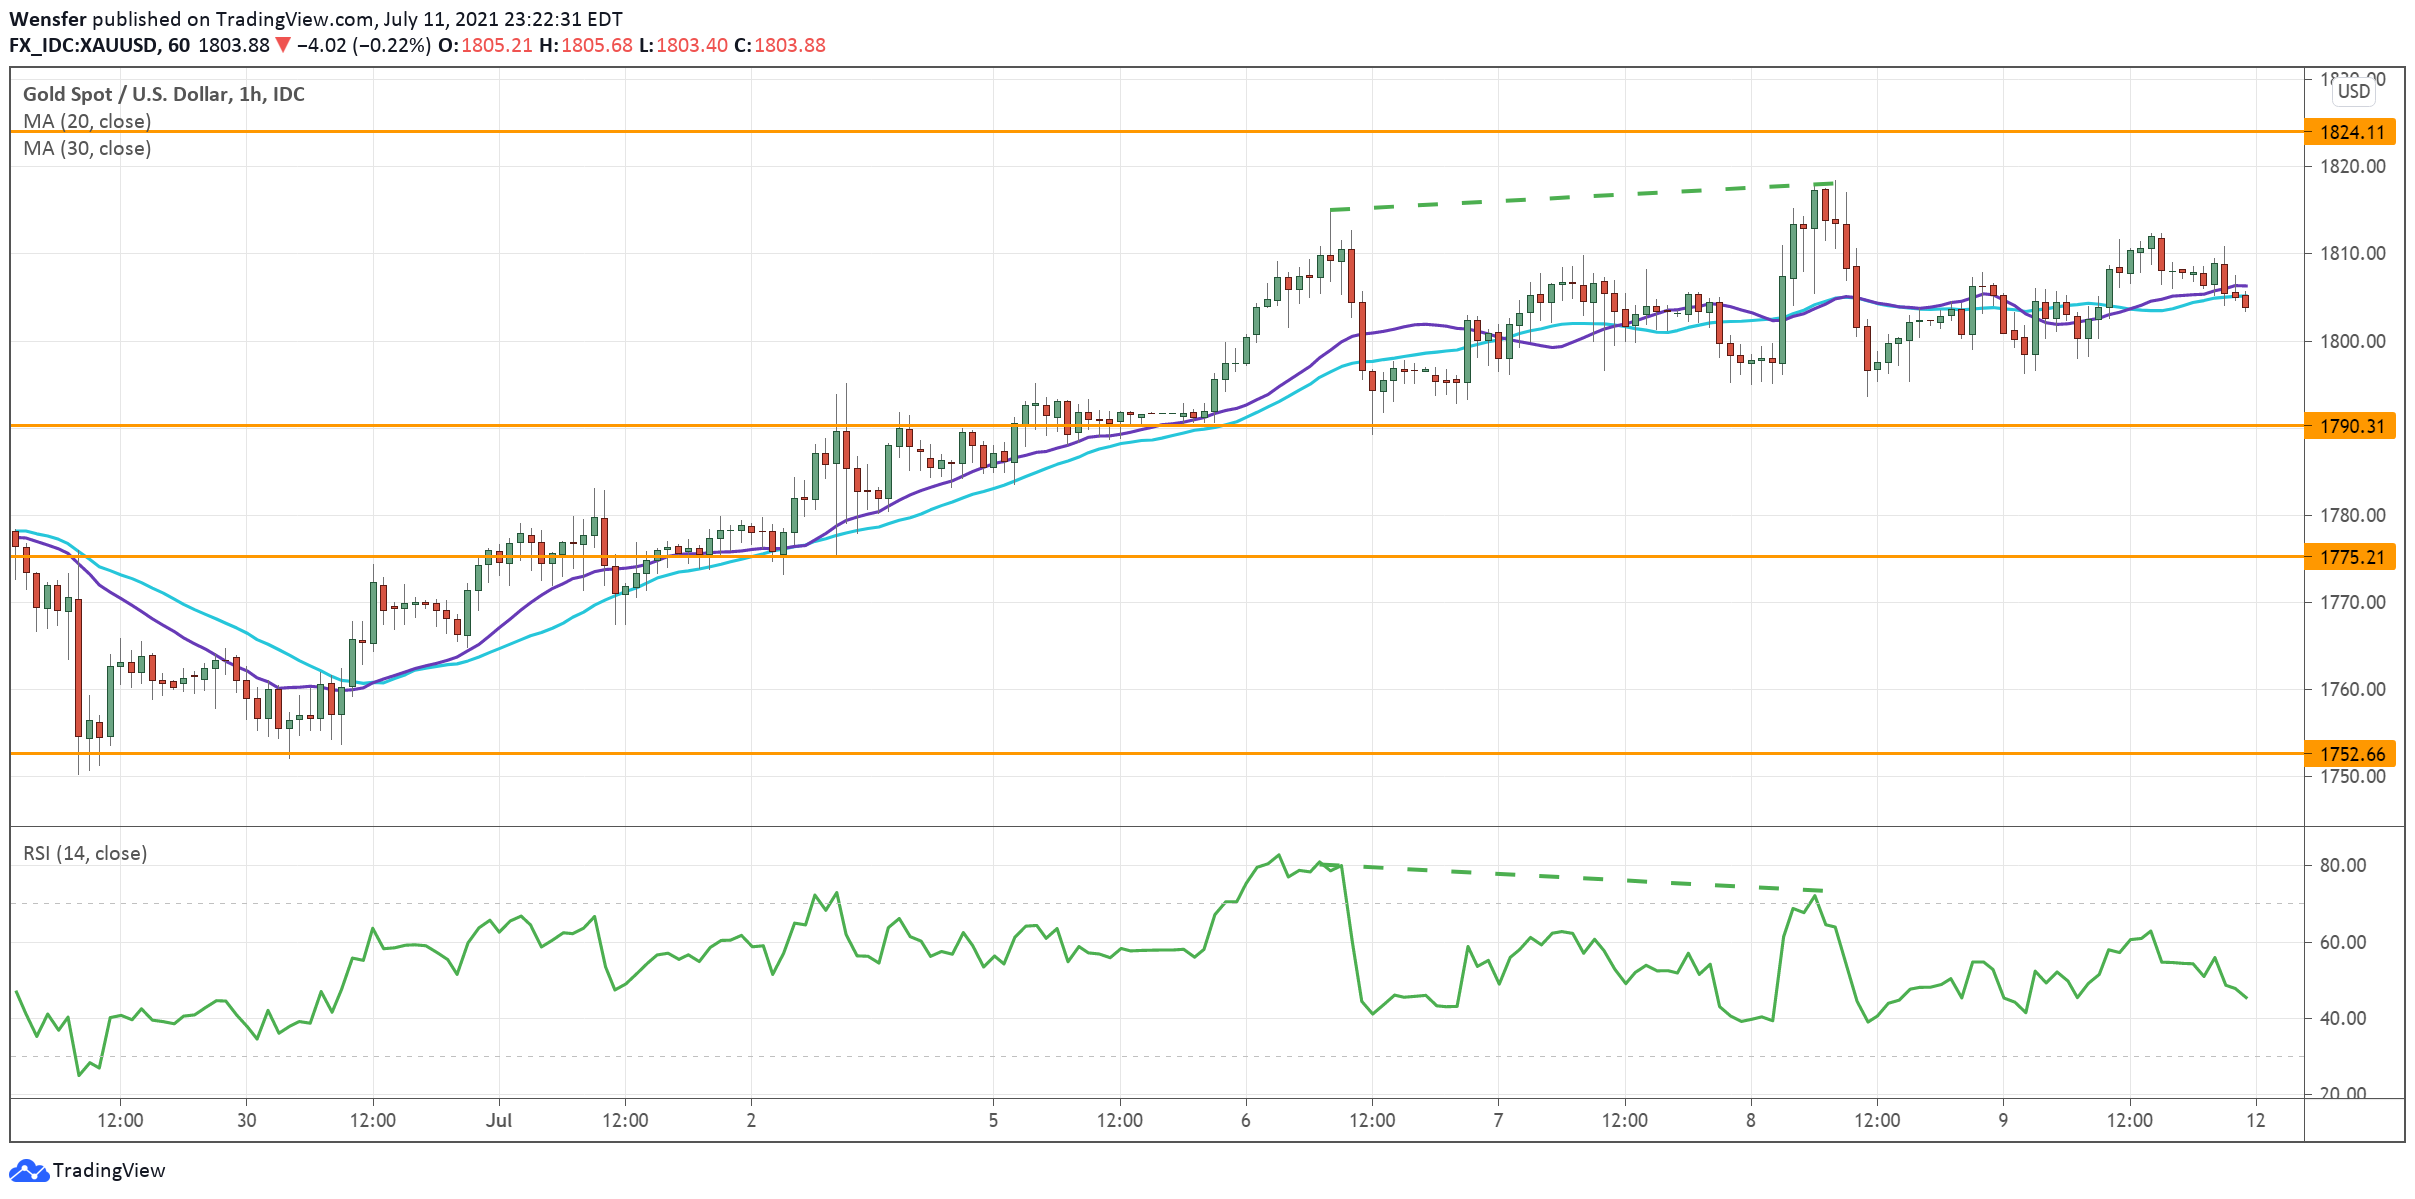
XAU/USD Rally Slows Down
Gold grinds higher as the US dollar softens amid lower Treasury yields.
The rally slowed as the bulls pushed towards the key resistance at 1824. A bullish breakout could trigger an extended rally and further confirm the reversal.
However, the RSI divergence may temper the enthusiasm. Its failure to follow the price and achieve a higher high is a warning sign of fading momentum.
1790 is the immediate support and its breach could send the price to 1775, where the precious metal first broke out of its bearish range.