Sample Category Title
CFTC Commitments of Traders – Traders Increased Bets in USD Futures amidst Price Rebound
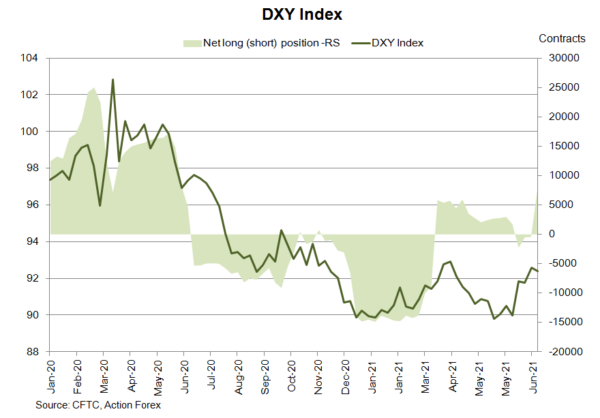
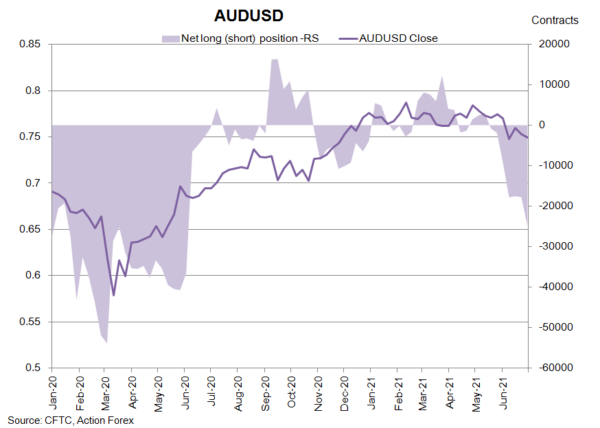
As suggested in the CFTC Commitments of Traders report in the week ended July 6, NET SHORT of USD index futures gained +8 017 contracts. Speculative long positions added +2 309 contracts while shorts decreased -5 708 contracts. Concerning European currencies, NET LENGTH in EUR futures fell -9 956 contracts to 77 190. NET LENGTH of GBP futures rose +4 180 contracts to 21 903.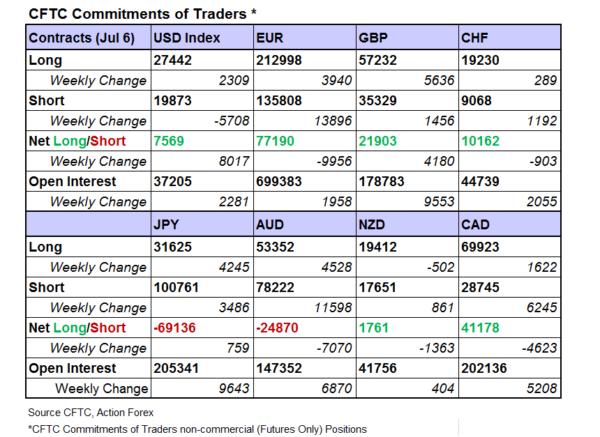
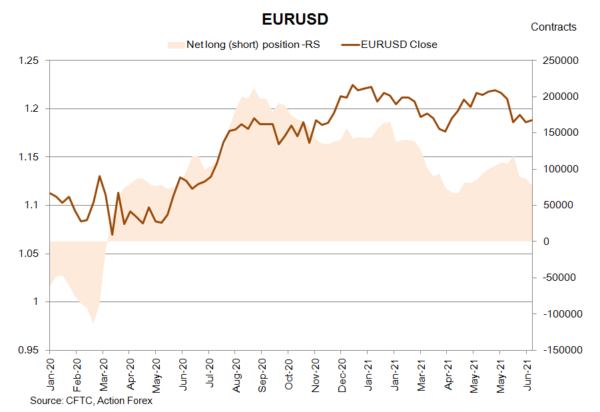
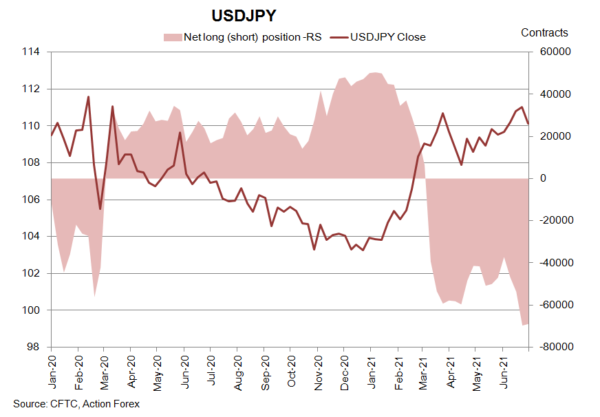
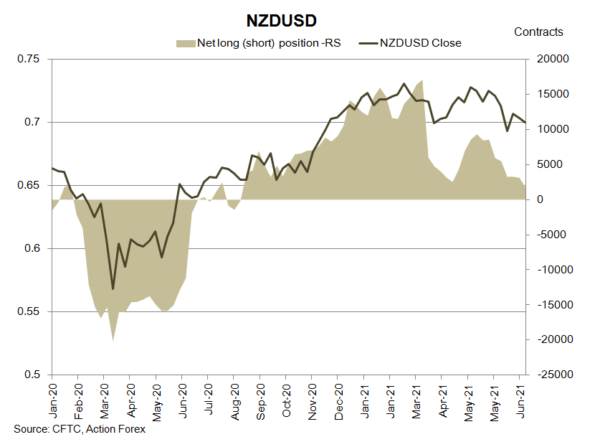
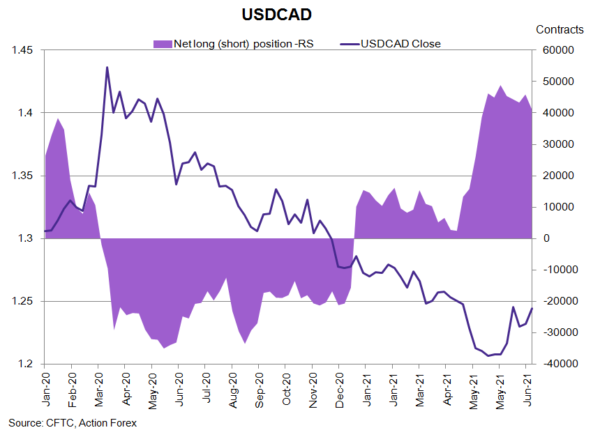
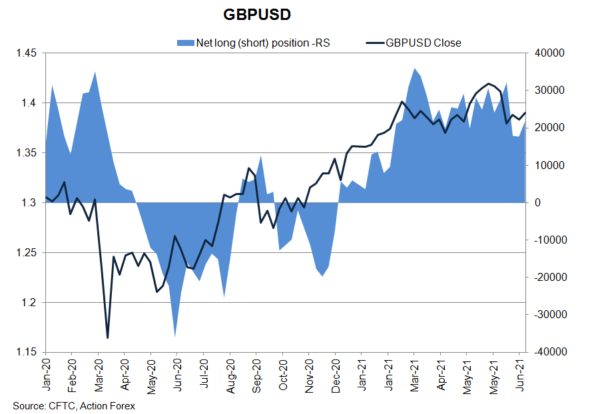 On safe-haven currencies, NET LENGTH of CHF futures slipped -903 contracts to 10 162 while NET SHORT of JPY futures dropped -759 contracts to 69 136. Concerning commodity currencies, NET SHORT of AUD futures increased +7 070 contracts to 24 870. Separately, NZD futures’ NET LENGTH slipped -1 363 contracts to 1 761. NET LENGTH of CAD futures dropped -4 623 contracts to 41 178 during the week.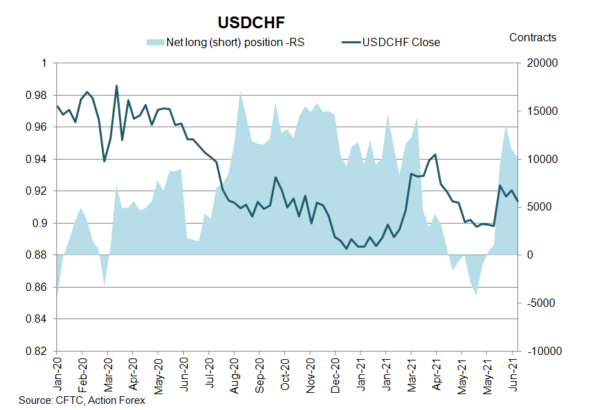
CFTC Commitments of Traders – Net Long Trimmed in Crude Oil Futures after Weeks of Price Rally
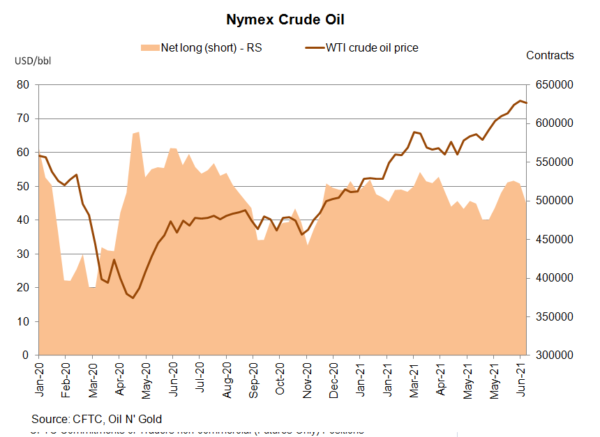
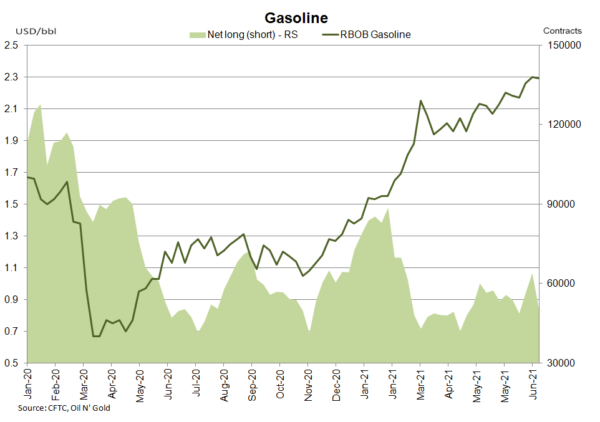
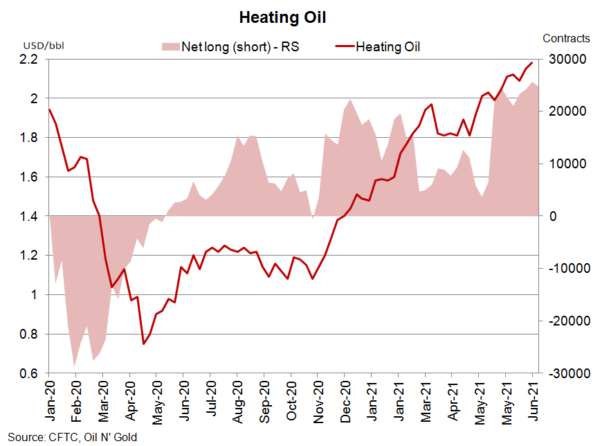
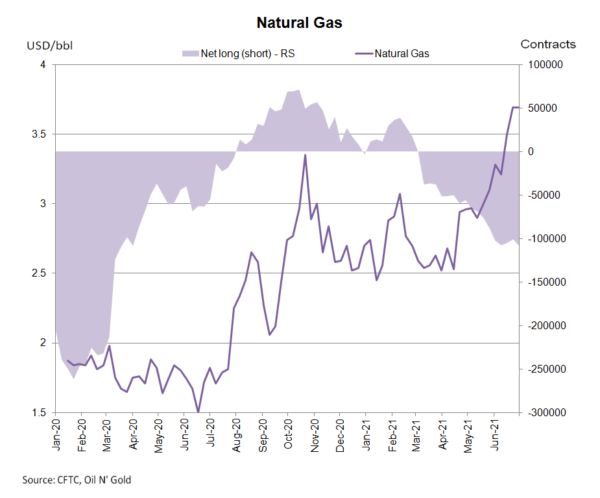
According to the CFTC Commitments of Traders report for the week ended July 6. NET LENGTH for crude oil futures slumped -25 139 contracts to 497 351 for the week. Speculative long position declined -24 799 contracts, while shorts added +340 contracts. For refined oil products, NET LENGTH for heating oil dropped 876 contracts to 24 821, while that for gasoline sank -13 442 contracts to 50 417. NET SHORT of natural gas futures rose 7 307 contracts to 108 054 during the week.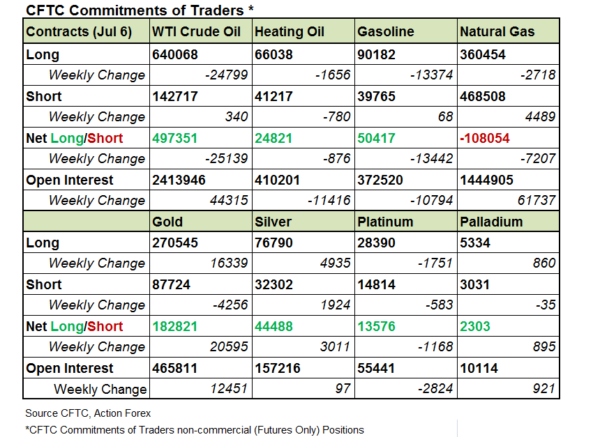
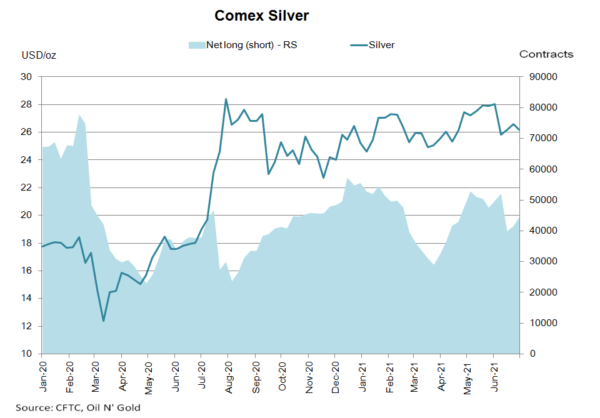
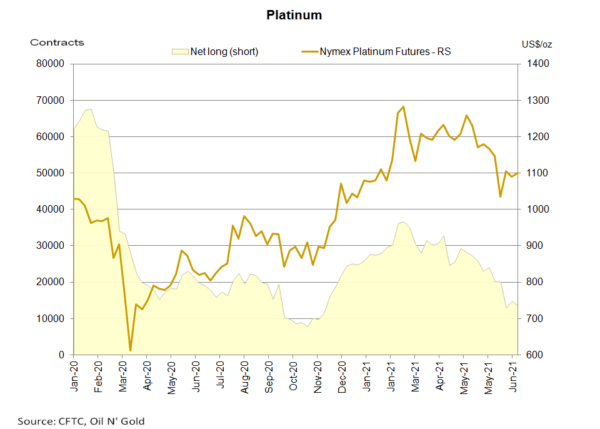
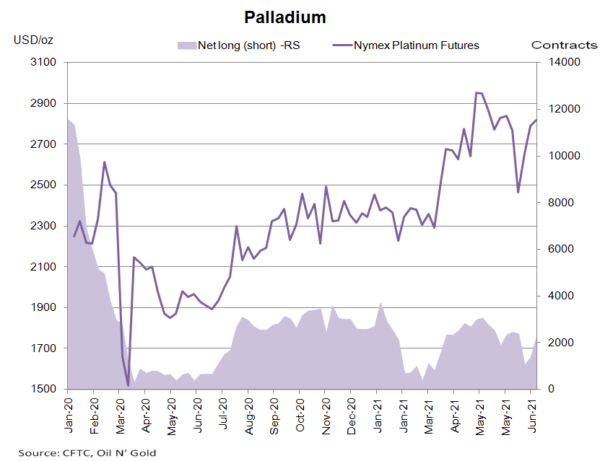
 Gold futures’ NET LENGTH jumped -20 595 contracts to 182 821 while silver futures’ NET LENGTH rose +3 011 contracts to 444 88. For PGMs, NET LENGTH of Nymex platinum futures dropped -1 168 contracts to 13 576 while that for palladium added +895 contracts to 2 303.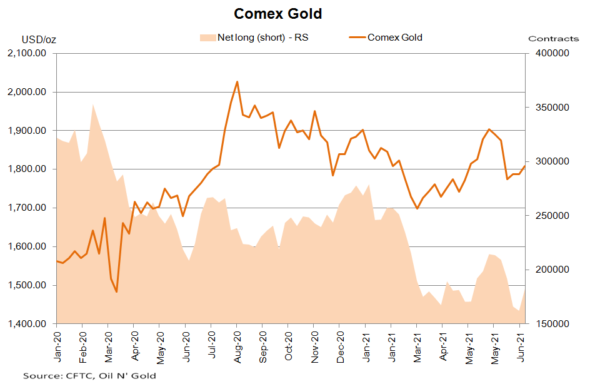
Eco Data 7/12/21
[php_everywhere instance="1"]
Forex and Cryptocurrencies Forecast
First, a review of last week's events:
EUR/USD. As predicted by the majority (65%) of experts, the dollar continued to weaken at the beginning of the week, and the EUR/USD pair went up. Disappointing data from the US labour market, released on July 02, affected the dollar. According to forecasts, the unemployment rate was supposed to fall from 5.8% to 5.7%, however, contrary to expectations, it rose to 5.9%.
The US business activity indicators released on Tuesday July 6 saved the American currency from further falling. And although the ISM index in the services sector fell to 60.1 in June (from a record 64 in May), this did not frighten investors, as a result above 50 is seen as positive and is in favor of the dollar. This is exactly what happened: having reached the height of 1.1895, the EUR/USD pair reversed and went down, reaching the local level at 1.1780 on Wednesday, July 07.
The minutes of the June meeting of the FRS, published at the end of the same day, showed that although curtailing financial and credit stimulation (QE) programs was discussed at it, it did not come to specific decisions. The regulator will still not rush to tighten monetary policy, relying only on inflation indicators, and will wait for the full recovery of the labor market. And on that end, as mentioned above, the indicators are not particularly optimistic at the moment, indicating a slowdown in the American economy.
The next day, Thursday, July 8, was the day when the euro was able to win back losses, not only because of the dovish position of the Fed, but also thanks to the publication of a new inflation target by the European Central Bank. Previously, the goal was to keep inflation "below but near 2%." Now, the official target level allows for exceeding or lagging the indicator at certain points in time. At the same time, the head of the ECB Christine Lagarde stressed that her bank will not copy the new strategy of the Fed and will not specifically stimulate the growth of consumer prices in order to reach the average.
The growth of the European currency and a decrease in global risk appetite caused by the spread of the delta strains of coronavirus helped. Carry traders began to close positions open on high-interest currencies in developing countries and return to fund currencies such as EUR and JPY.
As a result of all the fluctuations and changes in trends, the five-day total can be considered close to zero, the EUR/USD pair ended the weekly session almost the same as it started at 1.1877;
GBP/USD. The dynamics of the British pound against the dollar last week followed the movements of its European counterpart. The prediction given by the graphical analysis proved to be the most accurate, it indicated first the GBP/USD growth to 1.3870-1.3900 and then its lateral movement in 1.3730-1.3870 channel. In reality, adjusted for a few points, that's what happened. As for the last chord of the week, it sounded near the upper boundary of the channel, at 1.3890;
USD/JPY. The competition over which currency is the best refuge from financial storms continues. And the yen won it with a clear advantage last week, having outperformed the dollar by 100 points. As predicted by the vast majority of experts (75%), the pair moved purposefully south for the entire first half of the week, recording a local low on the horizon of 109.50 on July 07. At one point, thanks to flight from stock market of investors and falling US government bond yields, its superiority was as much as 150 points.
Then, against the backdrop of the recovery in the yield of US Treasuries to 1.3433%, the dollar was able to win back some losses, and the pair finished at 110.10;
cryptocurrencies. A poll by Morning Brew found that what retail crypto investors fear most is... Elon Musk's tweets. This was confirmed by another survey conducted by Investing.com. According to its results, one in five respondents who sold bitcoin in May 2021 associated this decision with Musk's criticism of the cryptocurrency.
To be sure, his tweets, like bans on cryptocurrency transactions in China, triggered the collapse, which saw bitcoin collapse from a height of $64,600 to $30,000. However, many experts believe that the main reason for what happened is the use of leverage in the crypto market, otherwise margin trading, which allows traders to open large positions with little funds. And it was the avalanche-like closing of such positions that led to a drop in quotations and a decrease of more than 45% in the total capitalization of the crypto market.
As for the Chinese authorities, they continue to squeeze virtual currencies out of the country. The People's Bank of China said bitcoin and stablecoins pose a threat to financial security and social stability and has banned the provision of a range of services to companies associated with the market, including software development, rental of premises and marketing services.
At the moment, large capital is watching the migration process of miners from the PRC. And the country in which they will resume their work is of particular interest. If it's going to be the US, it's likely to bolster the industry's image in the eyes of institutionals. Especially since Crypto Head estimates that of 76 countries, the United States is the best prepared for mass adoption of digital assets. However, it is believed that miners fear the US authorities no less than the Chinese. And therefore, they can choose the countries of Central Asia - Kazakhstan, Mongolia, etc., where there are territories with a cold climate and access to relatively cheap energy resources. Although not everything is so smooth here. For example, as we wrote, Kazakhstan had already passed a law on additional energy charges for cryptocurrencies in anticipation of miners.
Note that due to the bans introduced in China, the hash rate in the blockchain fell by almost 50%. This led to major changes in the complexity of the algorithm, and an equally serious increase in the profits of the remaining miners. They are now earning income, about the same as at BTC's $60,000 cost.
As for investors, they have been watching the main cryptocurrency trying to rise above the resistance of $ 36,000 for the third week. Another attempt by the bulls last week was unsuccessful again, and the BTC/USD pair was trading in the $32,500-33,500 zone by Friday night July 09.
The total crypto market capitalization has changed insignificantly over the week: from $1.358 trillion to $1.370 trillion. That being said, there has been a small flow of funds from altcoins (including ethereum) to bitcoin over the past few days. JP Morgan's analyst Nikolaos Panigirtsoglou also noted this in an interview with CNBC. This move has reversed a trend that began in April when there was a large inflow of funds into altcoins and could mean that the bear market for BTC is coming to an end. But it is clearly premature to talk about any serious progress. This is confirmed by quotes, capitalization volumes, and readings of the Crypto Fear & Greed Index, which is still in the Extreme Fear zone, having dropped by 1 point over the week, from 21 to 20.
As for the forecast for the coming week, summarizing the views of a number of experts, as well as forecasts made on the basis of a variety of methods of technical and graphical analysis, we can say the following:
EUR/USD. It seems that the epidemiological situation associated with the spread of new strains of COVID-19 is coming to the fore again. Risk cravings are falling and investors, fearing a repeat of last year's situation, are once again beginning to gravitate towards protective assets. Stock indices - Nasdaq, Dow Jones, S & P500 - stopped growing, going into a sideways trend. And impressive black candles appeared on their daily charts. In parallel, demand for U.S. Treasury liabilities rose: the yield on Treasuries fell to a new multi-month low, to 1.25%.
Despite the worsening epidemiological situation, the European Commission has raised its forecast for GDP growth in the Eurozone from 4.3% to 4.8% in 2021. The growth of economic activity should be influenced by the softening of quarantine measures (if it continues, of course) and the mass vaccination of the population. GDP is expected to return to pre-crisis levels as early as Q4 of this year, a quarter earlier than forecast, and this could prompt the ECB to start winding down QE programmes more quickly.
But if European inflation and GDP are growing by 2% and 4.8%, then the growth of similar American indicators is 5% and 7%, respectively. And who will start tightening monetary policy earlier, we wonder? Yes, the Fed has taken a wait-and-see, almost dovish position. But there are not so many hawks among the ECB's leadership, and its current position is more like a compromise between supporters of monetary expansion and their opponents.
Experts' opinion on the EUR/USD pair's immediate future can also be considered a compromise, with 40% in favour of growth, 45% in favour of falling, and 15% for continuing the side trend. At the same time, the number of supporters of a weaker dollar and a stronger euro rises to 60% when you move to the forecast by the end of summer.
Among the trend indicators and oscillators on H4, 70% are colored green, 30% - red. On D1, the situation is different: 70% of trend indicators look down, and the oscillator readings are a mixture of red, green and neutral gray. Graphical analysis on H4 indicates a sideways trend within the 1.1780-1.1900 channel.
The nearest target of the bulls is 1.1900, then 1.1975, 1.2000, 1.2050 and 1.2150. The challenge for July is to update the May 25 high of 1.2265. The bears' task is to test the March low of 1.1700. The supports on the way to this target are 1.1845, 1.1800 and 1.1780.
The following events can be noted in the economic calendar for the coming week. German and US consumer market data will be released on Tuesday July 13. US Federal Reserve Chief Jerome Powell is scheduled to speak in Congress on Wednesday and Thursday, and another set of US consumer data, including retail sales and the University of Michigan Consumer Confidence Index, will close the working week on Friday July 16;
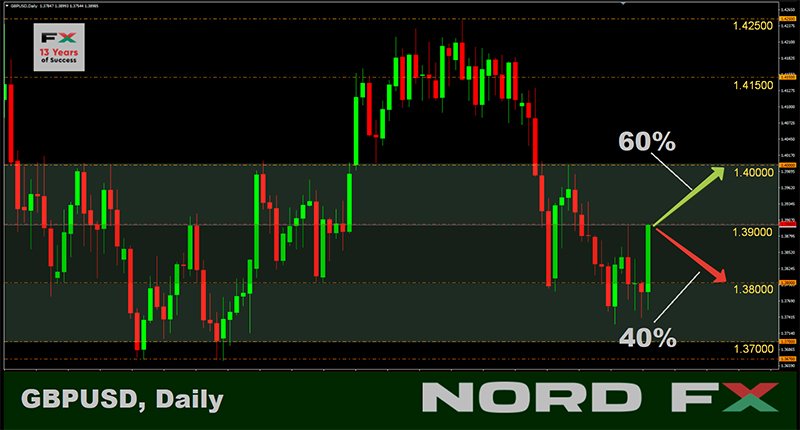
GBP/USD. The UK's GDP, trade and industrial production figures did not reach forecast values. And this will put some pressure on the pound. But despite this, 60% of analysts vote on the GBP/USD pair's move north.
It finished the last week, rising to the 1.3900 zone. The mid-term chart clearly shows that this level is in the central part of the 1.3700-1.4000 channel. Therefore, the pair has many chances to continue the upward movement to its upper border.
The remaining 40% of experts, in agreement with the graphical analysis on H4, believe that the British currency will not be able to break through the resistance of 1.3900 so far, including due to a new wave of COVID-19 spread in the country.
The indicators' readings are almost completely consistent with their readings for EUR/USD. In terms of macroeconomic statistics, the June Consumer Price Index (CPI) will be known on Wednesday 14 July, which is projected to rise from 2.1% to 2.2 per cent. And the next day, a portion of data on the state of the UK labour market, including claims for unemployment benefits and the country's unemployment rate, awaits us. Recall that a rise in the same indicator in the US hit the dollar on the first Friday in July. For the United Kingdom, it is expected to remain flat at 4.7%;
USD/JPY. It is almost impossible to bring the indicator readings for this pair to any denominator, neither on H4, nor on D1. Will it continue its upward trend, which began in early January? Will it be able to gain a foothold above 111.00? A new impetus to this movement was given after the correction on April 26, and only now the first hint of a trend breakdown and a breakout of the lower border of this channel has appeared.
We spoke above about the reasons for the strengthening of the yen last week. However, it is not possible to catch investor sentiment, as well as indicators, for the week ahead. The experts' voices are almost equally divided: 30% side with the bulls, 40% side with the bears, and 40% just shrug their shoulders.
Graphical analysis on D1 first indicates a sideways movement of the USD/JPY pair in the 109.50-111.00 trading range, and only then does it rule out the continuation of the uptrend and its breakout to 112.00.
The Bank of Japan's interest rate decision and the traditional subsequent press conference of its management may be of some interest the week ahead. Both of these events are scheduled for Friday July 16. And most likely, there will be no surprises for us, and Japan will once again reaffirm its title as an ultra-quiet haven for investors;
cryptocurrencies. Bitcoin's daily trading volume has dropped to its lowest level since early 2021, according to analyst firm Arcane Research. The BTC/USD pair is trying unsuccessfully to climb above the $36,000 horizon for the third week in a row. The fact that it has been trading near local lows since the end of May, of course, scares investors. A dip below the current low of $28,800 could lead to another massive sell-off and a new crypto winter.
At the same time, a number of experts interpret the current situation as a phase of accumulation according to the Wyckoff method. This means that $28,800 is the minimum of the correction ("Spring"), and a stepwise growth should be expected in the future. Wyckoff's scheme will be confirmed if bitcoin fixes above the $36,000 resistance.
- Popular cryptanalyst PlanB (609,000 subscribers) outlined the worst scenario of the main cryptocurrency movement. This expert is known for applying to bitcoin the stock-to-flow ratio (S2F) model, previously traditionally applied to commodities such as gold and silver. According to PlanB's calculations, the worst-case scenario for bitcoin in July is closing the month at $28,000. In August, this is where the worst-case closing scenario could be $47,000. According to him, the next six months will determine whether, by the end of the bull race, BTC will actually be able to reach the six-digit range and, as a result, reach the $288,000 mark.
It should be noted that the forecasts of the institutions look much more modest. For example, CNBC conducted a Wall Street survey of nearly 100 investment directors, financial strategists and portfolio managers. 44% of them believe that bitcoin will close 2021 with a price below $30,000. 25% of respondents believe that the rate of the first cryptocurrency at that time will reach $40,000. A similar proportion of respondents chose the $50,000 level, with only 6% predicting a rise to $60,000.
Discussing the results, the channel's hosts agreed with the short-term outlook in general, noting that even $30,000 for the end of the year would alleviate many of the concerns of market participants by setting a long-term bottom.
While assessing altcoin prospects, many experts, including Galaxy Digital cryptocurrency bank founder Michael Novogratz, say that Ethereum may well weaken bitcoin in the future and become the foundation for pricing in the market. BTC became popular as a means of saving. But if you sum up the number of projects and directions working on the ETH blockchain, the advantage of Ethereum becomes obvious. Stablecoins, De-Fi, and NFT tokens work on its blockchain. The ETH platform has the potential to become the foundation for the upcoming Web 3.0. However, there is one issue: Ethereum is facing stiff competition from Solana, Terra and other ecosystems in this direction.
Experts from Goldman Sachs, one of the largest investment banks, also believe that today ethereum is the cryptocurrency with the highest real use potential that can overtake bitcoin. But at the same time, the bank's experts are also confident that neither bitcoin, nor ethereum, nor any other cryptocurrency will overtake gold in popularity in the near future. Because of its high volatility, digital assets cannot be accepted as a safe haven by investors, and therefore lose out in direct competition with this precious metal.
EUR/USD Weekly Outlook
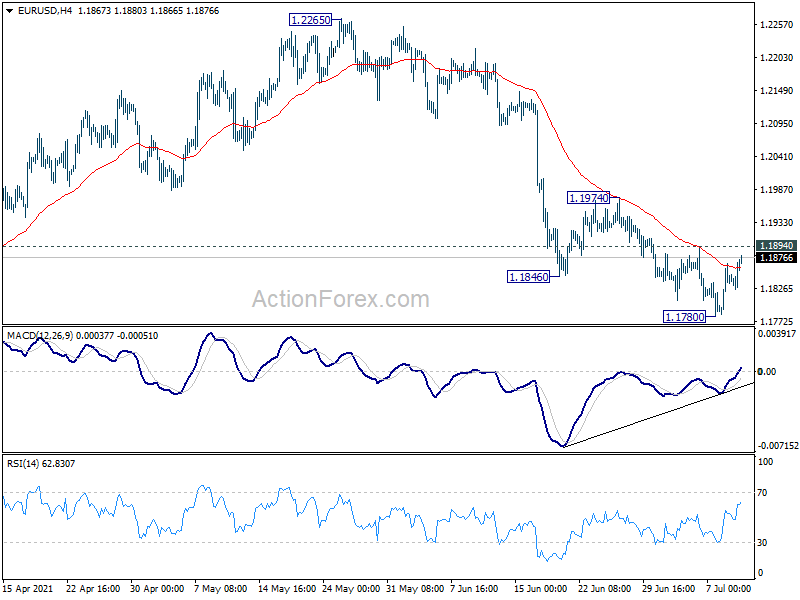
EUR/USD's decline from 1.2265 extended to as low as 1.1780 last week but recovered again. Initial bias remains neutral this week first. Break of 1.1780 will bring another decline, to extend the corrective pattern from 1.2348, to retest 1.1703 support. However, considering bullish convergence condition in 4 hour MACD. Break of 1.1894 minor resistance will indicate short term bottoming. Intraday bias will be turned back to the upside for 1.1974 resistance first. Sustained break there will pave the way back to 1.2265/2348 resistance zone.
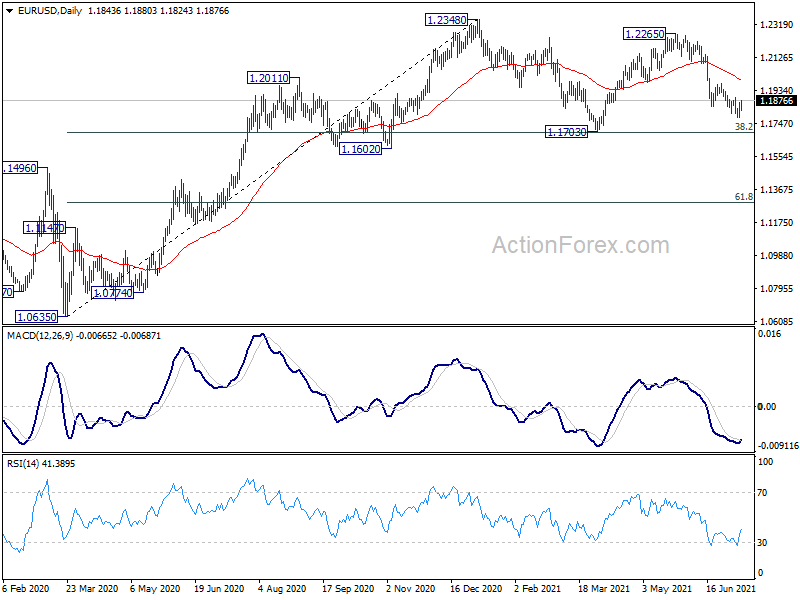
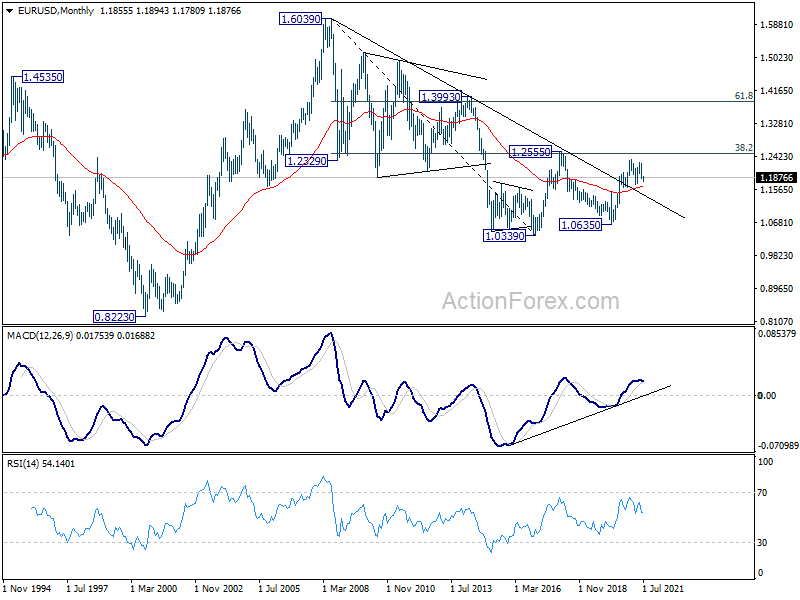
In the bigger picture, rise from 1.0635 is seen as the third leg of the pattern from 1.0339 (2017 low). Further rally could be seen to cluster resistance at 1.2555 next, (38.2% retracement of 1.6039 to 1.0339 at 1.2516). This will remain the favored case as long as 1.1602 support holds. Reaction from 1.2555 should reveal underlying long term momentum in the pair. However sustained break of 1.1602 will argue that the rise from 1.0635 is over, and turn medium term outlook bearish again.
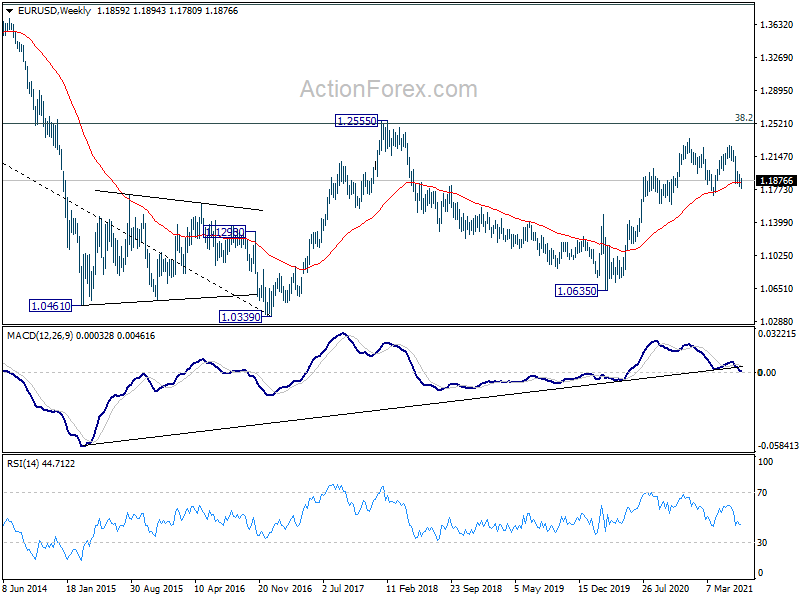
In the long term picture, focus remains on 1.2555 cluster resistance (38.2% retracement of 1.6039 to 1.0339 at 1.2516). Sustained break there should confirm long term bullish reversal and target 61.8% retracement at 1.3862 and above. However, rejection by 1.2555 will keep medium term outlook neutral first, and raise the prospect of down trend resumption at a later stage.
USD/JPY Weekly Outlook
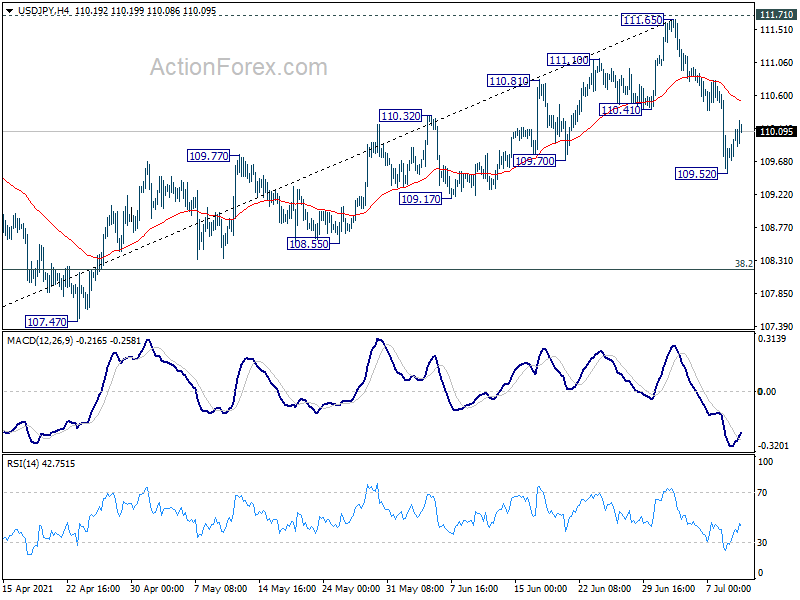
USD/JPY dropped sharply to as low as 109.52 last week but recovered since then. Initial bias is neutral this week first. On the downside, sustained trading below 55 day EMA (now at 109.78) will suggests that it's at least correcting the rise from 102..58. Deeper fall would be seen to 38.2% retracement of 102.58 to 111.65 at 108.18. For now, risk will stay on the downside as long as 111.65 resistance holds, in case of recovery.
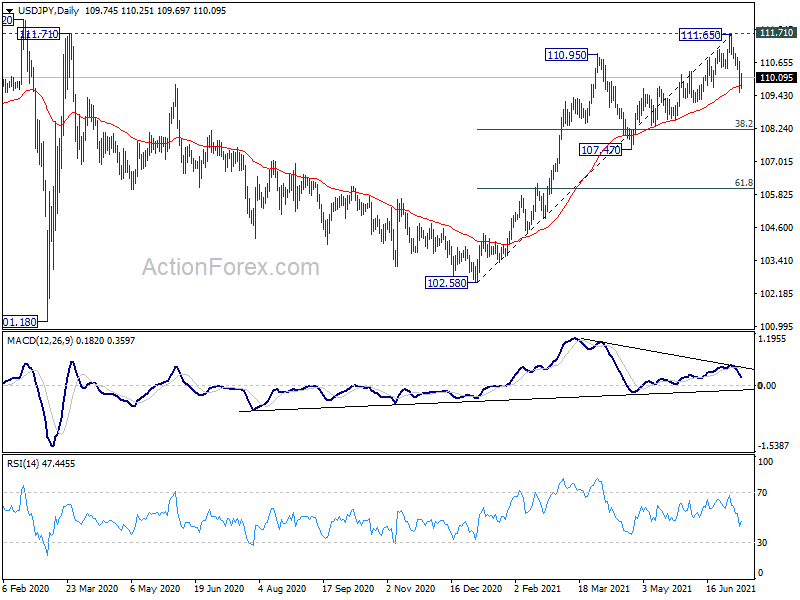
In the bigger picture, medium term outlook is staying neutral with 111.71 resistance intact. Though, as notable support was seen from 55 day EMA, rise from 102.58 is mildly in favor to extend higher. Decisive break of 111.71/112.22 resistance will suggest long term bullish reversal. Rise from 101.18 could then target 118.65 resistance (Dec 2016) and above. However, sustained break of 55 day EMA would revive some medium term bearishness, and open up deep fall back towards 102.58 support.
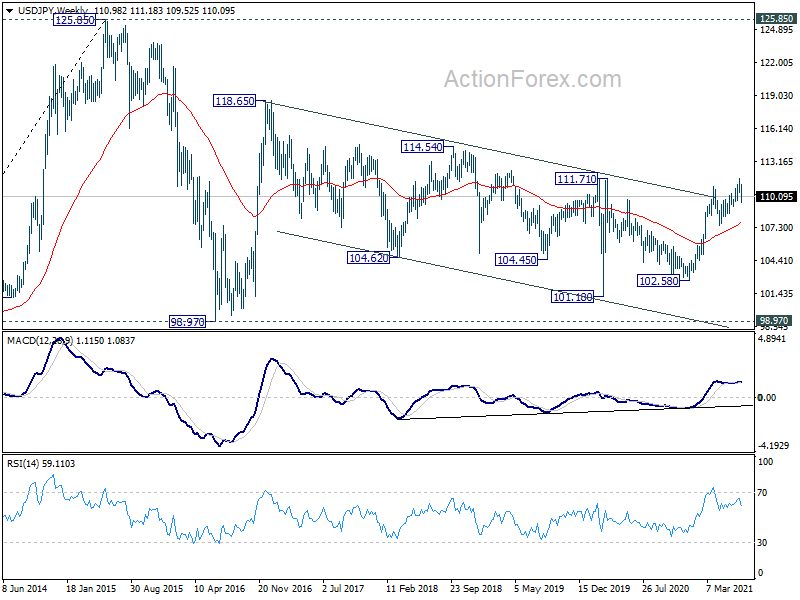
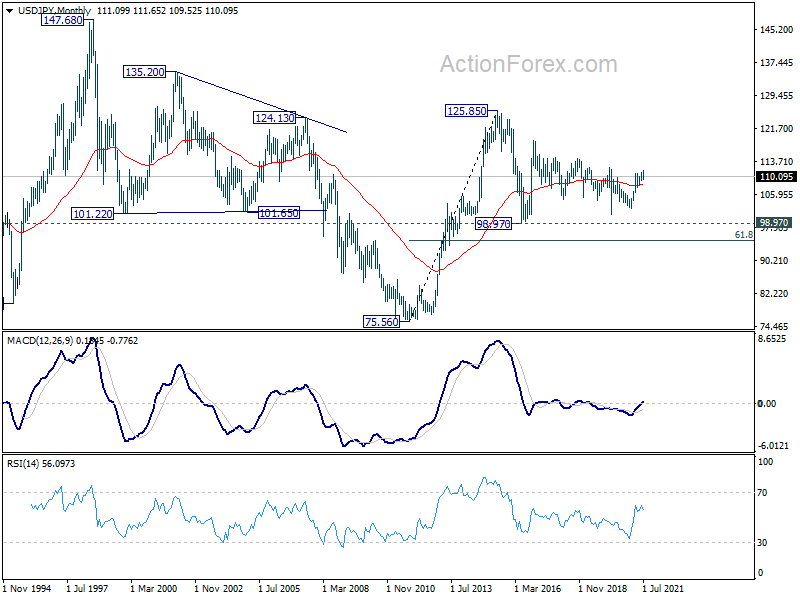
In the long term picture, the rise from 75.56 (2011 low) long term bottom to 125.85 (2015 high) is viewed as an impulsive move, no change in this view. Price actions from 125.85 are seen as a corrective pattern which could still extend. In case of deeper fall, downside should be contained by 61.8% retracement of 75.56 to 125.85 at 94.77. Up trend from 75.56 is expected to resume at a later stage for above 135.20/147.68 resistance zone.
GBP/USD Weekly Outlook
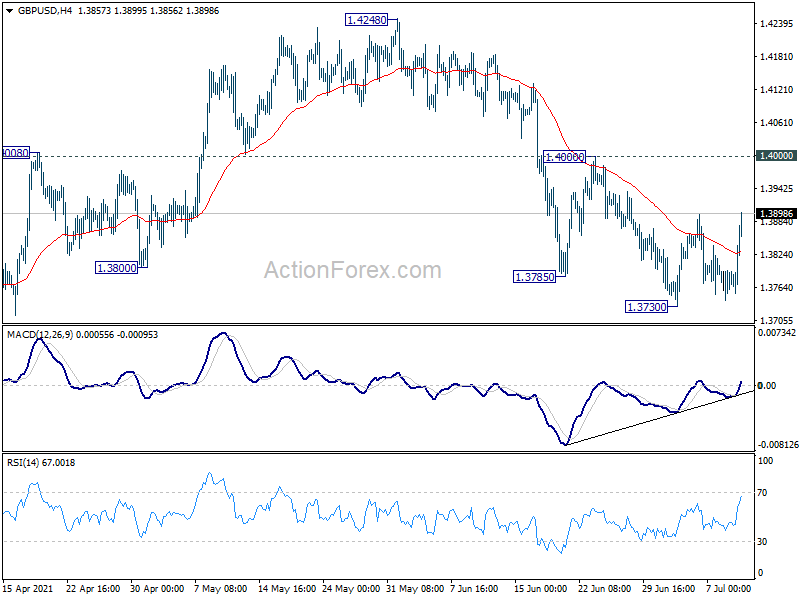
GBP/USD stayed in range above 1.3730 last week and outlook is unchanged. Initial bias remains neutral this week first. Break of 1.3730 will resume the fall from 1.4248, as the third leg of the consolidation pattern from 1.4240, to 1.3668 support and possibly below. On the upside, break of 1.4000 will turn bias back to the upside for retesting 1.4240/8 resistance zone instead.
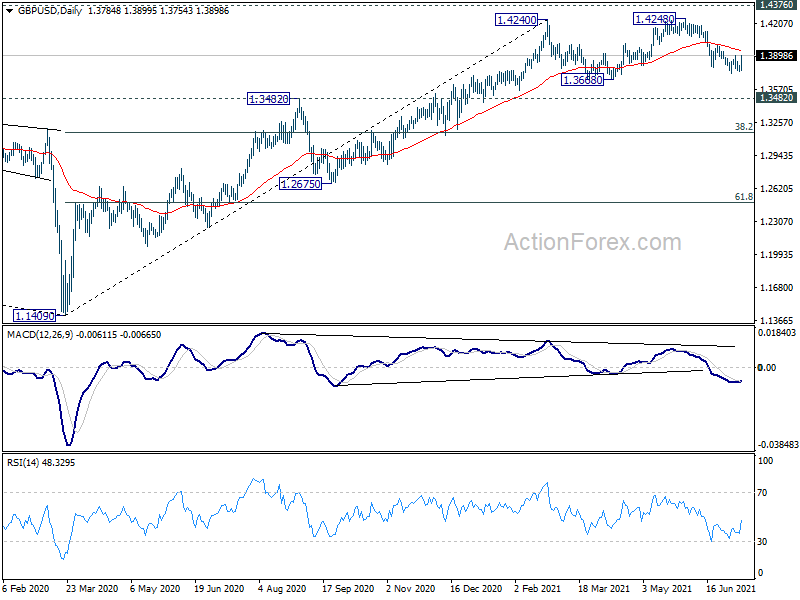
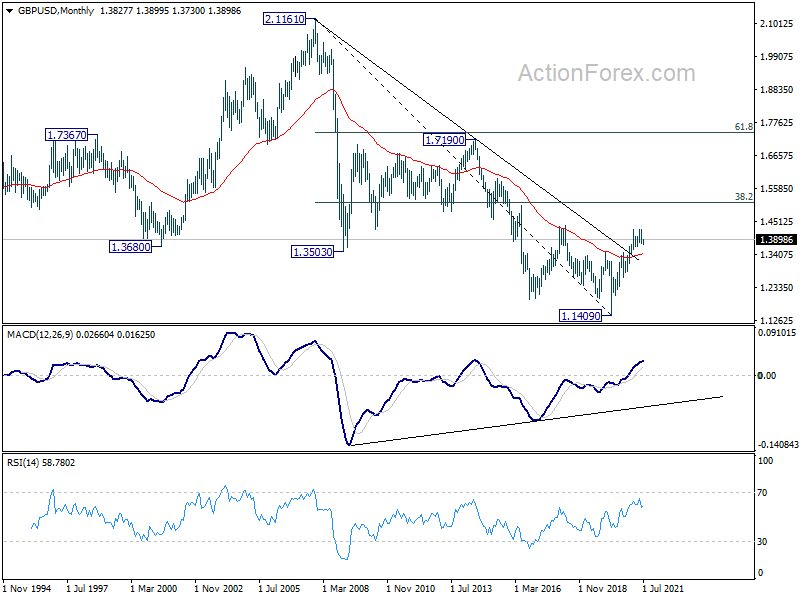
In the bigger picture, as long as 1.3482 resistance turned support holds, up trend from 1.1409 should still continue. Decisive break of 1.4376 resistance will carry larger bullish implications and target 38.2% retracement of 2.1161 (2007 high) to 1.1409 (2020 low) at 1.5134. However, firm break of 1.3482 support will argue that the rise from 1.1409 has completed and bring deeper fall to 1.2675 support and below.
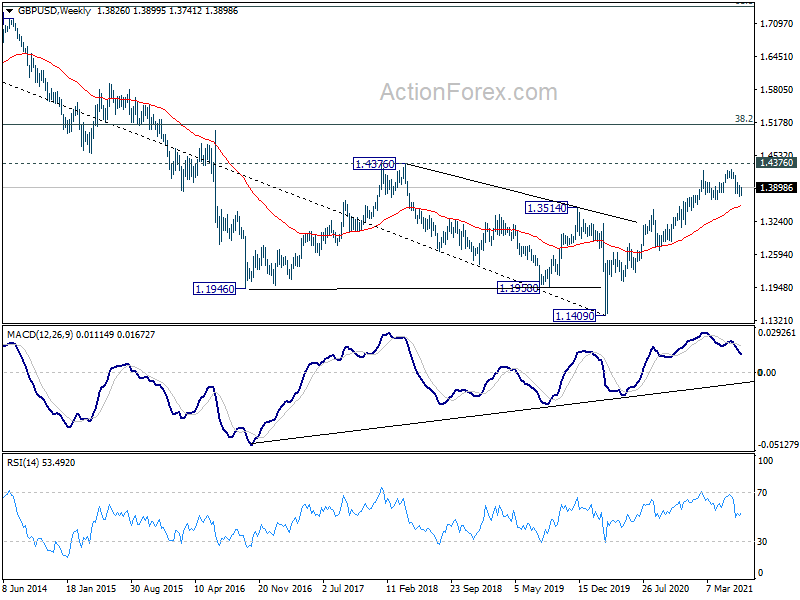
In the longer term picture, a long term bottom should be in place at 1.1409, on bullish convergence condition in monthly MACD. Rise from there would target 38.2% retracement of 2.1161 to 1.1409 at 1.5134. Reaction from there would reveal whether rise from 1.1409 is just a correction, or developing into a long term up trend.
USD/CHF Weekly Outlook
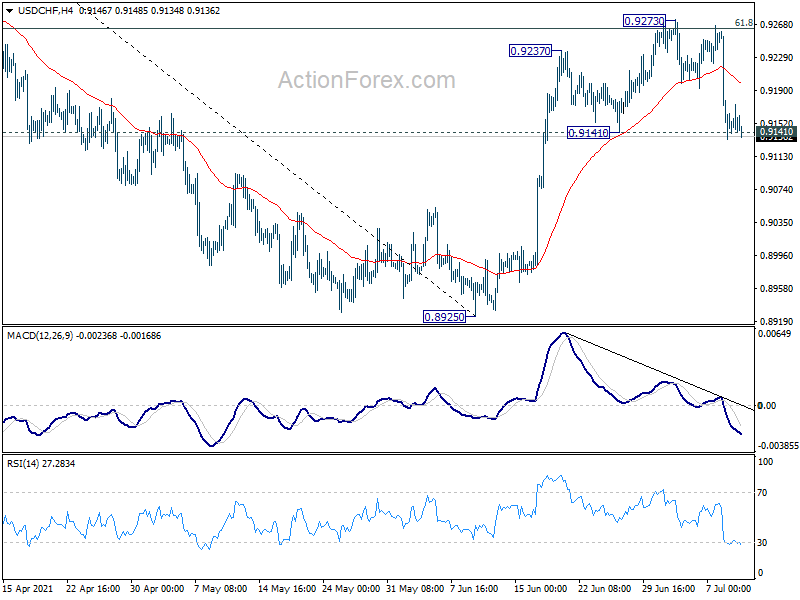
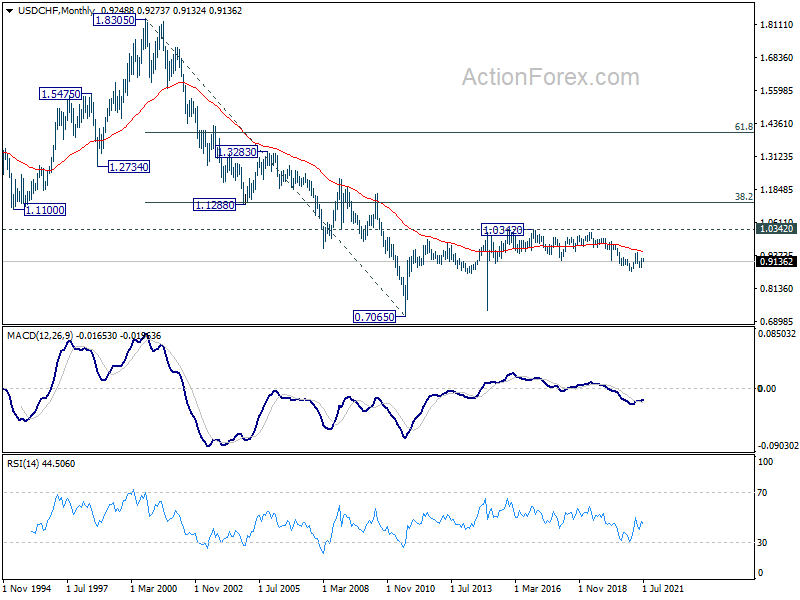
USD/CHF dropped notably last week and the breach of 0.9141 support argues that rebound from 0.8925 has completed at 0.9273 already, after rejection by 61.8% retracement of 0.9471 to 0.8925 at 0.9262. Initial bias is mildly on the downside this week for 55 day EMA (now at 0.9119) first. Sustained break there will pave the way back to retest 0.8925 low. For now, risk will stay on the downside as long as 0.9273 resistance holds, in case of recovery.
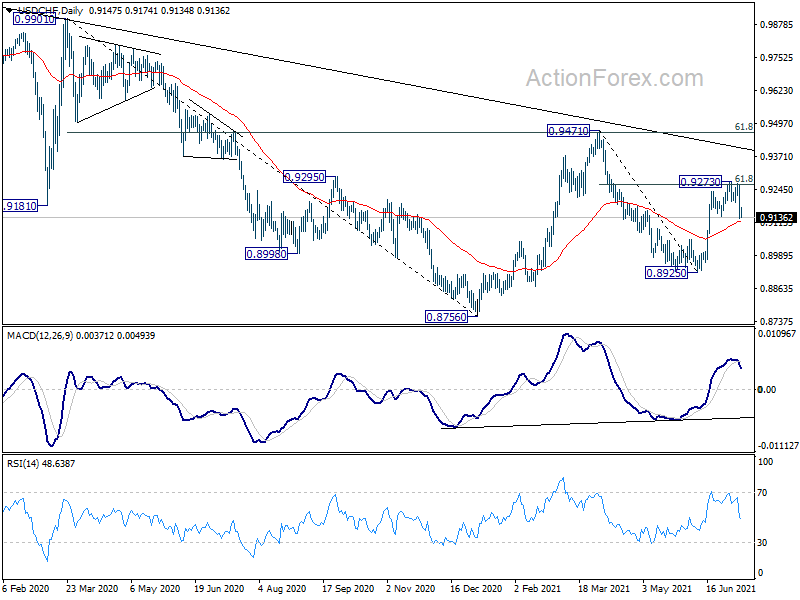
In the bigger picture, medium term outlook is currently neutral with focus on 0.9471 resistance. Sustained break there will indicate completion of whole decline from 1.0342 (2016 high). Medium term outlook will be turned bullish for a test on 1.0342 high. But, rejection by 0.9471 again will revive bearishness for another fall through 0.8756 low.
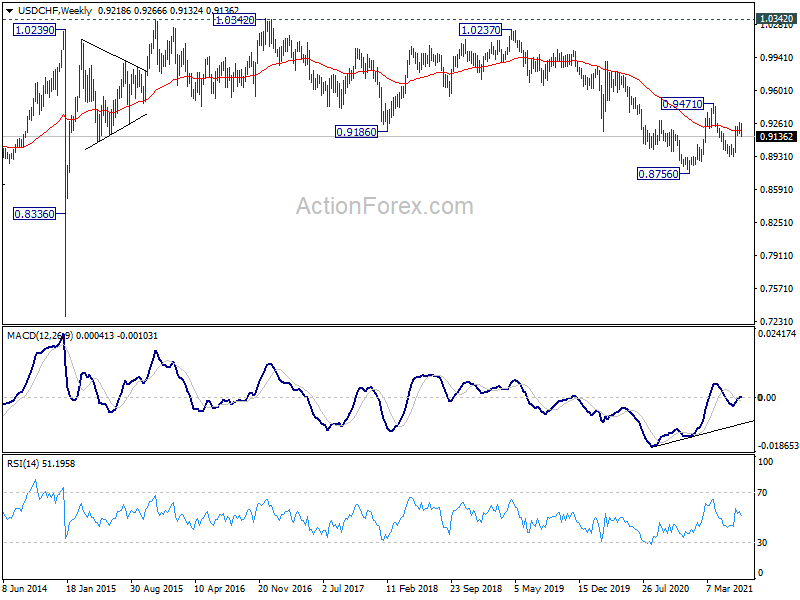
In the long term picture, price actions from 0.7065 (2011 low) are currently seen as developing into a long term corrective pattern, at least until a firm break of 1.0342 resistance.
AUD/USD Weekly Outlook
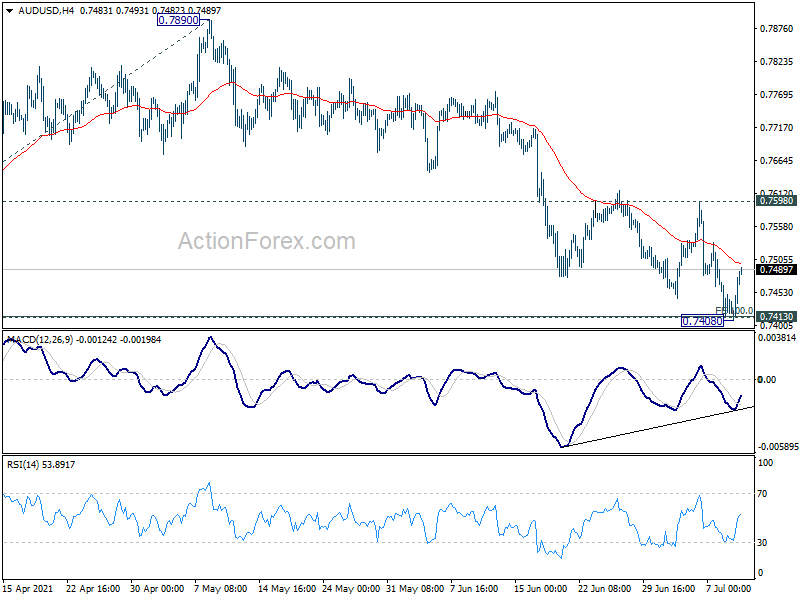
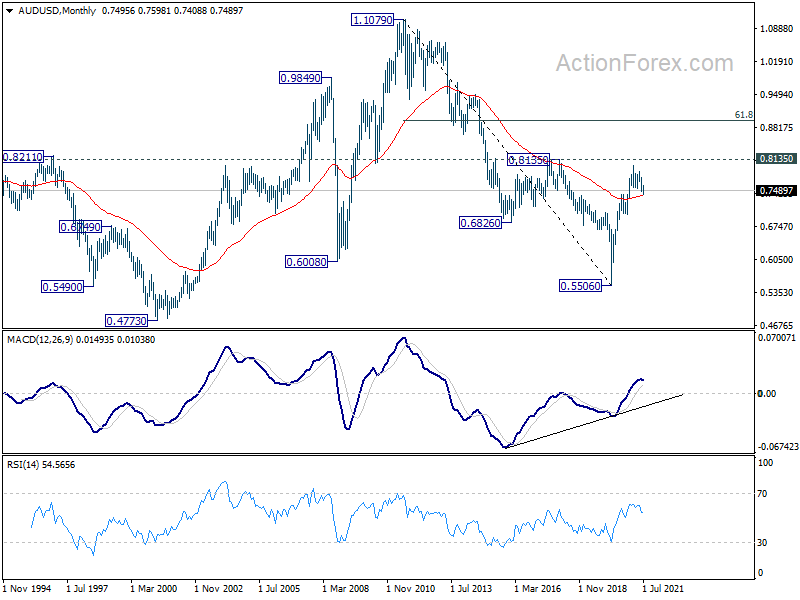
AUD/USD's corrective fall from 0.8006 resumed last week and reached 0.7408. But as a temporary low was formed, initial bias is neutral this week first. At this point, we'd continue to expect strong support from 100% projection of 0.8006 to 0.7530 from 0.7890 at 0.7414 to complete the correction. Break of 0.7589 will turn bias back to the upside for 0.7890 resistance first. However, sustained break of 0.7414 will argue it's at least in larger scale correction, and target 161.8% projection of 0.8006 to 0.7530 from 0.7890 at 0.7120 next.
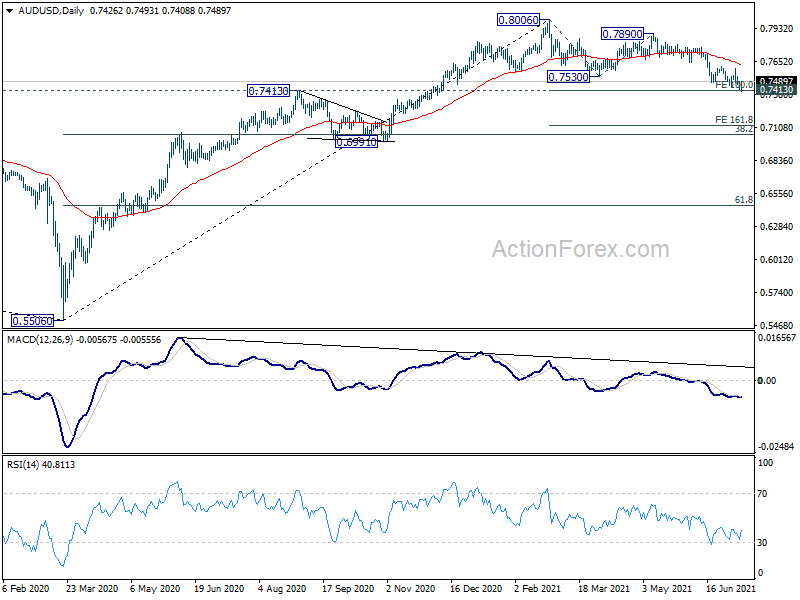
In the bigger picture, rise from 0.5506 medium term bottom could either be the start of a long term up trend, or a corrective rise. Reactions to 0.8135 key resistance will reveal which case it is. Rejection by 0.8135 key resistance, followed by firm break of 0.7413 resistance turned support, will favor the latter case. Deeper decline would be seen to 38.2% retracement of 0.5506 to 0.8006 at 0.7051 first.
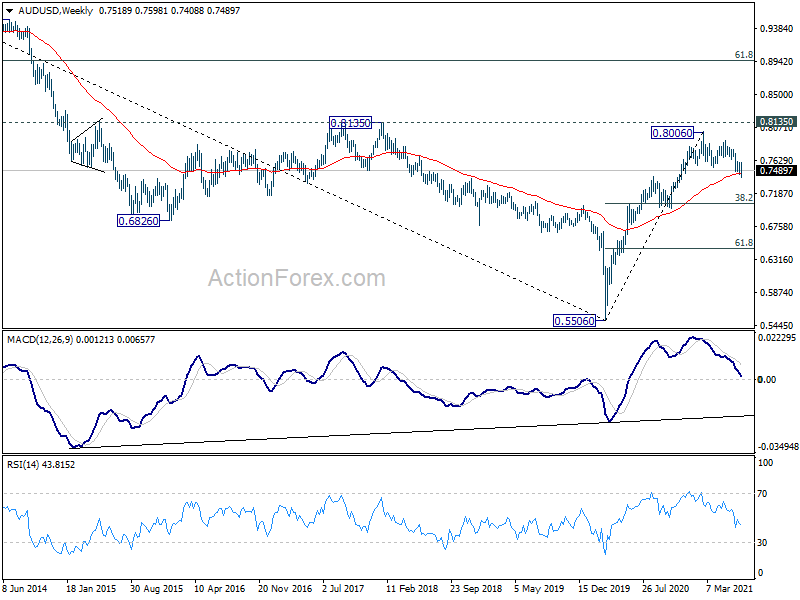
In the longer term picture, 0.5506 is a long term bottom, on bullish convergence condition in monthly MACD. Focus is now back on 0.8135 structural resistance. Decisive break there will raise the chance that rise from 0.5506 is an impulsive up trend. Next target should be 61.8% retracement at 0.8950 of 1.1079 to 0.5506 and above. Though, rejection by 0.8135 will keep the case of medium to long term sideway consolidation open.
USD/CAD Weekly Outlook
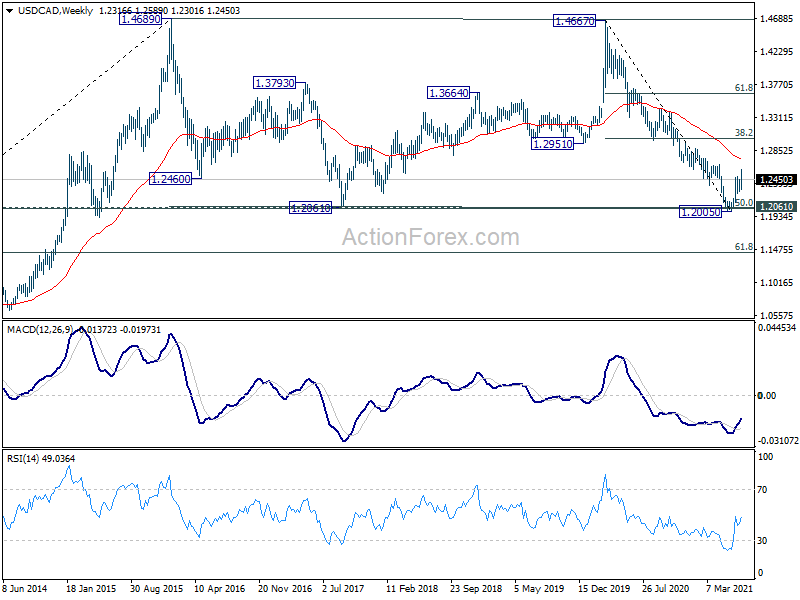
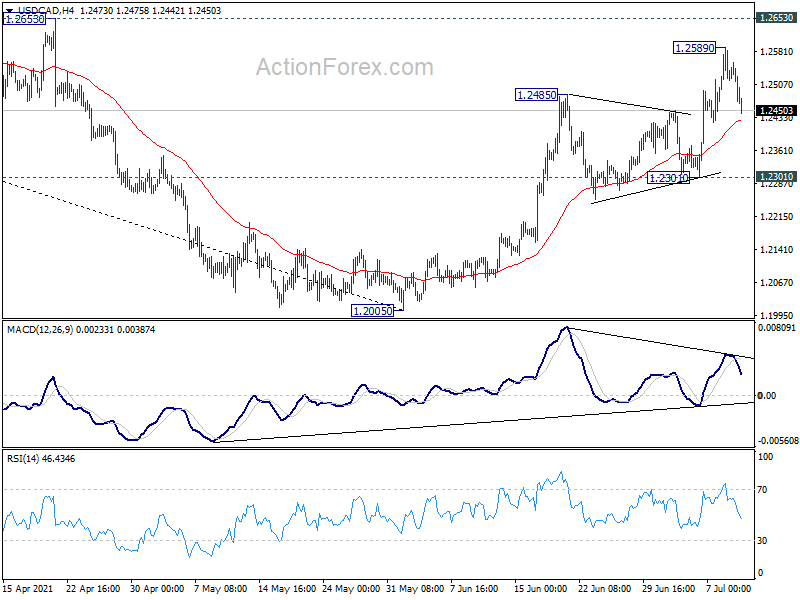
USD/CAD's rebound from 1.2005 resumed last week and hit as high as 1.2589. But a temporary top was formed there and initial bias is turned neutral this week first. The break of medium term channel resistance is a sign of reversal. Further rise is in favor as long as 1.2301 support holds. Above 1.2589 will target 1.2653 structural resistance. However, break of 1.2301 support will dampen the bullish case and turn bias back to the downside for 1.2005 low instead.
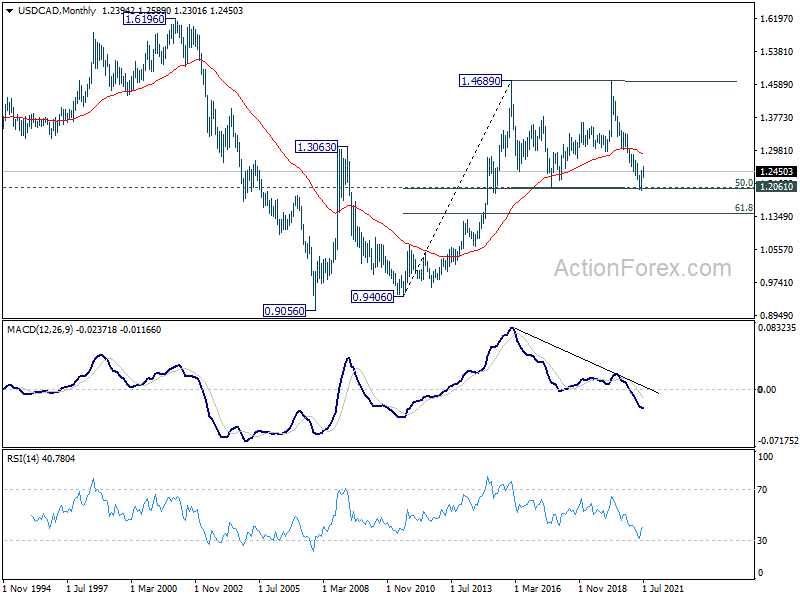
In the bigger picture, fall from 1.4667 is seen as the third leg of the corrective pattern from 1.4689 (2016 high). It might have completed after hitting 1.2061 (2017 low) and 50% retracement of 0.9406 to 1.4689 at 1.2048. Sustained break of 38.2% retracement of 1.4667 to 1.2005 at 1.3022 will pave the way to 61.8% retracement at 1.3650. Overall, medium term outlook remains neutral at worst with 1.2048/61 support zone intact.
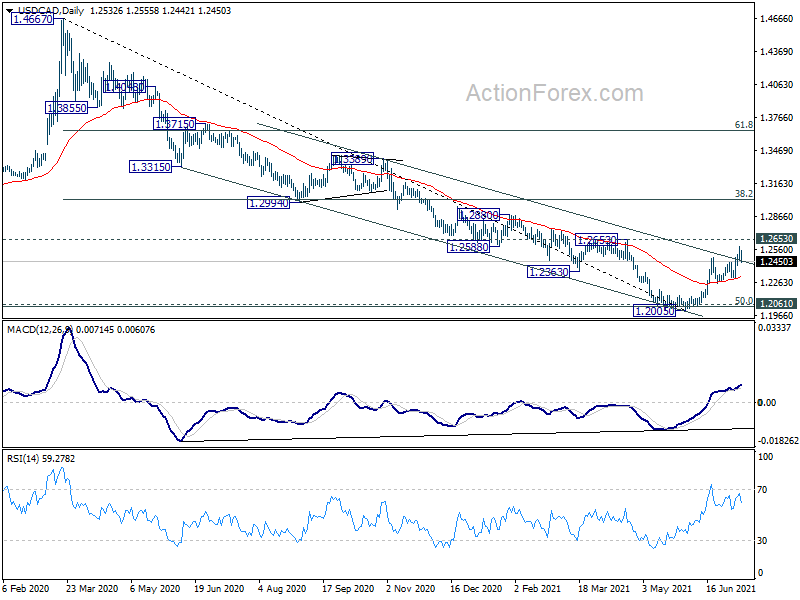
In the longer term picture, we're viewing price actions from 1.4689 as a consolidation pattern. Thus, up trend from 0.9506 (2007 low) is still expected to resume at a later stage. This will remain the favored case as long as 1.2061 support holds, which is close to 50% retracement of 0.9406 to 1.4689 at 1.2048. However, sustained break of 1.2061 will be a sign of long term bearishness. Deeper fall would be seen to 61.8% retracement at 1.1424 and below.