Sample Category Title
USD/JPY Technical Analysis: Retreats Below 50-MA, Upside Risks Under Strain
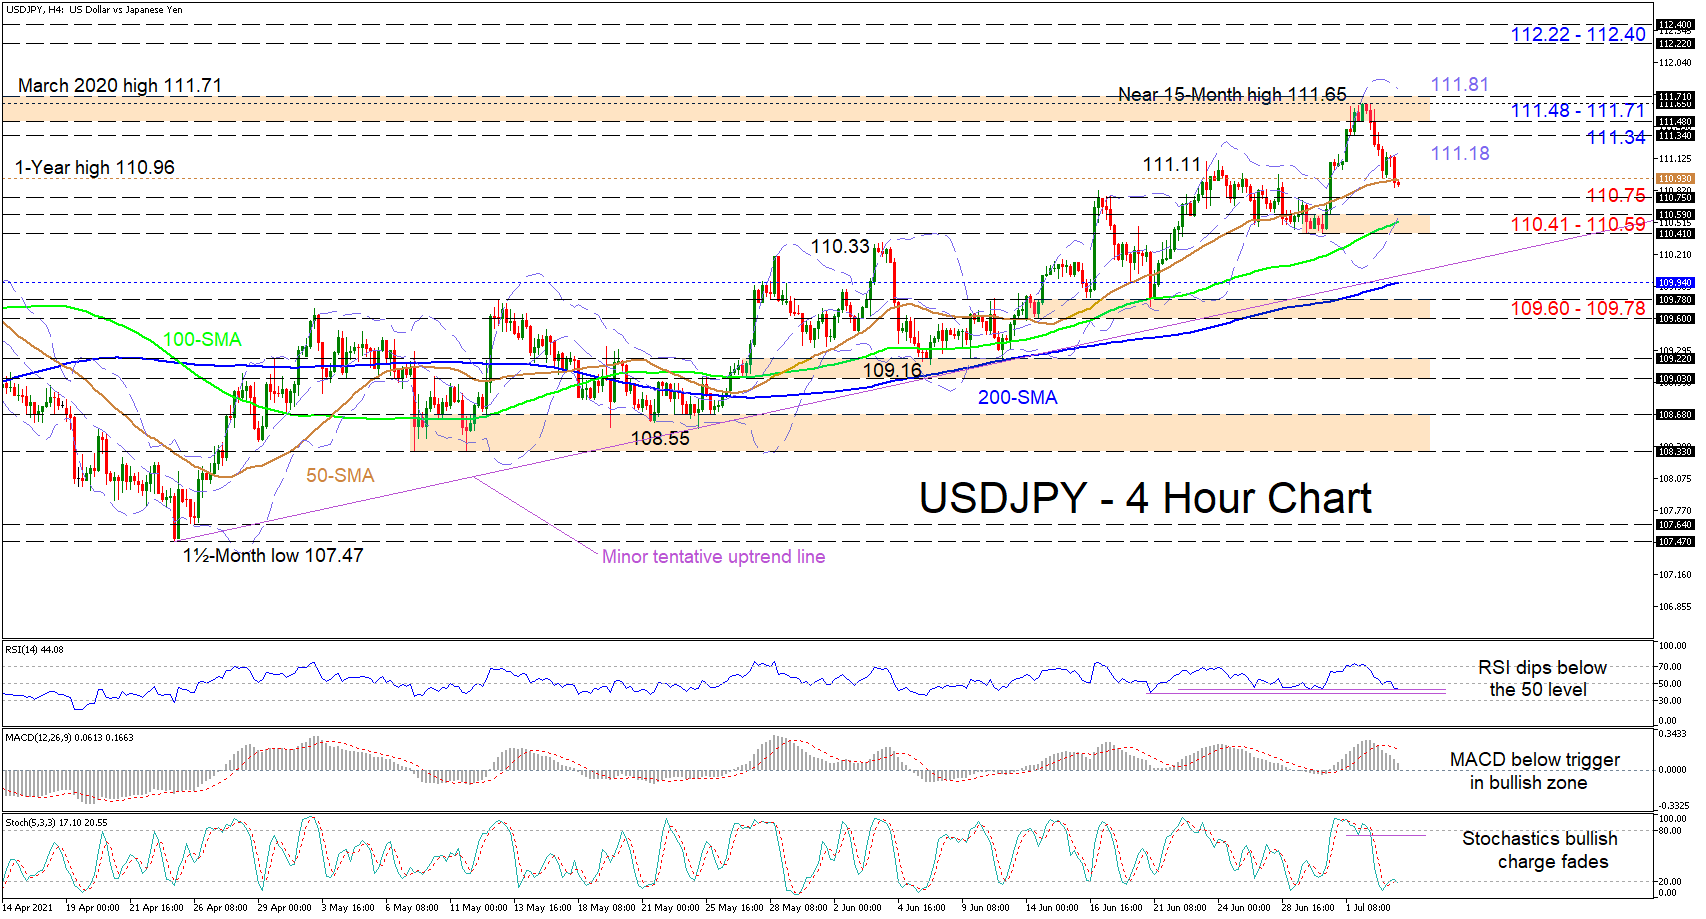
USDJPY has lost its recent footing off the 50-period simple moving average (SMA), as buyers’ latest efforts have become curbed by the mid-Bollinger band at 111.18. Nonetheless, the advancing SMAs are defending the near-term uptrend that evolved from the April 23 trough of 107.47.
The short-term oscillators are transmitting conflicting signals in directional momentum and convincing negative pressures have yet to gain an advantage, despite the pullback from the near 15-month peak of 111.65. The MACD continues to dive beneath its red trigger line, which is still deep in the positive region, while the RSI is struggling to dip past support levels below the 50 threshold. That said, the stochastic oscillator is flirting with the 20 level and has yet to fully confirm a clear price impulse.
If the pair deteriorates beneath the 50-period SMA at 110.93, sellers may meet preliminary friction at the 110.75 obstacle before the spotlight shifts to the support section of 110.41-110.59. Should this base, which encapsulates the lower Bollinger band and the 100-period SMA, break down, the minor uptrend line, pulled from the 107.47 low, and the trailing 200-period SMA, currently at 109.94, could quickly be challenged. In the event that negative pressures defeat these tough diagonal constraints, the price may then sink towards the 109.60-109.78 support boundary.
If the pair regains upside momentum, an initial barricade may arise from the mid-Bollinger band around 111.18 ahead of the 111.34 obstacle. Buyers may then need to assemble a substantial amount of orders to tackle the durable resistance region of 111.48-111.71, the latter being the March 2020 rally high. Should buyers conquer this ceiling, which is fortified by the near 15-month high of 111.65 and the upper Bollinger band overhead at 111.81, they may catapult the price to a zone of resistance formed between the 112.22 and 112.40 rally peaks, from February 2020 and April 2019.
Summarizing, USDJPY seems to be lacking positive drive after the retracement from the recent high. However, the near-term bullish tone has yet to be overturned as the price persists above the 110.41-110.59 base and the tentative uptrend line.
EUR/USD Managed To Rise A Bit
The major currency pair is starting another week of July with a slight growth and trading at 1.1858.
Earlier, the “greenback” couldn’t achieve its potential and strengthen due to the long weekend and some controversial statistics on the US labor market. For example, the Non-Farm Employment Change showed 850K in June after being 583K in May. It’s good news. However, this is where the good news ended. The Unemployment Rate rose from 5.8% in May to 5.9% in June.
Apart from that, the Average Hourly Earnings showed 0.3% m/m in June, which is worse than the previous reading of 0.4% m/m.
Later, there was some positive news from the United States Department of Commerce, according to which the Factory Orders added 1.7% m/m in May after losing 0.1% m/m the month before. On YoY, the indicator expanded by 17.2%.
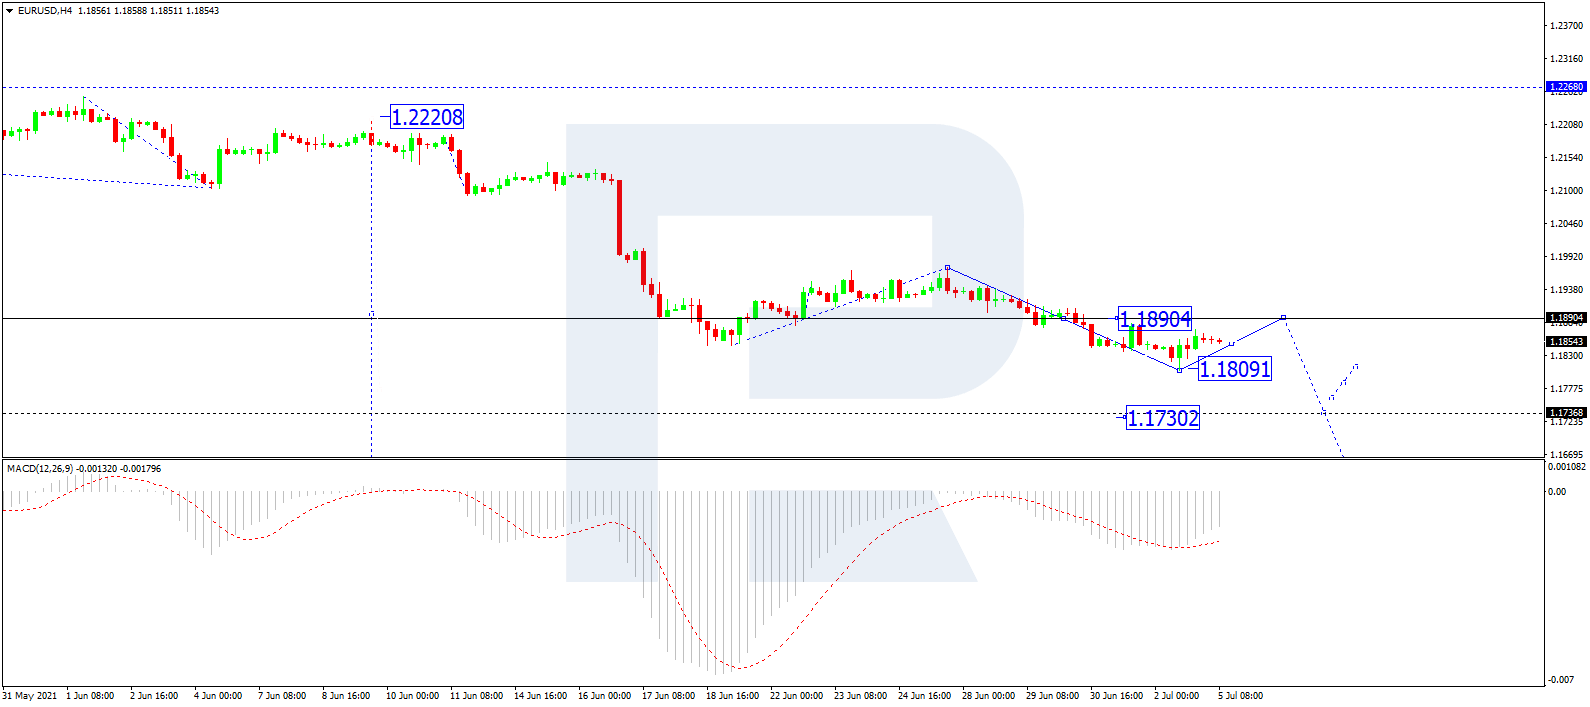
In the H4 chart, after finishing the descending wave at 1.1809, EUR/USD has formed a new consolidation range around 1.1888, which may be considered as the center of the third descending wave towards 1.1600. Today, the pair may correct to test 1.1890 from below and then resume trading within the downtrend to break 1.1777. After that, the instrument may continue falling with the short-term target at 1.1700. From the technical point of view, this scenario is confirmed by MACD Oscillator: its signal line is trading below 0 outside the histogram area, thus confirming an ascending structure on the price chart.
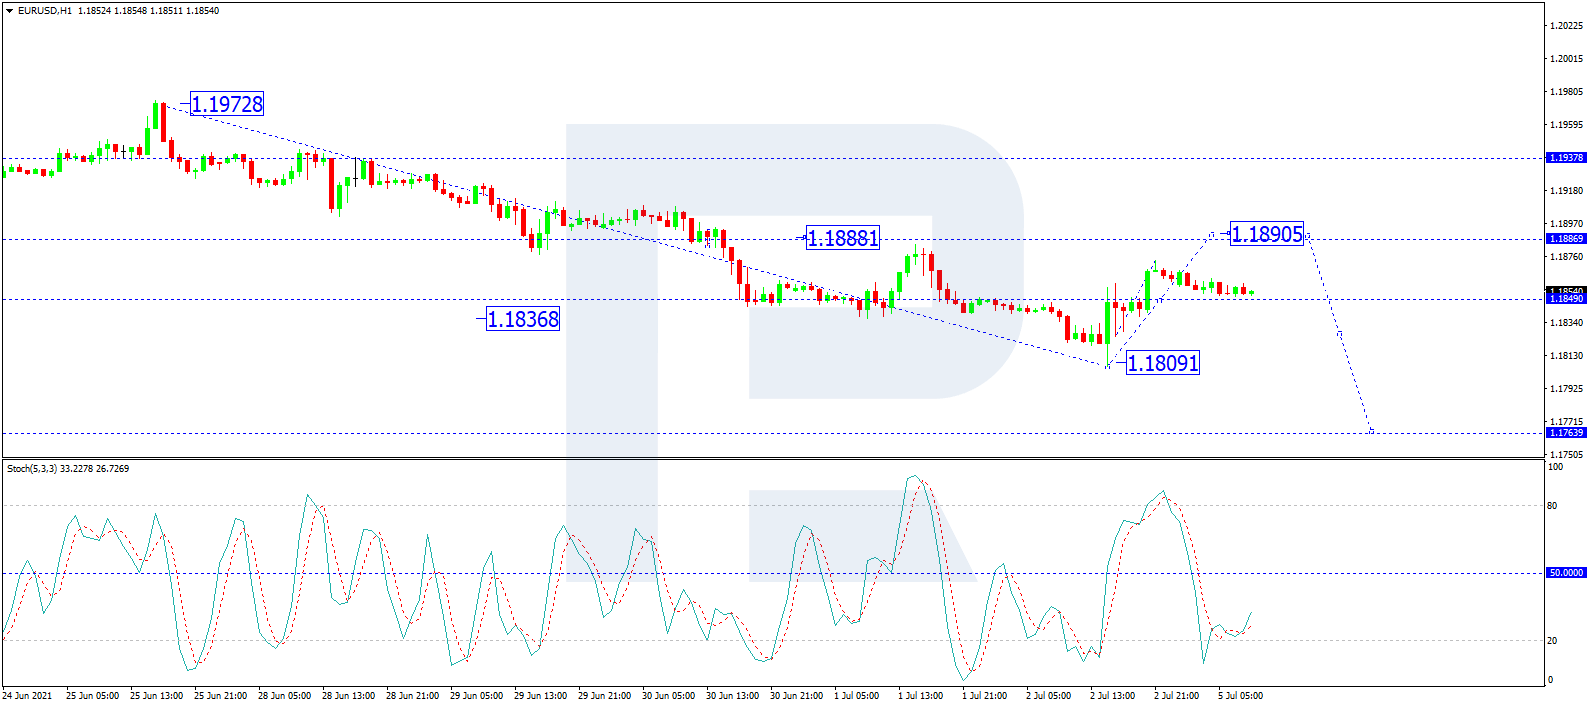 As we can see in the H1 chart, after completing the descending wave at 1.1809 and then finishing a new rising impulse towards 1.1850, EUR/USD is trading around the latter level and forming a correctional continuation pattern. Possibly, the pair may break it to the upside and finish the correction at 1.1890. After that, the instrument may resume trading downwards with the target at 1.1800. From the technical point of view, this scenario is confirmed by the Stochastic Oscillator: after rebounding from 20, its signal line is steadily moving upwards. Later, the line may break 50 and continue growing towards 80.
Europe Heads Lower In Risk-Off Trade, FTSE Out-Performs
Risk-off sentiment is dominating the markets at the start of the week. Weaker-than-expected China data is overshadowing signs of economic recovery in Europe, while US markets are set to remain closed in observance of the Independence Day public holiday.
The China Caixin services PMI revealed the sector grew at its slowest pace in 14 months in June. The PMI printed at 50.3, well down from 55.1 in May and far from the expected 55.7. The weak print comes following Thursday’s manufacturing equivalent, which also revealed that growth was slowing.
The latest PMI data from China reveals economic recovery from Covid in the world’s second-largest economy is starting to wane. This was in stark contrast to the Eurozone PMI reading. The composite PMI gauge for the Eurozone revealed that business activity soared in June as lockdown restrictions in the region were lifted.
The final composite PMI for June came in at 59.5, ahead of the flash print of 59.2 and well ahead of May’s 57.1. Eurozone business activity expanded at the fastest pace in 15 years as more Covid restrictions were eased following the third wave and as the dominant service sector fired back into life.
Europe’s recovery is really starting to ramp up. However, inflationary pressures are also on the rise, which is keeping investors a little nervous. Inflationary pressures are picking up amid supply-chain disruptions and labour shortages.
The FTSE is outperforming its European peers, boosted by the supermarkets after Morrisons accepted a bid from US fund Fortress, although other interested parties are still circling. Under the UK market rules, potential bidders have until 17 July to make an approach. With at least two other parties interested, the chances of this turning into a bidding war have risen sharply.
US markets will remain closed today for the extended Fourth of July weekend.
FX – GBP rises on reopening hopes and PMI data
The pound is putting in a solid performance, retaking 1.3850 amid reopening optimism and better-than-expected PMI data. The UK appears to be well on track for final Covid restrictions to be eased on 19 July, even as cases remain elevated. Deaths have remained low, indicating the vaccine has broken the link between cases and deaths.
Meanwhile, data revealed that business activity is surging for UK services firms as the post-Covid bounceback continued in June. The services PMI edged lower to 62.4 in June, down from 62.9 but still well above the 61.7 initial reading. Job creation rose at the fastest clip in seven years, boding well for the UK economy when furlough restrictions are eased in Autumn.
Oil Extends Gains, Gold Edges Higher
Oil looks to OPEC+
Oil prices are continuing to push higher, extending gains into a seventh straight week as the market awaits the outcome of crucial talks by OPEC+. The group failed to reach an agreement over raising oil supplies last week. The group was in favour of increasing supply by two million barrels per day from August to December in an attempt to balance out surging demand. However, the United Arab Emirates dissented, resulting in nothing being agreed.
Talks will continue today, and expectations are for supply curbs to be eased by 400k barrels per day. This is below the minimum expectation of the market going into the meeting and is also insufficient to rebalance the tight conditions in the oil market presently.
Demand outlook remains robust as economies reopen after Covid. Inventories have seen larger-than-expected draws over the past six weeks. Should the 400,000-output increase be agreed upon, oil prices could well quickly move to USD80 per barrel.
As oil prices keep rising, attention will shift towards US production as the higher prices once again make it economically viable for US shale producers to ramp up. The latest Baker Hughes rig count revealed that US energy companies increased oil and natural gas rigs for a third straight week.
Gold struggles at 100 DMA
Gold is edging higher, building on small gains from last week. The safe-haven precious metal is benefitting from souring risk appetite amid rising Delta Covid cases and weaker-than-expected Chinese Caixin services PMI. Investors are also reassessing the Fed’s hawkish moves in the wake of Friday’s closely-watched jobs report.
The US non-farm payroll data prompted a sharp fall in the US dollar, bringing it off its recent two-month high. While 850k jobs were created in June, a better-than-forecast figure, unemployment ticked higher, prompting speculation that the labour market recovery isn’t strong enough to encourage an earlier move by the Fed.
Despite setting off this week on the front foot, gold is struggling to push beyond key resistance at USD1790, the 100-day moving average. Investors are looking ahead to the release of the minutes from the latest FOMC meeting, which should shed more light on the Federal Reserve’s next steps.
Aussie Steadies, RBA Meeting Next
The Australian dollar has started the week with small gains. In the European session, AUD/USD is trading at 0.7532, up 0.09% on the day.
Australian dollar slides on strong NFP
The Australian dollar took a dive at the end of the week, as the US nonfarm payrolls were stronger than expected. The US economy created 850 thousand jobs in June, up from 583 thousand and ahead of the consensus of 700 thousand. The US dollar recorded broad gains and USD/AUD jumped 0.75%.
Despite the solid gain in jobs, unemployment rose to 5.9%, up sharply from 5.6%. Labour supply is the culprit holding back the recovery, as companies struggle to find employees. Predictably, this has increased wage pressures – Average Hourly Earnings rose 3.6% YoY in June, just shy of the estimate of 3.7%, and sharply higher than the May release of 1.9%. Higher wages will mean higher inflation, and that could result in the Fed tightening policy sooner rather than later.
In Australia, Retail Sales for June rose 0.4% MoM, revised upwards from the initial estimate of 0.1%. On annualized basis, Retail Sales jumped 7.7%, another indication of the strong post-Covid recovery.
The markets will be keeping a close eye on the RBA, which holds its policy decision on Tuesday (4:30 GMT). No change is expected in interest rates, which are at an ultra-low level of 0.10%. The central bank is widely expected to maintain its QE programme, but the third installment could be lower than the first two, which amounted to AUD 100 billion each. With much of the country under lockdown due to some Covid cases, the bank may send out a dovish message while at the same time tapering QE. It will be interesting to see how the Australian dollar reacts to the RBA decision.
AUD/USD Technical
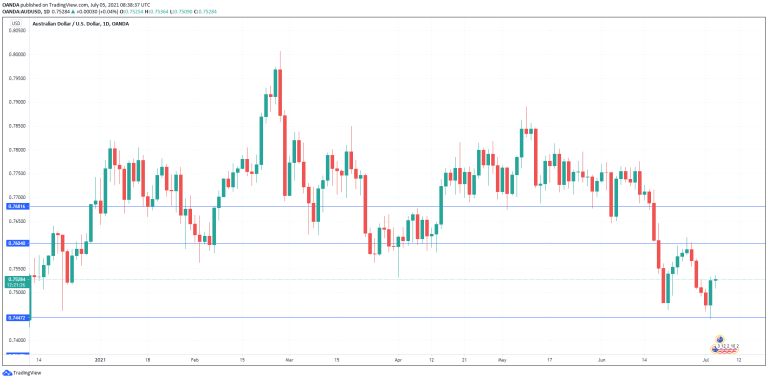
- There is resistance at 0.7604, followed by 0.7681
- On the downside, 0.7447 is the first line of support. Below, there is support at 0.7367
EUR/NZD 4H Chart: Two Scenarios Likely
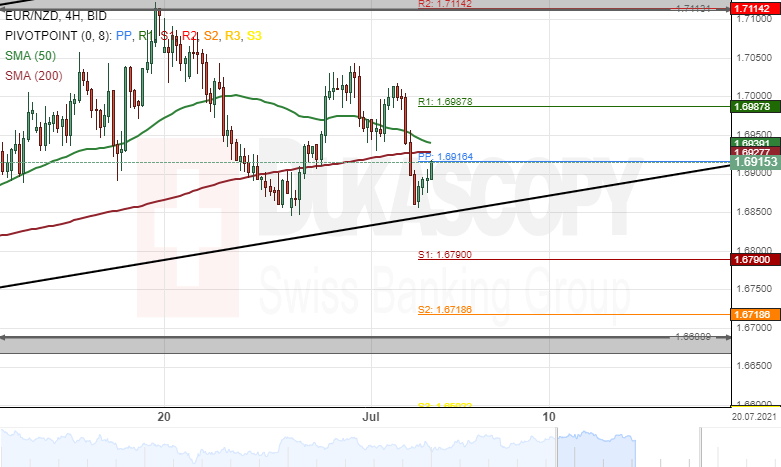
Since July 1, the common European currency has declined by 1.03% against the New Zealand Dollar. The currency pair breached the 50– and 200– period SMAs during last week's trading sessions.
Currently, the exchange rate is trading near the lower boundary of an ascending channel pattern and could be set for a breakout.
If the breakout occurs, a decline towards the 1.6650 area could be expected within this week's trading sessions.
However, if the ascending channel pattern holds, bullish traders would pressure the currency exchange rate higher this week.
AUD/NZD 4H Chart: Decline Likely To Continue
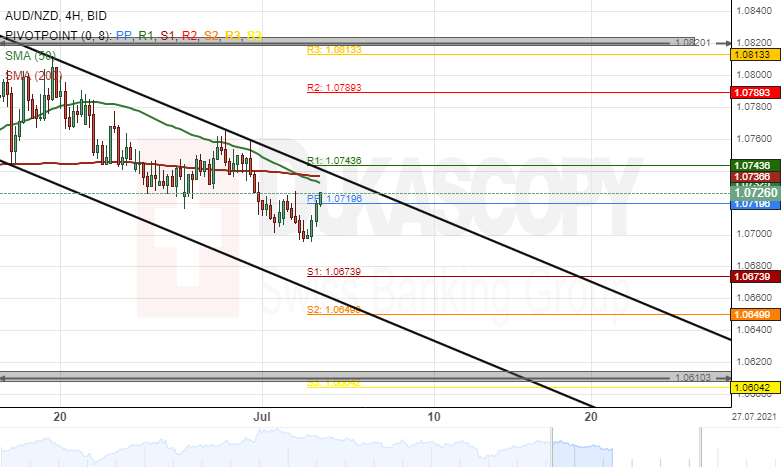
The Australian Dollar has declined by 0.61% against the New Zealand Dollar since July 1. The currency pair was pressured lower by the 50– and 200– period SMAs during last week's trading sessions.
By and large, the exchange rate is likely to continue to edge lower in a descending channel pattern during the following trading sessions. The potential target for the AUD/NZD pair will be near the 1.0620 area.
However, the weekly support level at 1.0673 might provide support for the currency exchange rate in the shorter term.
EUR/USD Analysis: Surges Above SMAs
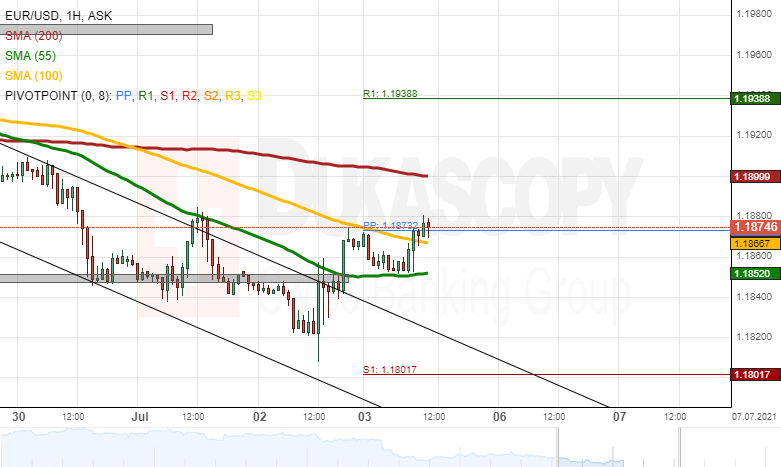
On Friday, at 12:30 GMT, the release of US monthly employment data caused a surge, which broke the resistance of the 55 and 100-hour simple moving averages. By the middle of Monday's European trading hours, the pair had reached the 1.1880 level and had no technical resistance as high as the 1.1900 level.
In the near term future, the rate was expected to test the resistance of the 1.1900 mark and the 200-hour simple moving average.
If the pair passes the resistance of the 1.1900 level, the rate would most likely aim at the resistance of the weekly R1 simple pivot point at 1.1939. Afterwards, the pair could reach for the 1.2000 mark.
On the other hand, a potential bounce off from the resistance of the 1.1900 level could look for support in the weekly simple pivot point at 1.1873, the 100-hour simple moving average at 1.1867 and the 55-hour SMA at 1.1852.
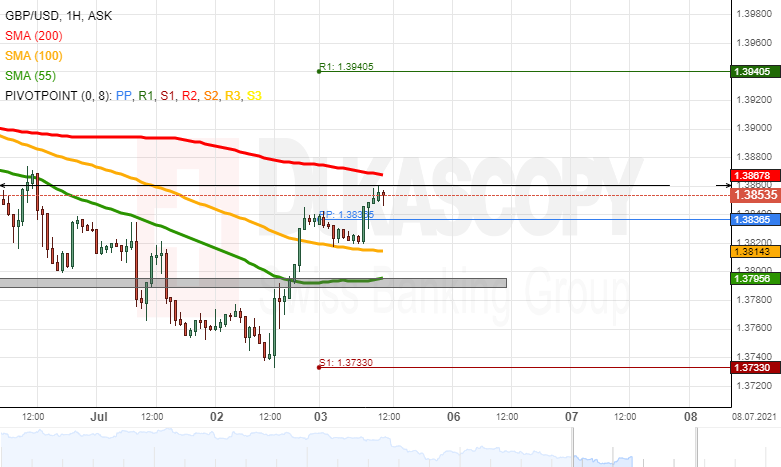
GBP/USD Analysis: Surges Due To US Data
On Friday, at 12:30 GMT, the US statisticians published monthly employment data, which caused a decline of the US Dollar. The initial decline was followed up by an extension of the fall of the value of the US Dollar. On the GBP/USD charts it resulted in a move upwards.
By the middle of Monday's trading hours, the rate had reached the resistance of the 1.3860 level, which was expected to be strengthened by the 200-hour simple moving average.
If the currency exchange rate passes the resistance of the 1.3860 level and the 200-hour SMA, it would have no technical resistance as high as the 1.3940 level, where the weekly R1 simple pivot point was located at. However, take into account that the 1.3900 marks could provide the rate with resistance.
On the other hand, a potential decline would most likely find support first in the weekly simple pivot point at 1.3837. Afterward, the 100-hour SMA could provide support near 1.3815. In addition, the 55-hour SMA at 1.3795 might provide additional support.
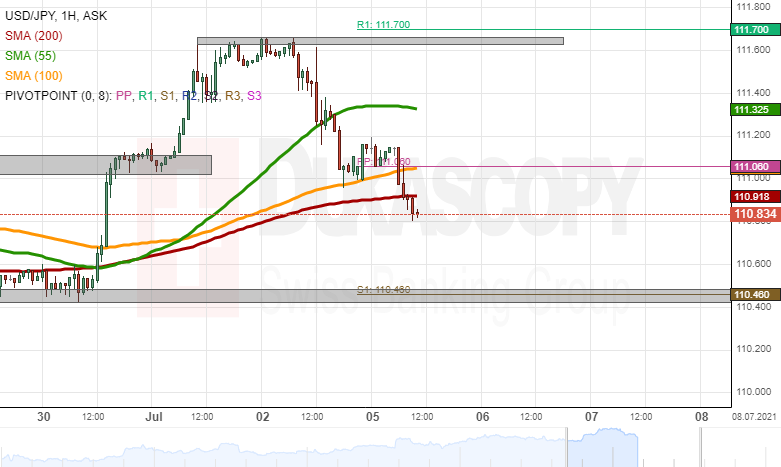
USD/JPY Analysis: Declines Below 111.00
The USD/JPY failed to pass the resistance zone above the 111.60 level. Moreover, during the last attempt to reach higher, the rate was beating down by fundamental news. Namely, worse than expected US employment data was released on Friday at 12:30 GMT.
By the middle of the day's European trading hours, the rate ad extended its decline and reached the 110.80 level. In general, the pair had no technical support as low as the 110.46 level, where the weekly S1 simple pivot.
In the case that the pair declines, it could look for support in round exchange rate levels before reaching the previous week's low-level zone near 110.50.
On the other hand, a possible recovery would immediately face the resistance of the 100 and 200-hour simple moving averages and the weekly simple pivot point in the 110.90/111.00 area. If these levels would be passed, the rate could aim at the 55-hour simple moving average at 111.33.