Sample Category Title
Gold Creates Bullish Correction Still Below 1,800
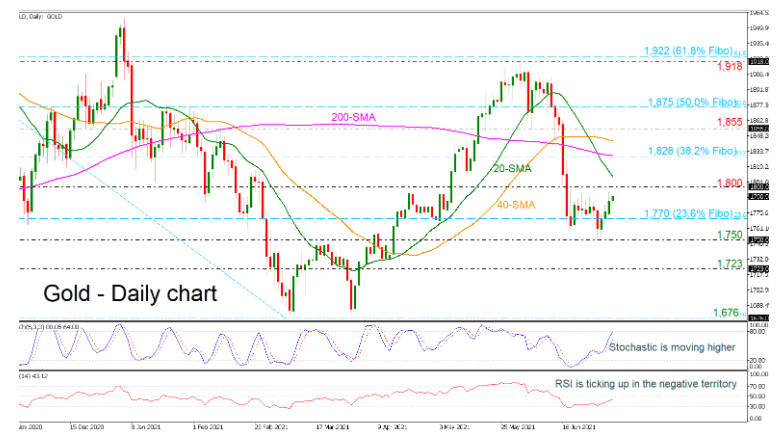
Gold prices are moving higher after the bounce off the 1,750 support level, crawling above the 23.6% Fibonacci retracement level of the down leg from 2,074.89 to 1,676 at 1,770. The stochastic oscillator is approaching the overbought territory, while the RSI is pointing upwards in the negative region. However, the 20- and 40-day simple moving averages (SMAs) have crossed below the 200-day SMA, sending unfavourable signals for the market trend.
Immediate resistance could occur between the 1,800 psychological level and the 20-day SMA currently at 1,810. More advances could take the market until the 38.2% Fibonacci of 1,828, which overlaps with the 200-day SMA, and then towards the 40-day SMA at 1,843. Overcoming these obstacles, the price could next target the 1,855 barrier.
On the flip side, a decrease below the 23.6% Fibonacci of 1,770 could open the door for the 1,750 support and the 1,723 level, registered in April 13. Below the latter, the 1,676 low could attract attention, taken from the low on March 8.
In conclusion, the yellow metal is creating its fourth green day in a row, though in the broader picture the price has been in a declining mode since June 1.
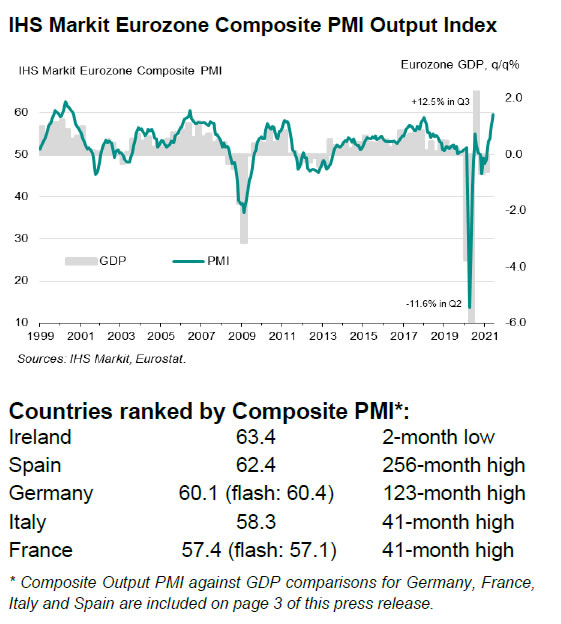
Eurozone PMI composite reached 16-yr high, recovery stepped up a gear, but inflationary pressures ratcheted higher
Eurozone PMI Services was finalized at 58.3 in June, up from May's 55.2. PMI Composite was finalized at 59.5, up from May's 57.1. That's also the highest level in 15 years since June 2006. Looking at some member states, Ireland PMI composite dipped to 2 month low at 63.4. Spain hit 256-month high at 62.4. Germany hit 123-month high at 60.1. Italy reached 41-month high at 58.3. France also reached 41-month high at 57.4.
Chris Williamson, Chief Business Economist at IHS Markit said: "Europe's economic recovery stepped up a gear in June, but inflationary pressures have also ratcheted higher... A wave of optimism that the worst of the pandemic is behind us has meanwhile propelled firms' expectations of growth to the highest for 21 years, boding well for the upturn to gain further strength in coming months.
"Firms are increasingly struggling to meet surging demand, however, in part due to labour supply shortages, meaning greater pricing power and underscoring how the recent rise in inflationary pressures is by no means confined to the manufacturing sector. Service sector companies are hiking their prices at the steepest pace for over 20 years as costs spike higher, accompanying a similar jump in manufacturing prices to signal a broad-based increase in inflationary pressures."
USD/CAD Breakout Occurs
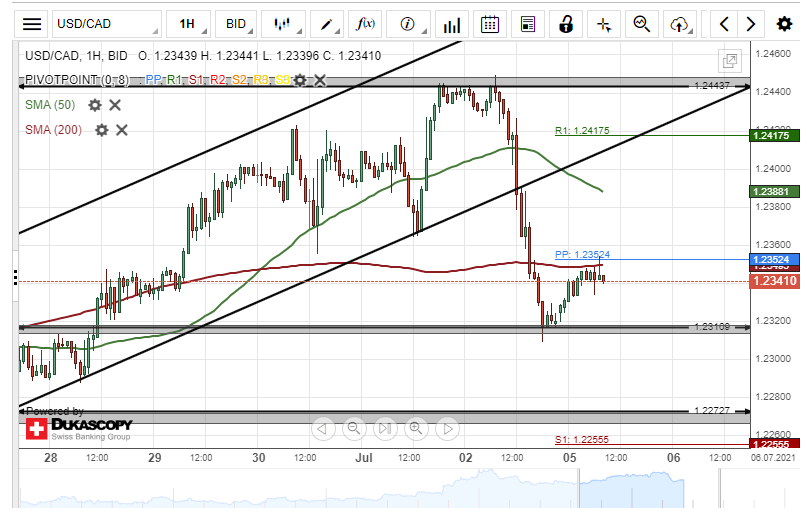
The US Dollar plunged by 128 or 1.03% against the Canadian Dollar on Friday. A breakout occurred through the lower boundary of an ascending channel pattern during Friday's trading session.
Given that a breakout has occurred, the exchange rate could continue to edge lower during the following trading session. The possible target for the USD/CAD pair will be near the 1.2272 area.
However, the support line at 1.2320 could provide a barrier for the currency exchange rate in the shorter term.
GBP/JPY Likely To Edge Higher
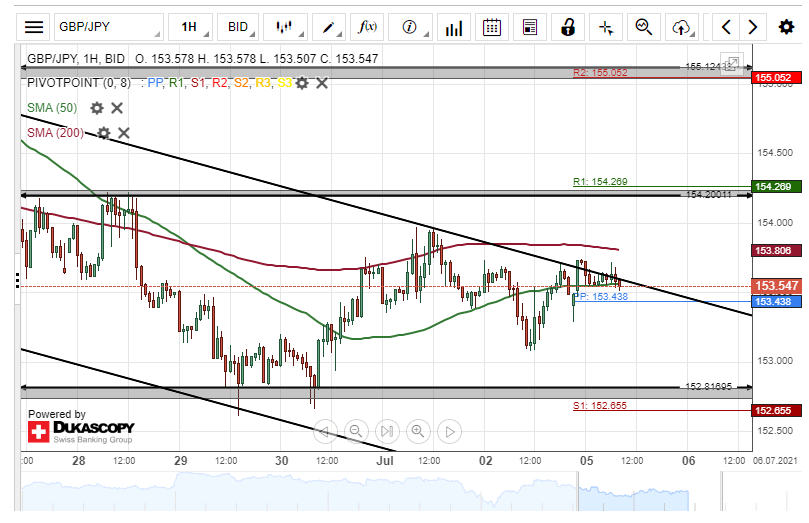
The British Pound rose by 62 pips or 0.41% against the Japanese Yen on Friday. The currency pair tested the upper line of a descending channel pattern at 153.74 during Friday's trading session.
All things being equal, the exchange rate could continue to surge towards the following trading session. A breakout through the upper line of the channel pattern could occur.
However, the 200– hour simple moving average at 153.82 could provide resistance for the GBP/JPY currency exchange rate in his session.
AUD/USD Sets For Breakout
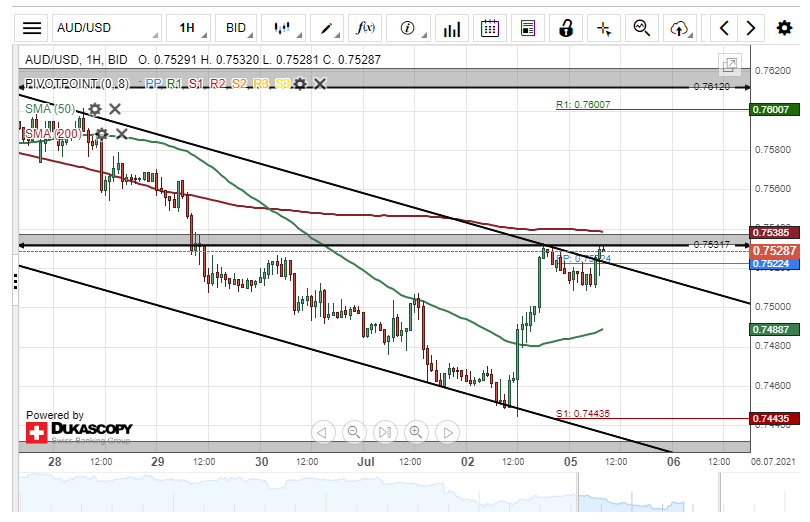
The Australian Dollar edged higher by 81 pips or 1.09% against the US Dollar on Friday. The currency pair bounced off the lower line of a descending channel pattern during Friday's trading session.
The exchange rate is currently trading near the upper boundary of the channel pattern and could be set for a breakout.
If the breakout occurs, bullish traders could pressure the AUD/USD pair towards the weekly resistance level at 0.7600 in this session.
However, if the descending channel pattern holds, the currency exchange rate will most likely maintain the downward movement in the nearest future.
EUR/JPY Decline Could Continue
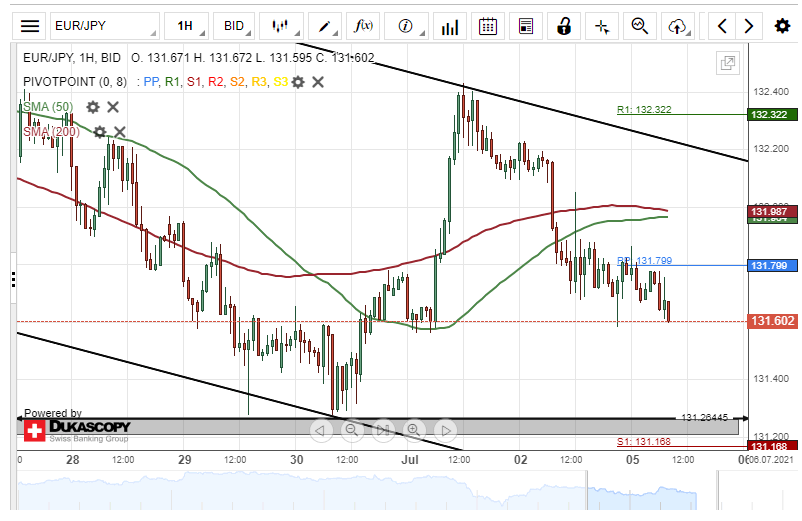
The common European currency declined by 55 pips or 0.42% against the Japanese Yen on Friday. The currency pair breached the 50– and 200– hour SMAs during Friday's trading session.
Everything being equal, the exchange rate could continue to edge lower during the following trading session. The potential target for the EUR/JPY pair would be near the weekly support level at 131.16.
Although, the currency exchange rate could reverse from the 131.77 area and target the upper boundary of a descending channel pattern at 132.20 within this session.
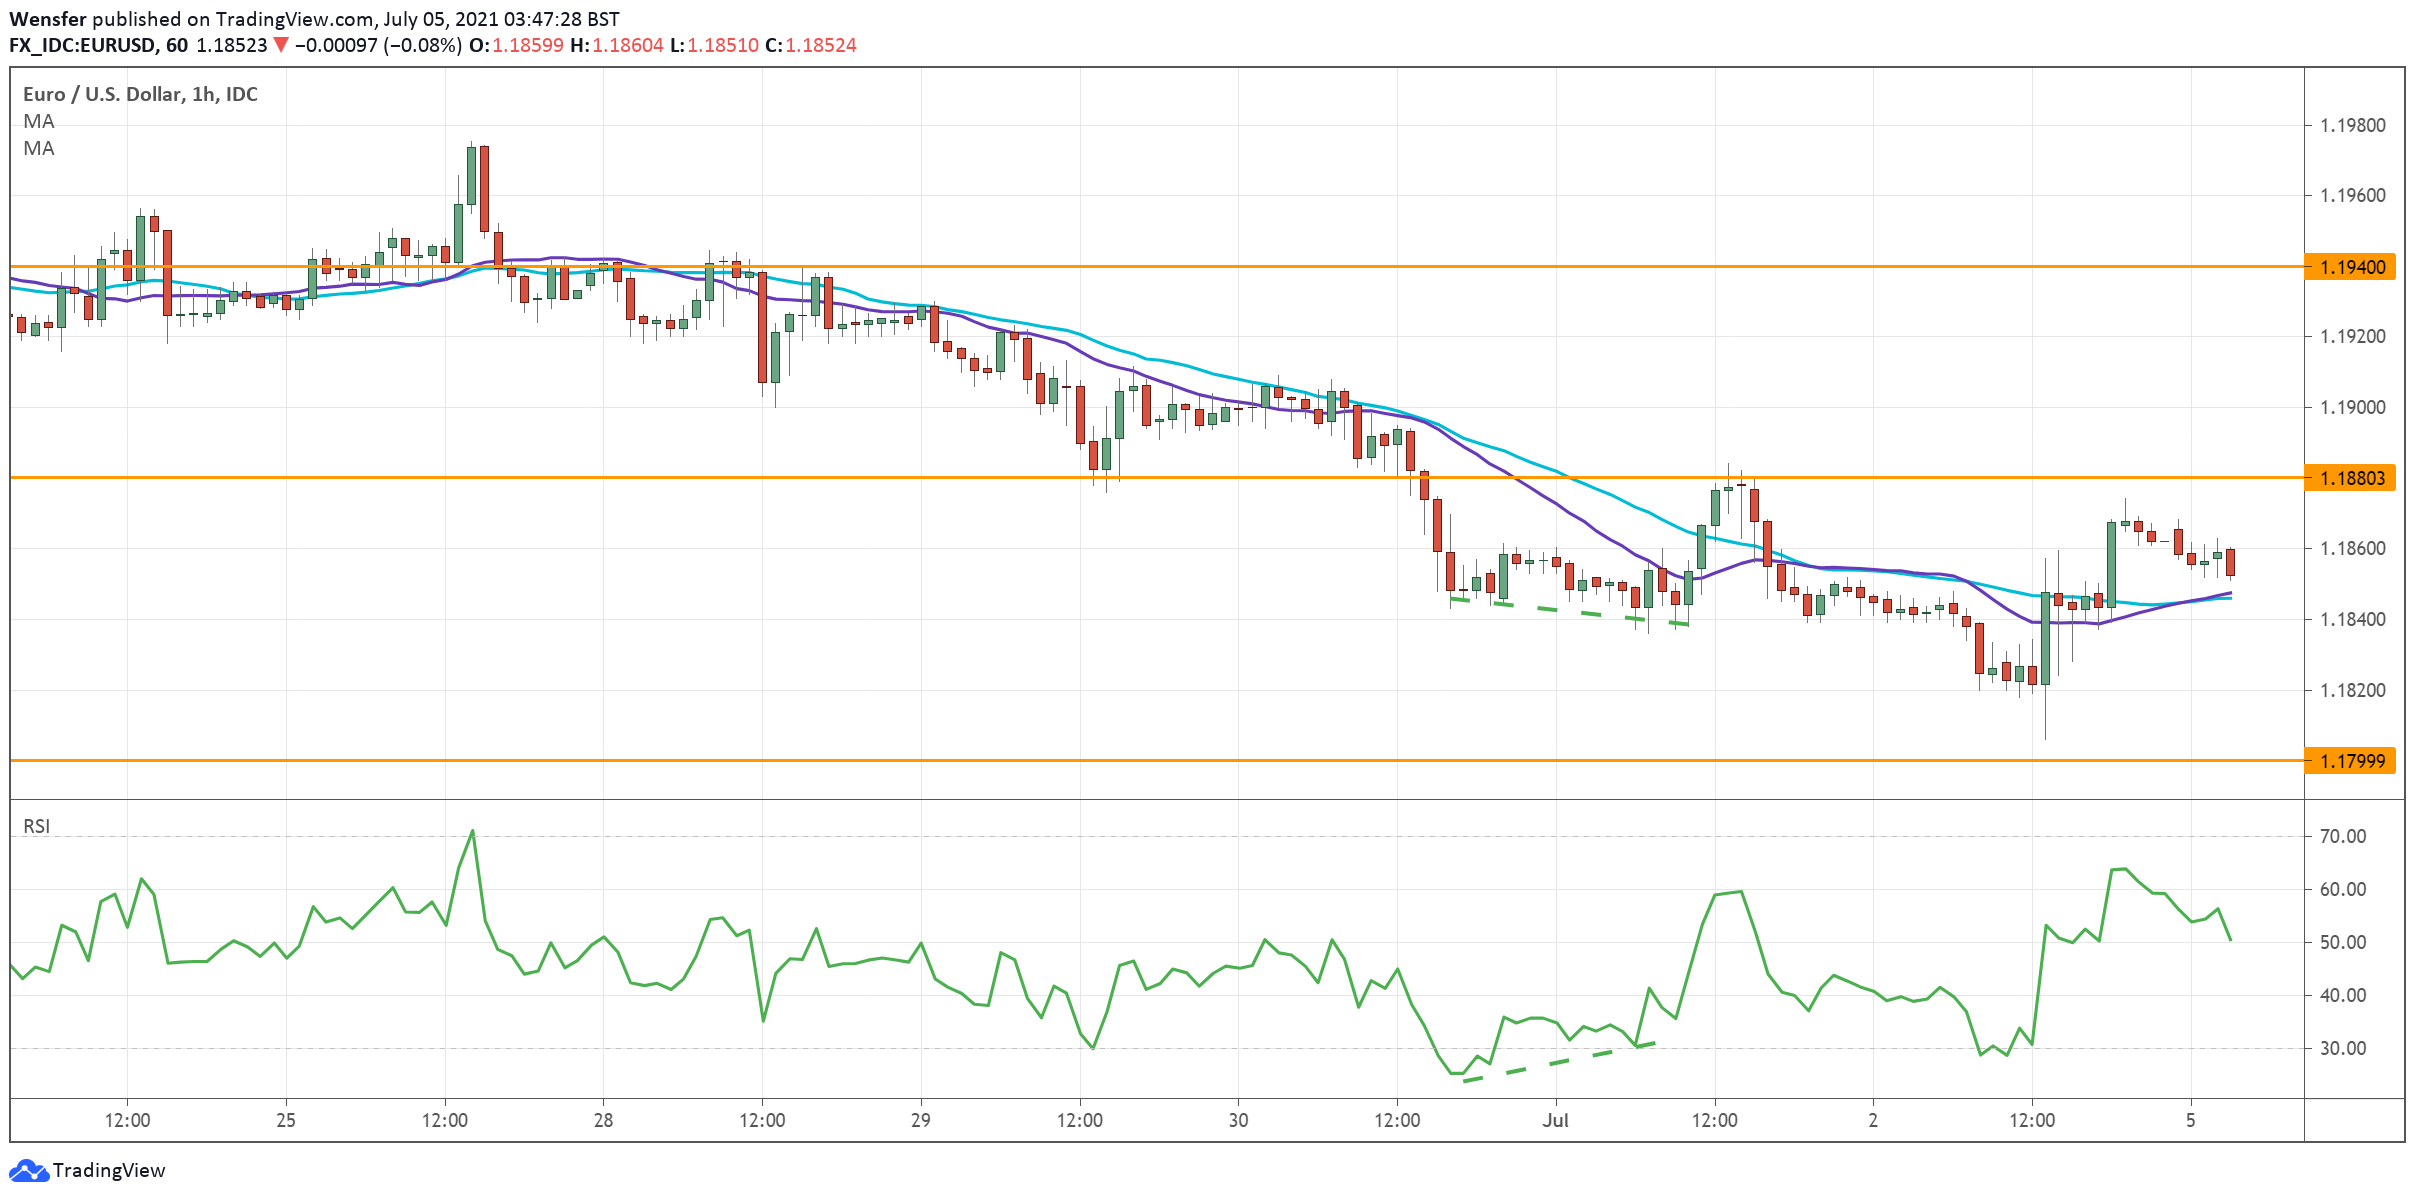
EUR/USD Outlook: Bear-Trap Warns Of Correction But Upticks Likely To Be Limited
The Euro is trading within a narrow range in early Monday, as extended US holiday lowers volumes.
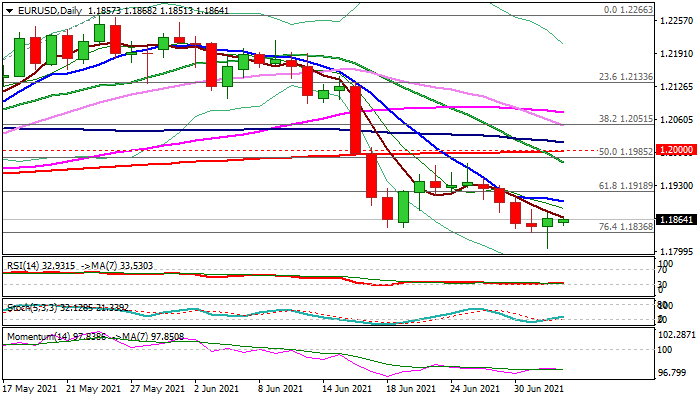
Last Friday's post-NFP action left bullish candle (the first after four consecutive red daily candles) with long tail, marking the failure at pivotal Fibo support at 1.1836 (76.4% of 1.1704/1.2266) and generating initial signal of bear-trap.
This may put larger bears on hold as last week's action failed to register a close below previous lows at 1.1847 (June 18/21), but recovery is likely to be limited and aiming to provide better selling opportunities, as daily studies remain in full bearish setup.
Falling 10DMA (1.1898) offers solid resistance, with extended upticks to stall under the lower top at 1.1975 (June 25) to keep bears intact.
Only violation of 1.1985/1.2000 breakpoints (daily cloud base / 200DMA / psychological) would neutralize bears for stronger correction of the downtrend from 1.2266 (May 25 peak).
Res: 1.1884, 1.1898, 1.1918, 1.1975.
Sup: 1.1836, 1.1806, 1.1795, 1.1737.
GER 30 Looks To Break Out Of Triangle
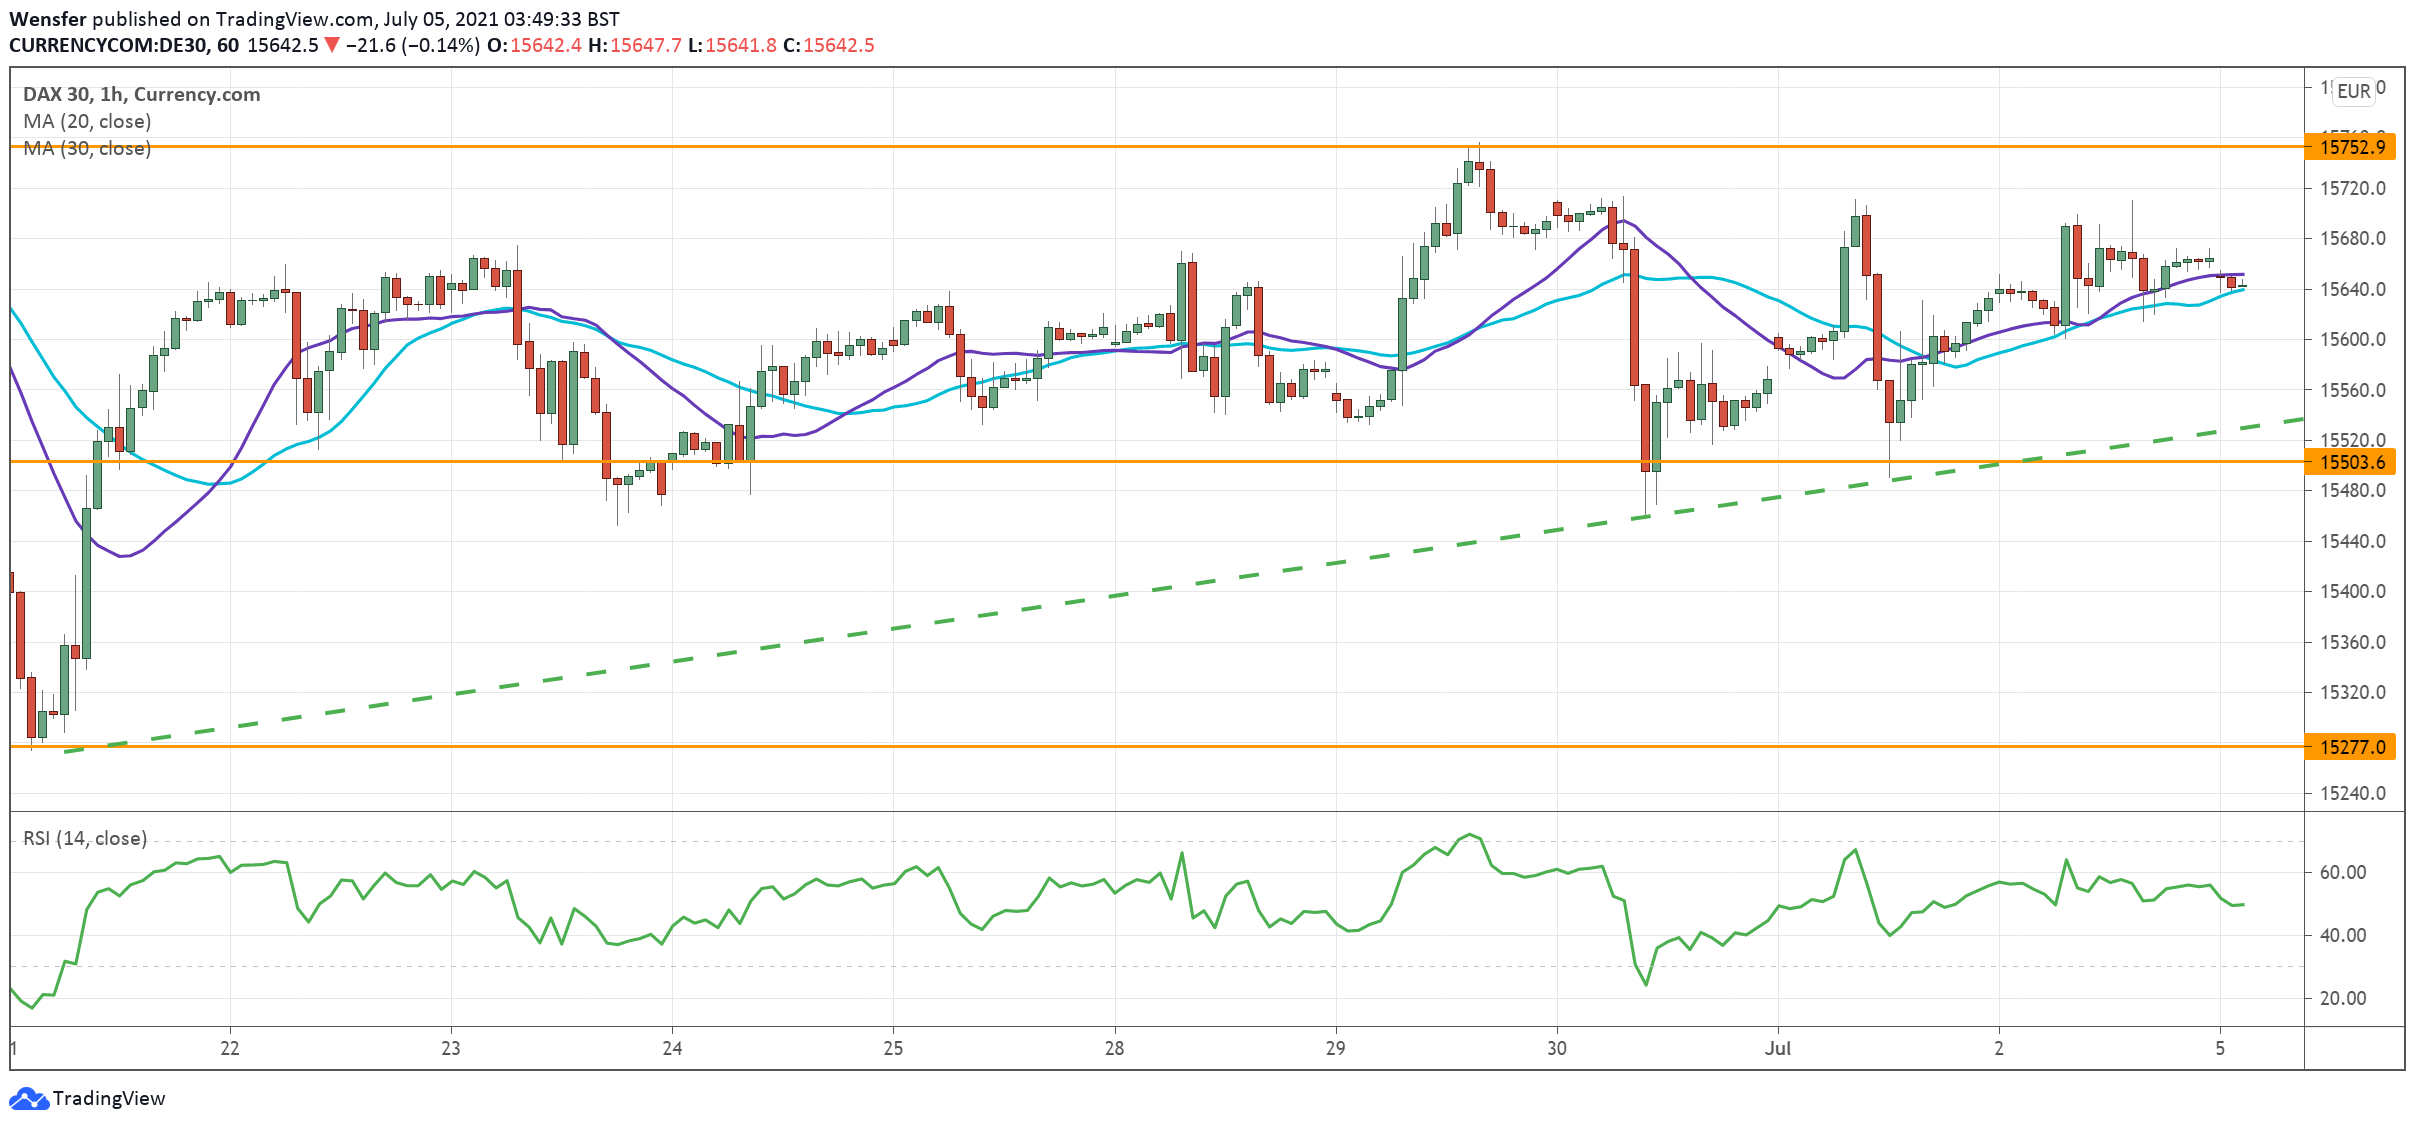
The DAX 30 consolidates near its recent peak as the euro zone’s economy picks up steam.
The index is in an ascending triangle as buyers are willing to pay up. This often occurs as a continuation pattern as the price will typically breakout in the same direction as the underlying trend.
A close above 15750 may prompt the last sellers to cover. The RSI stays neutral, laying the groundwork for a breakout. A runaway rally could lift offers towards the milestone at 16000.
A drop below 15500, however, may trigger a correction to 15280.
XAG/USD Rallies Above Resistance
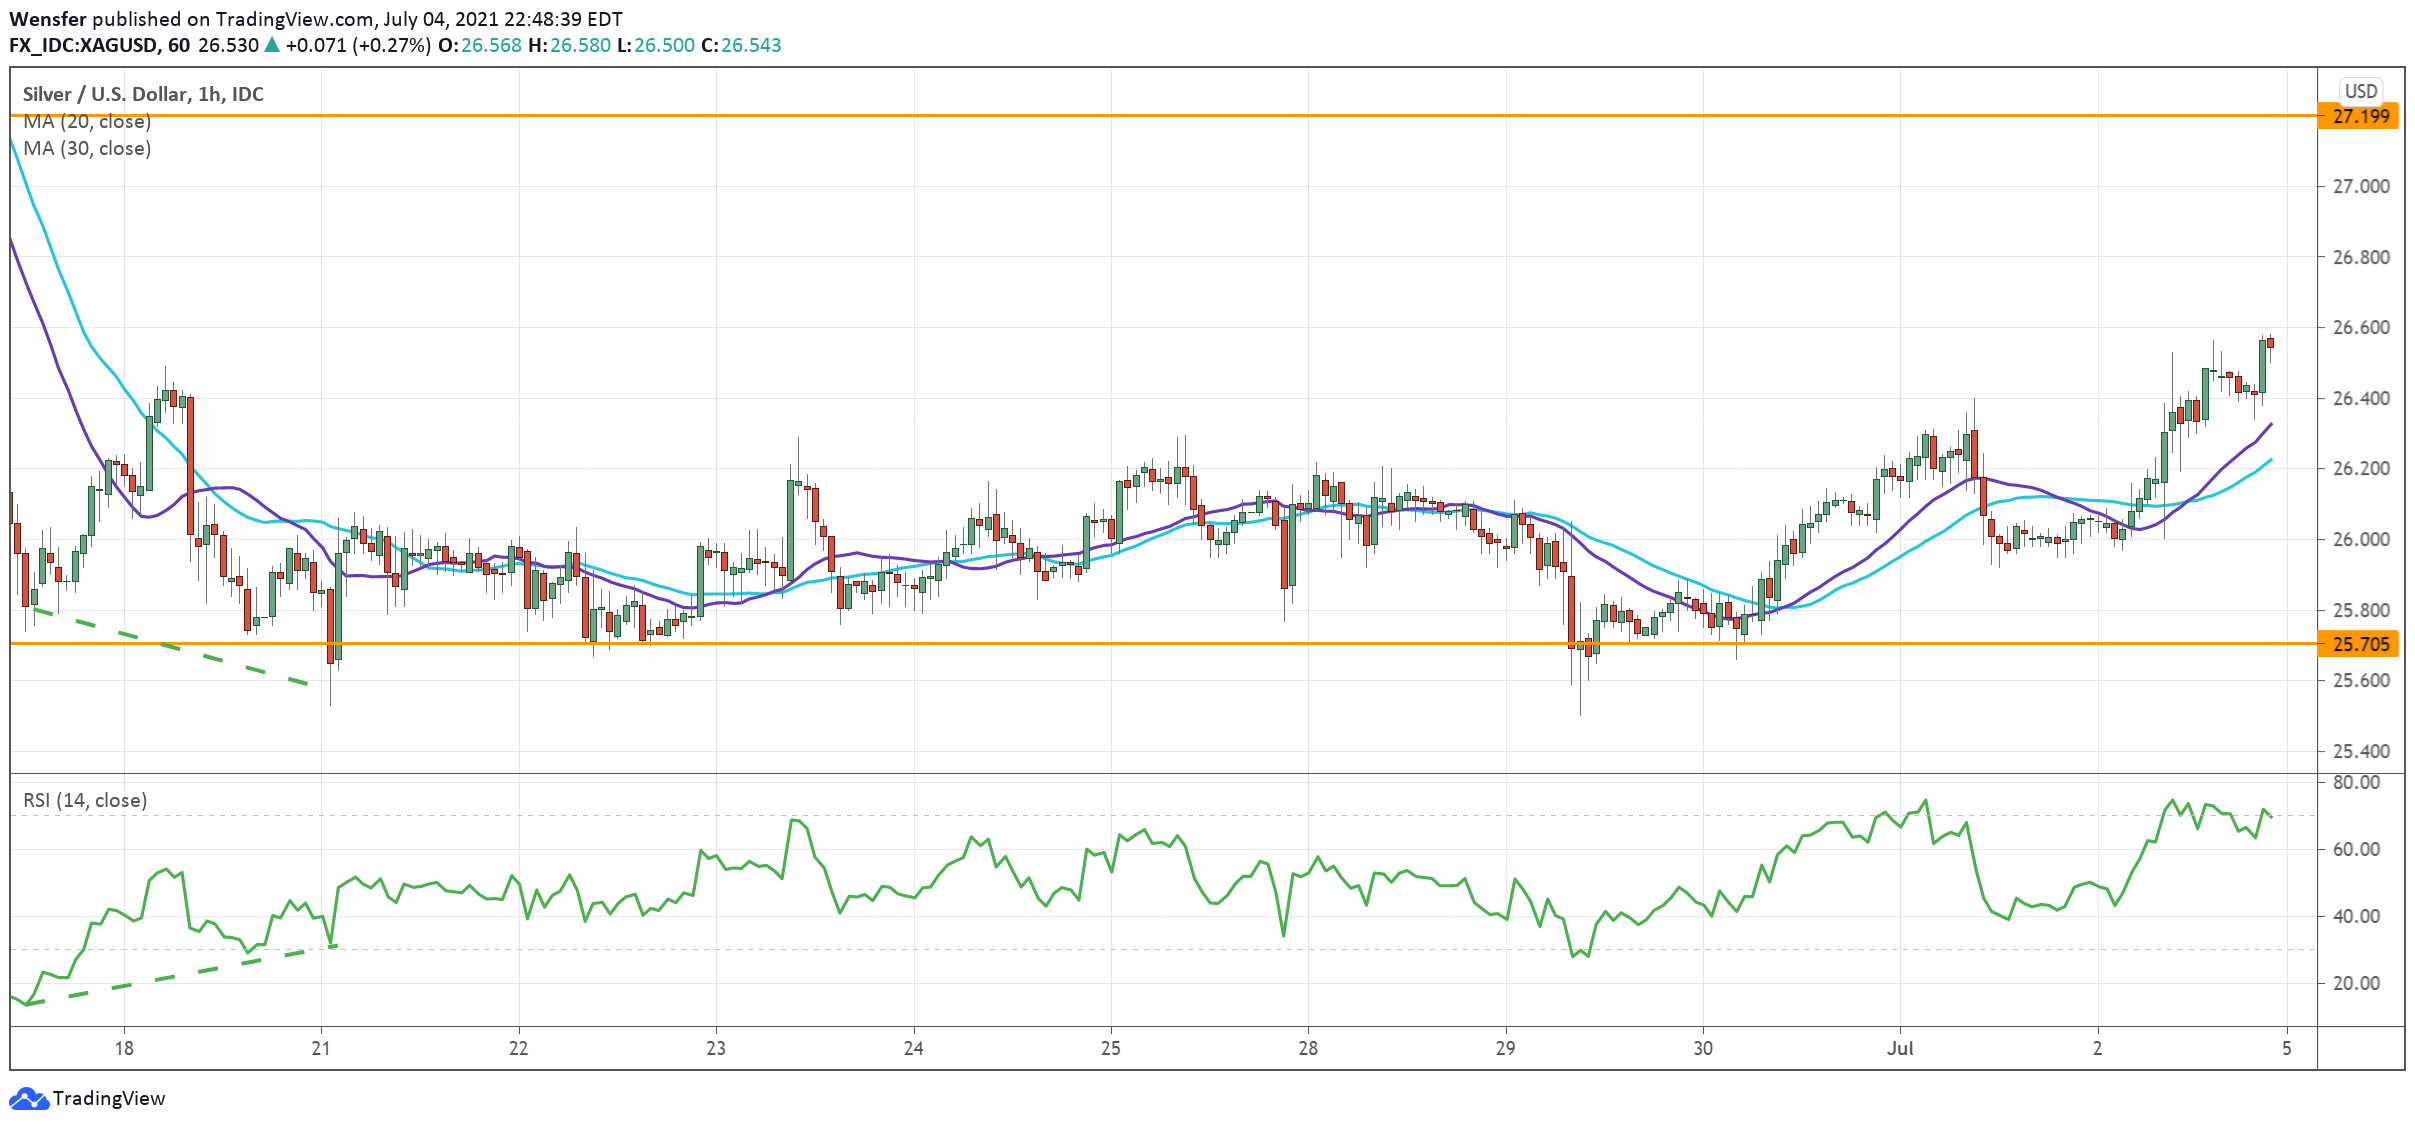
Bullions bounce back as weaker-than-expected jobs data take a toll on the US dollar.
On the daily chart, silver has found support at the 61.8% (25.70) Fibonacci retracement level from the late March rally. 26.50 has so far capped the bulls’ attempts.
The latest breakout is a confirmation of the previously mentioned bullish RSI divergence. The bears may rush to cover their bets before it becomes too expensive to do so.
27.20 would be the next target when the rebound gains traction.
EUR/USD Struggles To Bounce
The US dollar drops after an uptick in last month’s unemployment rate. Sentiment towards the euro grew a tad more bearish after it fell below 1.1850, the support of the recent consolidation range.
However, an RSI divergence suggests a loss in the downward momentum, and its double-dip into the oversold territory may make sellers reluctant to double down. Buyers will need to lift offers around 1.1880 before they could push for a reversal.
Below 1.1800, the pair would be heading towards the daily support at 1.1710 by default.