Sample Category Title
Gold, Silver in brief healthy consolidation as speculative heat cools
Gold and Silver saw heavy selling this week, pausing their record-setting advance as traders took profits and liquidity conditions improved. The decline has raised questions about whether the market is entering a deeper downturn, but technicals suggest the move is more of a healthy correction within a still-bullish backdrop.
Reports of increased Silver flows from the U.S. and China into London’s spot market added to the selling pressure, easing recent supply constraints that had intensified price momentum. The additional liquidity gave traders room to unwind speculative positions, accelerating the pullback but also helping to stabilize the market longer-term. This as part of a natural rebalancing after overbought conditions earlier in the month.
While the losses have been sharp, there is no clear structural threat to the broader uptrend. The latest pullback reflects profit-taking and short-term positioning adjustments rather than a breakdown in investor confidence. Demand for precious metals remains underpinned by global macro uncertainty, moderate inflation expectations, and central bank diversification away from U.S. assets.
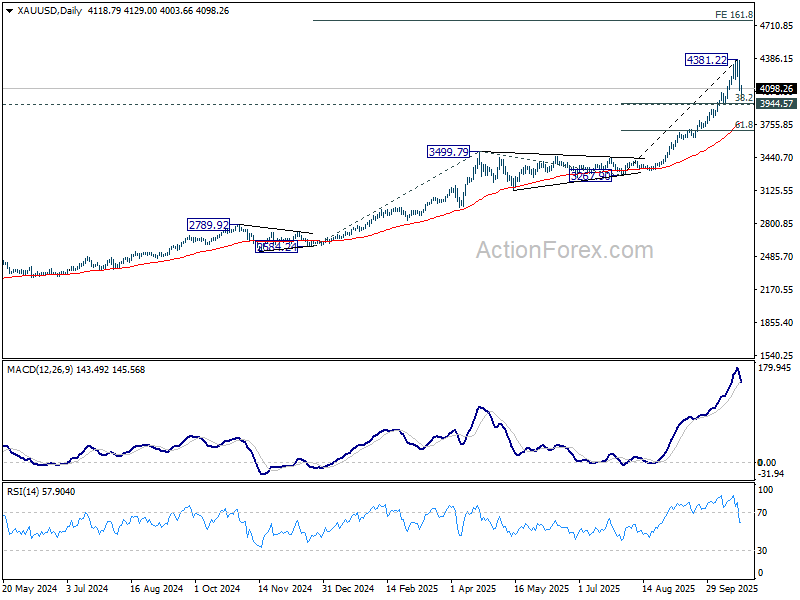
Technically, Gold remains supported above 3,944.57 cluster, a level that separates sideway consolidation from deeper correction. As long as this level holds, consolidations from 4,381.22 should remain relatively brief. Sustained break above 4,381.22 would signal renewed strength, opening the path toward 161.8% projection of 2,584.24 to 3,499.79 from 3,267.90 at 4,749.25.
However, break of 3,944.57 would argue the latest rise leg from 3,267.90 has completed, and bring deeper correction to 55 D EMA (now at 3,781.78). Such a move would extend consolidation but not necessarily signal a full trend reversal.
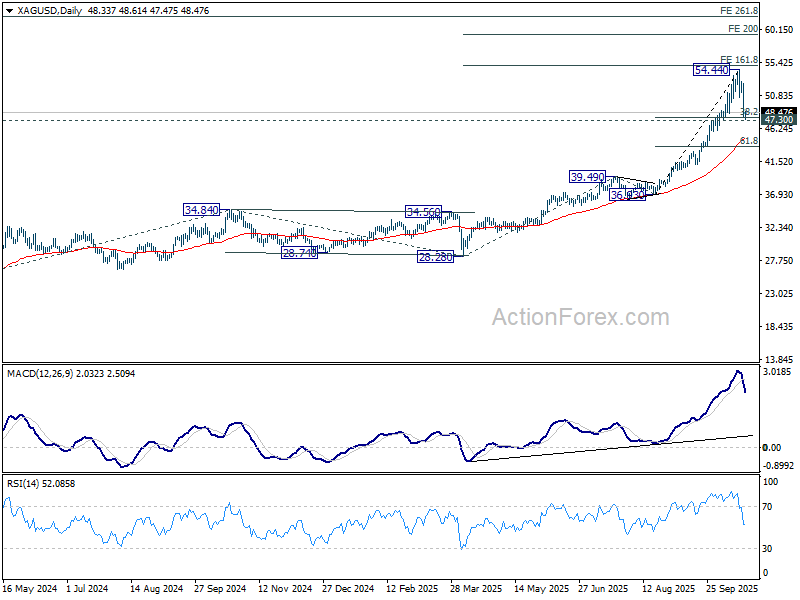
Silver is showing a similar pattern. As long as 47.30 cluster holds, correction from 54.44 should stay shallow and short-lived. Another rise to 200% projection of 28.28 to 39.49 from 36.93 at 59.30 should be seen sooner rather than later.
However, a fall below 47.30, would trigger deeper pullback toward 55 D EMA (now at 44.76), before uptrend resumes.
Japan’s exports rise for first time in five months, but U.S. demand still weak
Japan’s exports rose in September for the first time in five months, signaling tentative recovery in external demand even as shipments to the U.S. continued to contract sharply.
Exports climbed 4.2% yoy to JPY 9.41T, slightly below expectations of 4.6%. The rebound was driven largely by strength in Asia, where exports jumped 9.2%, including a 5.8% rise to China. In contrast, shipments to the U.S. fell -13.3%, with auto exports down -24.2%, extending months of weakness despite being a smaller drop than August’s 28.4% decline.
Imports also grew faster than expected, rising 3.3% yoy to JPY 9.65T, compared with forecasts of 0.6%. As a result, Japan posted a trade deficit of JPY 234.6B.
The data come just weeks after Washington finalized a new trade agreement with Tokyo, implementing a 15% baseline tariff on nearly all Japanese imports, down from the initial 27.5% rate.
Gold (XAU/USD) Price Down 5.7%, Biggest Daily Drop Since 2020. What Next for Gold Prices?
Gold prices saw a sharp decline on Tuesday, on track for their steepest daily drop in five years, as investors sold the precious metal.
A stronger US dollar and the decision by traders to take profits caused the price to fall significantly. This was compounded by US President Trump who softened his stance regarding a deal with China, reassuring the public that everything would "be fine" and that the US wanted to "help China, not hurt it." This slight shift in tone offered some relief to nervous markets and weighed on safe haven appeal.
Prices scaled an all-time peak of $4,381.21 on Monday with dips being bought aggressively over the past week. We have seen some volatile pullbacks in that timeframe whenever a fresh high has been printed which could have been a sign of some nerves given the precious metals impressive rally in 2025.
Some of the hesitation and the pullback today may be attributed to profit taking coupled with optimism around a US-China deal. There is also a possibility that market participants may want to unwind some positions ahead of the US inflation data release on Friday.
Analysts at Citi said in a note they expect an end to the ongoing U.S. government shutdown, as well as US-China trade deal announcements, which could further lead to improved sentiment and potentially weigh on Gold prices.
Technical Analysis - Gold (XAU/USD)
From a technical standpoint, Gold did print a double top this morning on the four-hour timeframe with a break below the neckline occurring as well.
Now looking at the potential target prices based on the rules of a double top pattern and the price would be around the $4020/oz mark.
This suggests that Gold's fall may not be over and further downside could materialize in the days ahead.
We could get two scenarios for Gold prices next move. The first one could be a move higher after today's fall which could retest the neckline break around the $4220/oz mark.
Now a rejection at this level could be the start of the next leg to the downside which could see price reach the pattern completion around the $4020 mark.
The second scenario may see Gold bulls fail to push prices higher and thus we could see prices continue to decline immediately toward the $4020/oz target without any pullback.
At this stage both scenarios remain viable and price action on the one-hour and 15-minute charts may be monitored for clues.
Gold (XAU/USD) Daily Chart, October 21, 2025
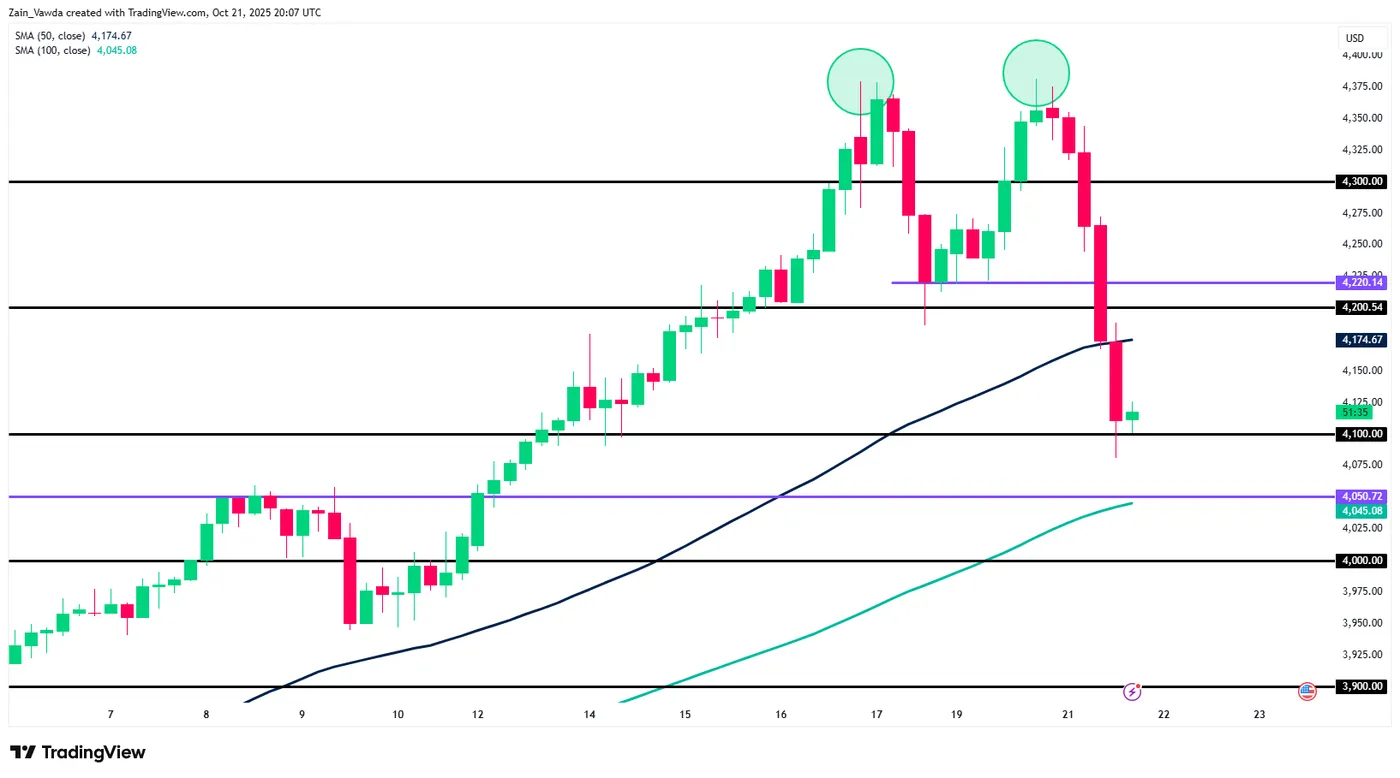
Source: TradingView (click to enlarge)
Client Sentiment Data - XAU/USD
Looking at OANDA client sentiment data and market participants are Long on Gold with 76% of traders net-long. I prefer to take a contrarian view toward crowd sentiment and thus the fact that the majority of traders are net-long suggests that Gold prices could continue to slide in the near-term.
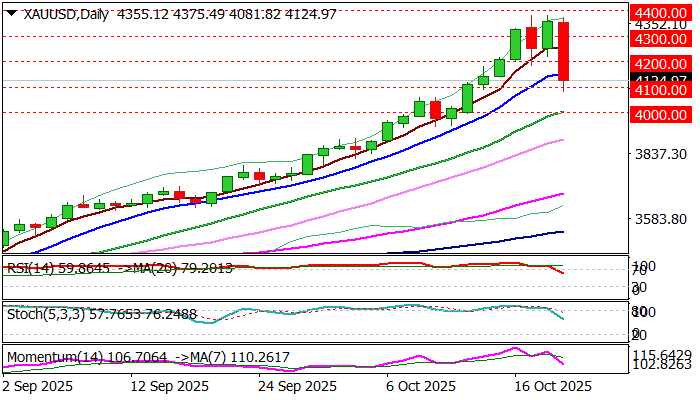
GOLD Registers the Biggest Daily Loss in Five Years as Pullback Accelerated After Violating Key Supports
Gold price collapsed on Tuesday, falling around 6% in the biggest daily drop since 2020, after hitting a series of new record highs in past few sessions.
Correction was not a surprise as daily studies were strongly overbought for some time and the price was capped just under new record high in past few sessions, pointing to corrective action.
Most market observers expected limited action which would be just positioning for fresh push higher, as none of key factors that have driven gold price sharply higher, haven’t registered any significant change.
Solid supports at $4200/$4160 (psychological / daily Tenkan-sen) were expected to hold dips and keep larger bulls intact, however, violation of these supports sparked stronger sell-off, sidelining initial and ideal correction scenario.
Extended dips found firm ground at $4100 so far, with today’s close above this level, to bring some optimism.
On the other hand, large bearish daily candle is expected to weigh, with daily indicators in steep descend but with plenty of space at the downside, suggesting that correction might not be over.
Loss of $4100 handle would expose the breakpoint at $4000 and risk deeper correction if this support is broken.
Alternatively, ability to hold above $4100 would revive some optimism, but lift and sustained break of $4200 barrier will be needed to sideline bears.
Res: 4160; 4200; 4186; 4219
Sup: 4100; 4059; 4000; 3947
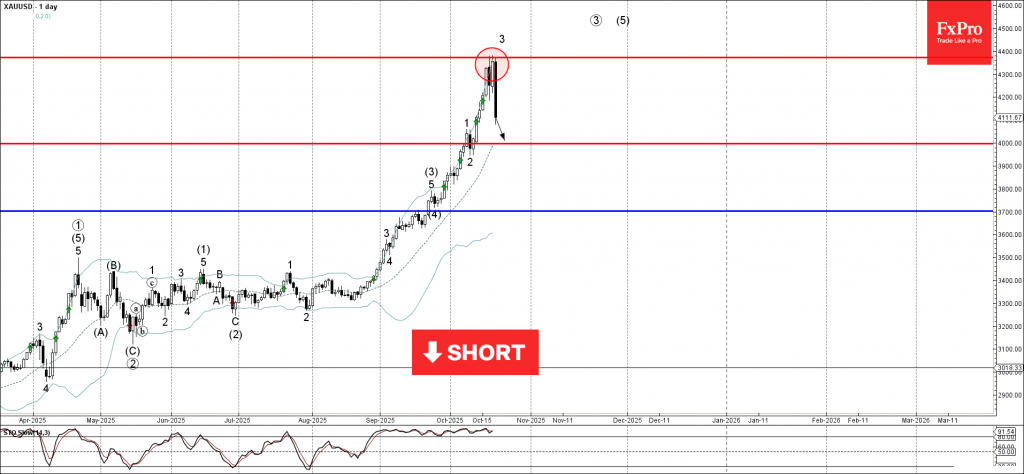
Gold Wave Analysis
Gold: ⬇️ Sell
- Gold reversed from key resistance level 4370.00
- Likely to fall to support level 4000.00
Gold falling strongly after the price made 3rd failed attempt to break above the key resistance level 4370.00 standing well above the upper daily Bollinger Band.
The downward reversal from the resistance level 4370.00 will form the daily Japanese candlesticks reversal pattern Bearish Engulfing – strong sell signal for Gold.
Given the abnormally long period of overbought daily Stochastic, Gold can be expected to fall to the next round support level 4000.00.
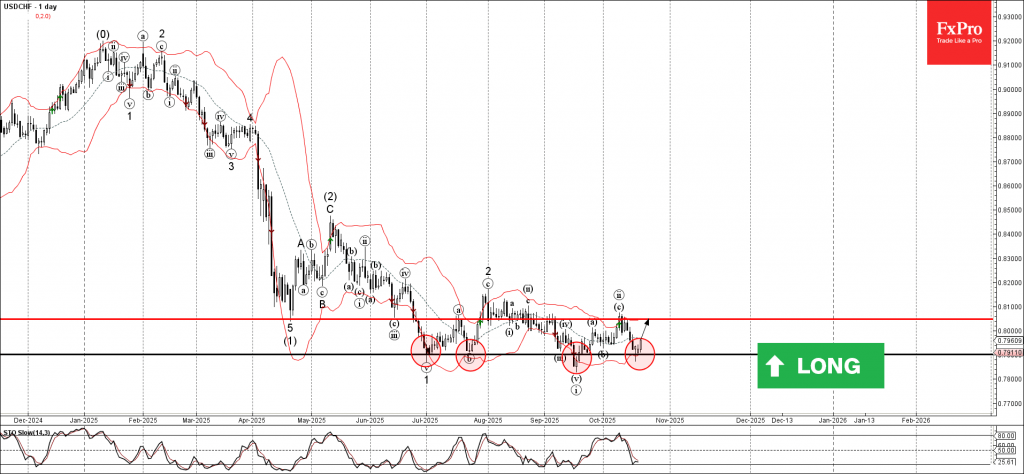
USDCHF Wave Analysis
USDCHF: ⬆️ Buy
- USDCHF reversed from support area
- Likely to rise to resistance level 0.8050
USDCHF currency pair recently reversed from the support area between the powerful multi-month support level 0.7900 (which has been reversing the price from June) and the lower daily Bollinger Band.
The upward reversal from this support zone created the daily Japanese candlesticks reversal pattern Hammer – strong buy signal for this currency pair.
Given the strength of the support level 0.7900, USDCHF currency pair can be expected to rise to the next resistance level 0.8050 (top of the previous correction ii).
Sunset Market Commentary
Markets
Q3 corporate earnings helped risk sentiment recover from recent hiccups related to the US-Sino trade war, French politics and US (regional) banks (credit-losses linked to fraud-related corporate defaults). And although the rally fizzled compared with yesterday, the EuroStoxx 50 still manages a new step into uncharted territory, taking on the 5700 level for the first time ever. As of last Friday, 86% of companies overshot earnings estimates and nearly 20% of US S&P 500 companies are scheduled to give updates this week. Today, we already retain positive earnings from blue ship companies like 3M, General Motors, Coca Cola, Halliburton and Phillip Morris International with Netflix still reporting after the close. Earnings updates so far don’t align with the overall pessimistic economic sentiment in place related to the aftermath of US tariffs. Or to flip it around: corporate updates suggest that previous economic (doom) scenarios might have been too negative. Bullish equity markets contrast with the more guarded signal coming from (core) bond markets. US yields face difficulties to get away from key support levels across the curve, stretching from 3.43 for the 2-yr over to 4% for the 10-yr to 4.6% for the 30-yr. EU bond yields are in the same way stuck around lowest levels since the start of the summer, especially at the longer end of the curve. Friday’s global PMI surveys (October) are a good barometer for the contrasting stock/bond point of view. The US dollar is better bid today, but gains remain technically insignificant. The trade weighted dollar rises from 98.60 to 98.90 with EUR/USD slipping from 1.1642 to 1.1602. The Japanese yen underperforms (USD/JPY 151.90 from 150.75) on a combination of LDP Takaichi becoming PM and rumours that the BoJ sees no urgency to implement another rate hike at the end of this month. The market implied probability of a move from 0.50% to 0.75% fell from 25% to 2.5%. Assets that recently flourished like the Swiss franc or some commodities (gold/silver) ran out of steam today. EUR/CHF bounced off the low 0.92 support area with prices of those two precious metals falling by over 3% and over 5% respectively. In Central-Europe, EUR/HUF holds below the 390-handle after the central bank kept its policy rate unchanged at 6.5%. They kept to the message that tight monetary conditions are warranted given the necessity of anchoring inflation expectations. The path forward is careful and patient. MNB governor Varga is committed to keep making independent monetary decisions. That’s a strong message to the Hungarian government after PM Orban, at risk of losing parliamentary elections next year, applied pressure on the central bank earlier this month to pursuit a more growth-supportive policy.
News & Views
The head of Sweden’s central bank is urging policymakers to quickly return to budgetary discipline and return to its fiscal framework. Sweden’s political parties agreed to temporarily suspend strict spending rules so that they can honor their obligations after having joined NATO in 2024. The country committed to spend 3.5% of GDP on defense and a further 1.5% on civil defense with both being excluded from the normal budget. Riksbank governor Thedeen said it’s not a problem right now – Sweden has a low debt ratio of around 33% - but he sees the lack of a clear plan to return to orthodoxy as a warning signal. The political parties across the spectrum have earmarked 2035 to return to balanced public finances but kept out the details on how to do so.
Canadian inflation unexpectedly rose by 0.1% m/m last month, pushing the yearly reading from 1.9% to 2.4% (2.2% expected). Underlying gauges (median, trimmed mean) accelerated as well and more than analysts had penciled in. The main contributors were grocery prices, which rose 4% y/y, and shelter costs, up 2.6%. Gasoline prices, though still down 4.1% annually, declined less sharply than in August (-12.7%) due to base effects: price fell 7.1% m/m in September 2024 vs +1.9% in 2025. Travel tour prices also fell less than in previous months. The numbers complicate matters for the Bank of Canada. Its quarterly survey published yesterday virtually gave an all clear for another rate cut (to 2.25%) at the October 29 meeting with lingering trade tensions and tariffs reported to weigh on sentiment and activity. Markets scale back the implied probability from 75% to 65% currently, lifting front end yields by a couple of basis points. USD/CAD eases marginally towards the 1.40 barrier.
Canada: Inflation Ticks Higher, Surpassing Expectations, as Underlying Inflation Fails to Moderate
Headline CPI inflation for September came in at 2.4% year-on-year (y/y), ahead of expectations for a 2.2% y/y print. September's reading was up from 1.9% in August.
Gasoline prices again provided a smaller drag to the headline, down 4.1% y/y from -12.7% last month. On a monthly basis, prices rose 1.9%, with refinery disruptions and maintenance in North America cited as factors.
A monthly rise in travel services prices in September, rather than the typical decline, flipped the annual price change to +1.3% y/y from -9.3% y/y in August.
Measures of underlying inflation were a mixed bag, either ticking higher or remaining unchanged in September. The Bank of Canada's (BoC) CPI-trim measure rose to 3.1% y/y (3.0% in August), while the CPI-median index was unchanged at 3.2% y/y. The CPI excluding food and energy was unchanged at 2.4% y/y and the CPI excluding the eight most volatile components and indirect taxes (CPIX) rose to 2.8% y/y from 2.6% in August. On a three-month annualized, seasonally adjusted basis the CPIX (+2.3%), CPI ex. food and energy (1.6%) and CPI-median (+2.8%) were all unchanged in September, while the CPI-trim rose to 2.6% from 2.4% in August.
Key Implications
Underlying inflation appears to have firmed up in the past two months, but it remains within the Bank of Canada's target range. One hotter-than-expected month does not a new trend make, but it is worth monitoring whether the strength in price pressures is indicative of ongoing consumer resilience.
The Bank of Canada should still have room to deliver another cut. The economic outlook is fraught with risks, and the elevated unemployment rate reflects an economy with ample slack – something yesterday's Business Outlook Survey reinforced. Markets seem to agree, pricing the odds for an October cut at 69%, just a smidge lower than the 77% pre-release.
USD/JPY Mid-Day Outlook
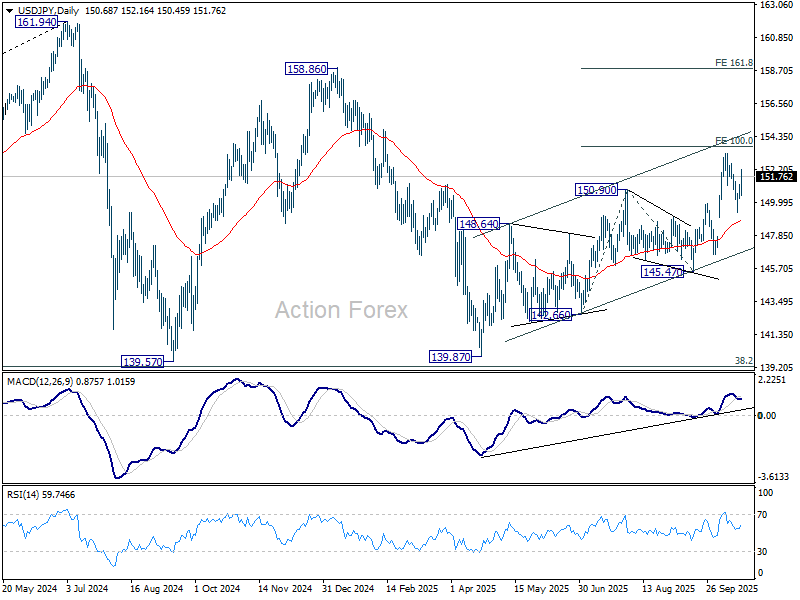
Daily Pivots: (S1) 150.29; (P) 150.75; (R1) 151.21; More...
Intraday bias in USD/JPY remains on the upside at this point. Rise from 139.87 is likely resuming. Firm break of 100% projection of 142.66 to 150.90 from 145.47 at 153.71 would prompt upside acceleration to 161.8% projection at 158.80. On the downside, however, below 149.37 will target 55 D EMA (now at 148.78) instead.
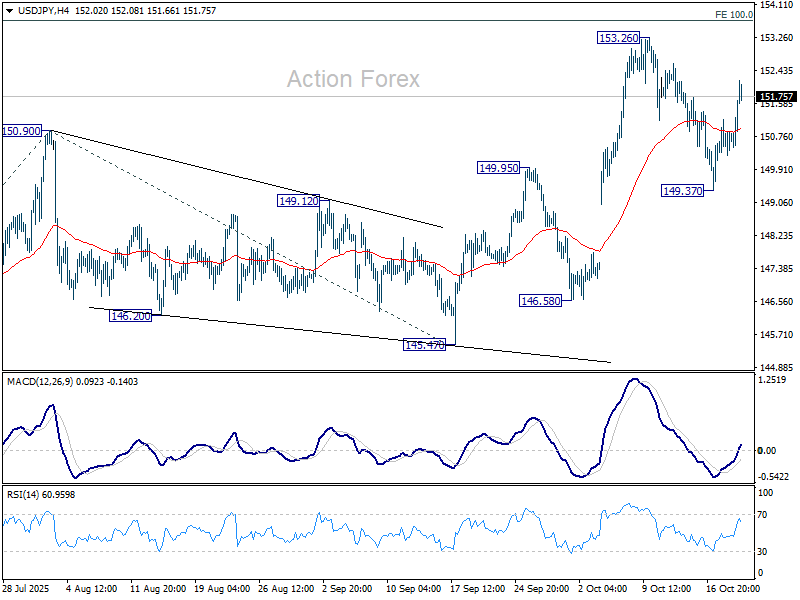
In the bigger picture, current development suggests that corrective pattern from 161.94 (2024 high) has completed with three waves at 139.87. Larger up trend from 102.58 (2021 low) could be ready to resume through 161.94 high. On the downside, break of 145.47 support will dampen this bullish view and extend the corrective pattern with another falling leg.