Sample Category Title
AUD/USD Daily Report
Daily Pivots: (S1) 0.6492; (P) 0.6506; (R1) 0.6528; More...
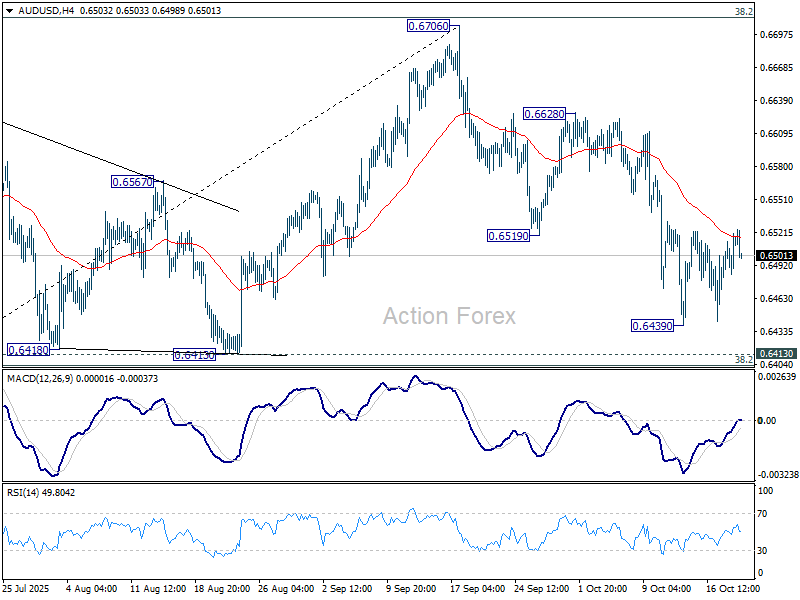
AUD/USD is staying in consolidations above 0.6439 and intraday bias remains neutral. Further decline is in favor as long as 55 D EMA (now at 0.6542) holds. Below 0.6439 will target 0.6413 cluster support (38.2% retracement of 0.5913 to 0.6706 at 0.6403. Decisive break there will indicate bearish reversal after rejection by 0.6713 fibonacci level. Nevertheless, sustained trading above 55 D EMA will keep the rise from 0.5913 intact, and bring retest of 0.6706 high.
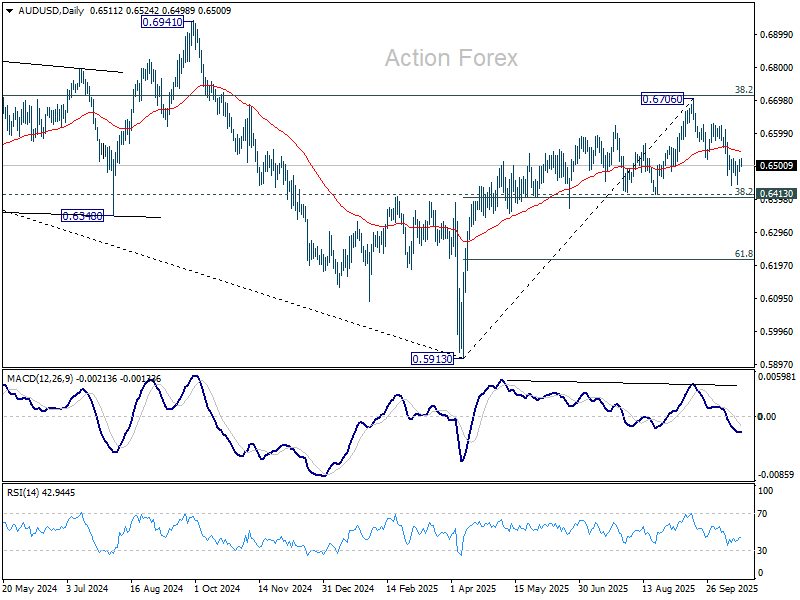
In the bigger picture, there is no clear sign that down trend from 0.8006 (2021 high) has completed. Rebound from 0.5913 is seen as a corrective move. Outlook will remain bearish as long as 38.2% retracement of 0.8006 to 0.5913 at 0.6713 holds. Nevertheless, considering bullish convergence condition in W MACD, sustained break of 0.6713 will be a strong sign of bullish trend reversal, and pave the way to 0.6941 structural resistance for confirmation.
USD/CAD Daily Outlook
Daily Pivots: (S1) 1.4014; (P) 1.4032; (R1) 1.4059; More...
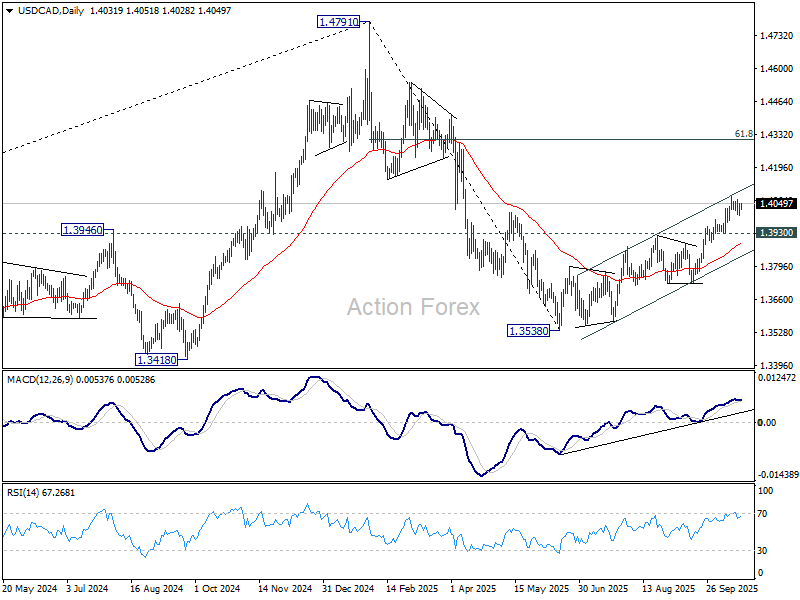
USD/CAD is still extending consolidations below 1.4078 and intraday bias stays neutral. Further rally is expected as long as 1.3930 support holds. Current development suggest that rise from 1.3538 is reversing whole fall from 1.4791. Above 1.4078 will target 61.8% retracement of 1.4791 to 1.3538 at 1.4312.
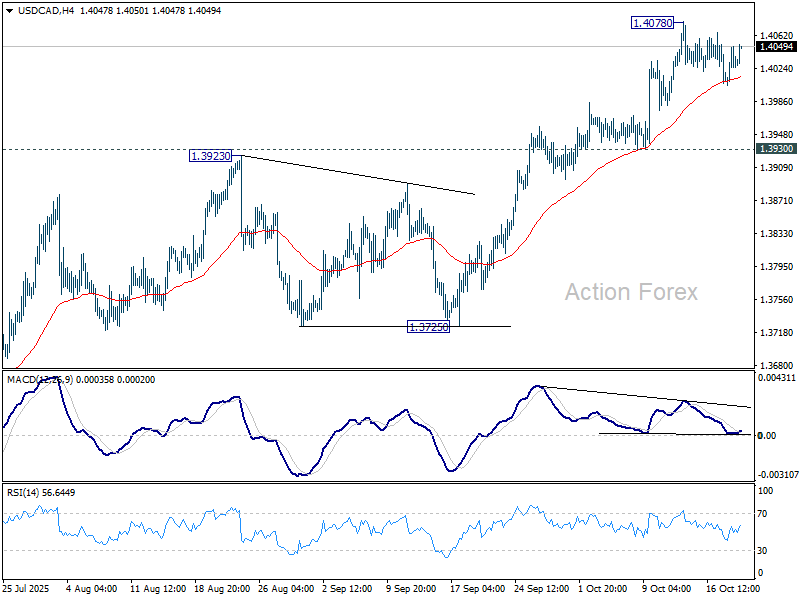
In the bigger picture, price actions from 1.4791 medium term top is likely just unfolding as a correction to up trend from 1.2005 (2021 low). Based on current momentum, rise from 1.3538 is the second leg, and a third leg should follow before up trend resumption. That is, range trading is set to extend for the medium term. For now, this will remain the favored case as long as 1.3725 support holds.
GBP/JPY Daily Outlook
Daily Pivots: (S1) 201.58; (P) 202.35; (R1) 202.86; More...
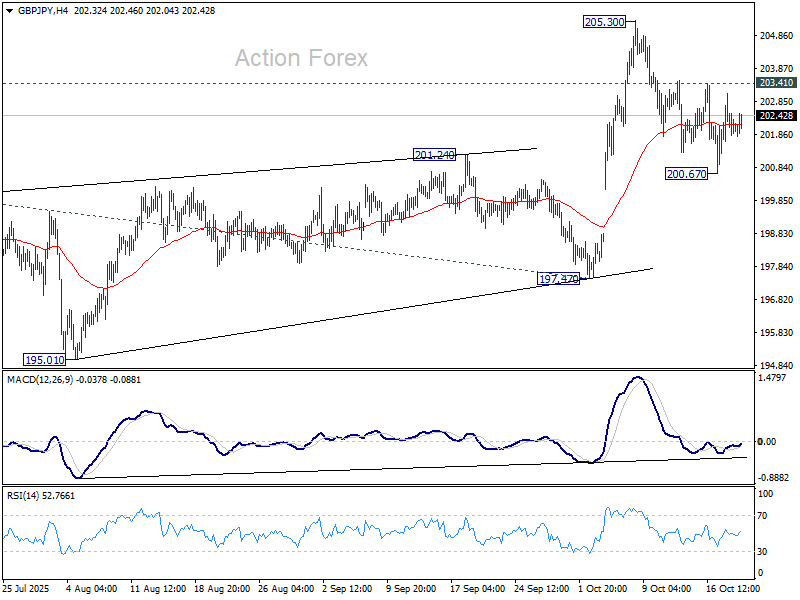
Outlook in GBP/JPY is unchanged and intraday bias stays neutral. On the upside, above 203.41 will suggest that pullback from 205.30 has completed, and bring retest of this high. Firm break there will resume larger rally to 61.8% projection of 184.35 to 199.96 from 197.47 at 207.11. However, break of 200.67 and sustained trading below 201.24 resistance turned support will raise the chance of bearish reversal, and bring deeper decline to 197.47 instead.
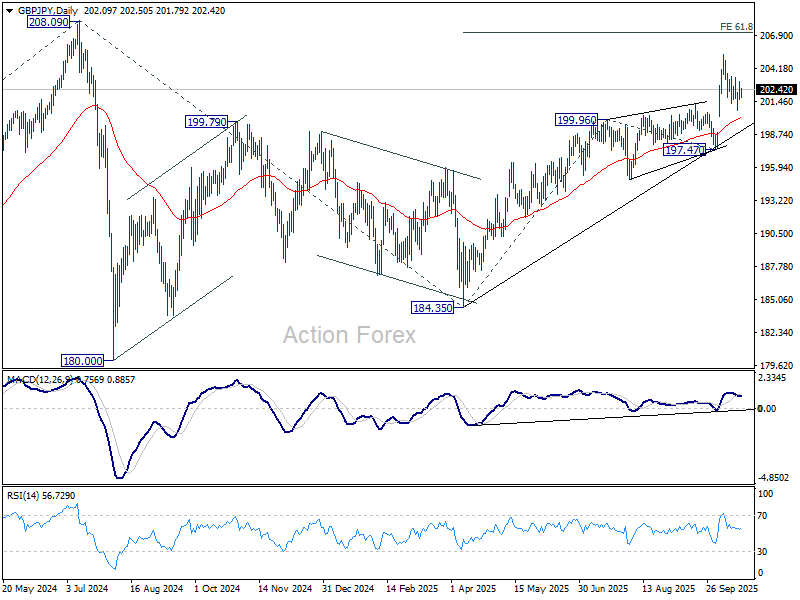
In the bigger picture, price actions from 208.09 (2024 high) are seen as a corrective pattern which might have completed at 184.35. Firm break of 208.09 high will resume the up trend from 123.94 (2020 low). Next target is 61.8% projection of 148.93 to 208.09 from 184.35 at 220.90. However, decisive break of 197.47 will dampen this view and could extend the corrective pattern with another fall.
EUR/JPY Daily Outlook
Daily Pivots: (S1) 175.07; (P) 175.72; (R1) 176.19; More...
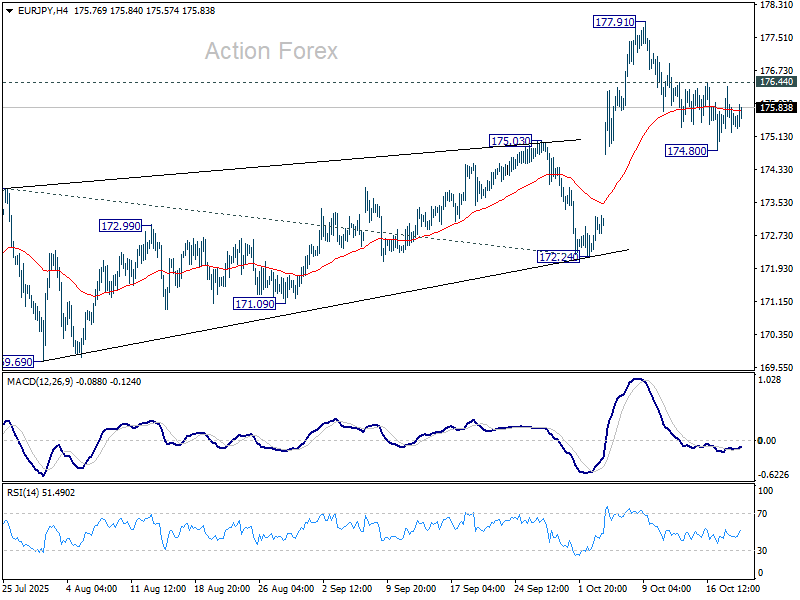
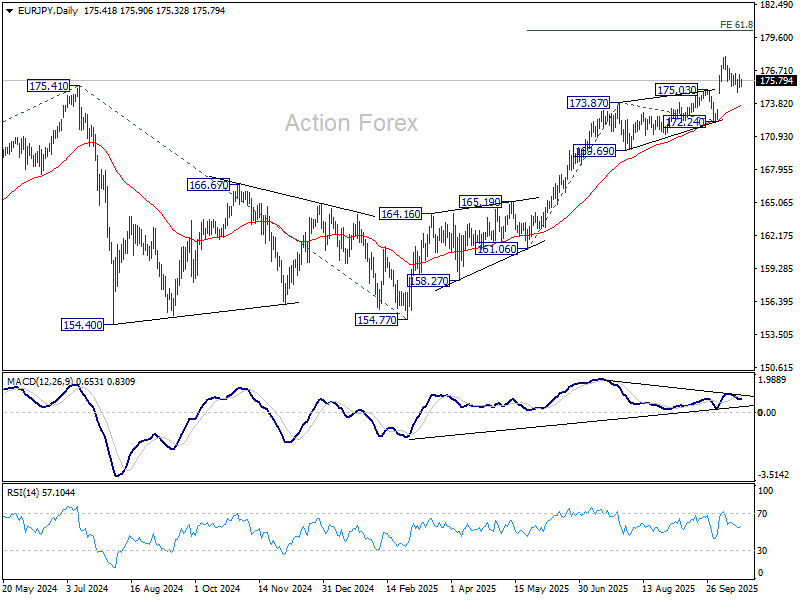
No change in EUR/JPY's outlook and intraday bias stays neutral. On the upside, break of 176.44 resistance will suggest that pullback from 177.91 has completed, and bring retest of this high. Further break of 177.91 will resume larger up trend to 61.8% projection of 161.06 to 173.87 from 172.24 at 180.15 next. However, break of 174.80 and sustained trading below 175.03 resistance turned support will indicate that it's already in a larger scale correction, and target 172.24 support.
In the bigger picture, up trend from 114.42 (2020 low) is in progress and should target 61.8% projection of 124.37 to 175.41 from 154.77 at 186.31. Firm break of 172.24 support will suggests that it has turned into consolidations again. But still, outlook will continue to stay bullish as long as 55 W EMA (now at 167.43) holds, even in case of deep pullback.
EUR/GBP Daily Outlook
Daily Pivots: (S1) 0.8676; (P) 0.8686; (R1) 0.8695; More…
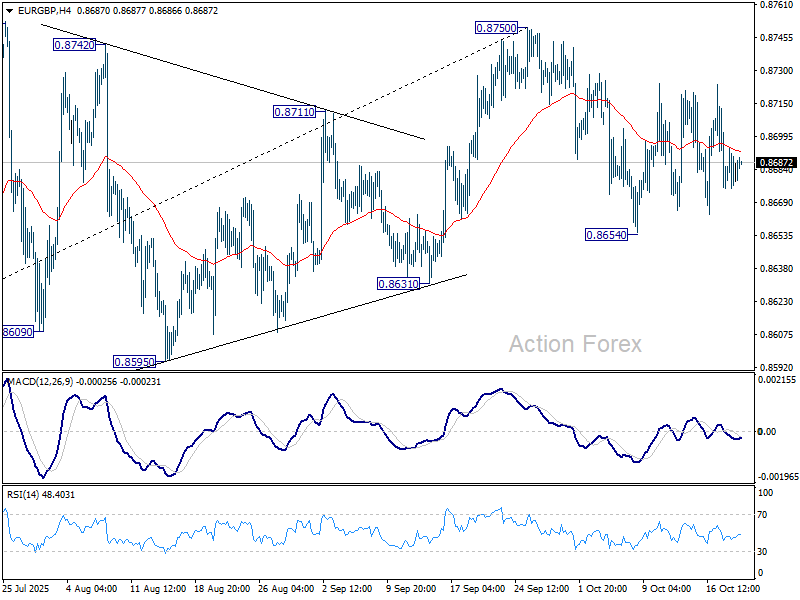
Intraday bias in EUR/GBP remains neutral as sideway trading continues. On the downside, break of 0.8654 will resume the fall from 0.8750. Decisive break there will indicate bearish reversal and target 38.2% retracement of 0.8221 to 0.8750 at 0.8548. Nevertheless, on the upside, break of 0.8750/2 will resume the rise from 0.8221 towards 0.8867 fibonacci level.
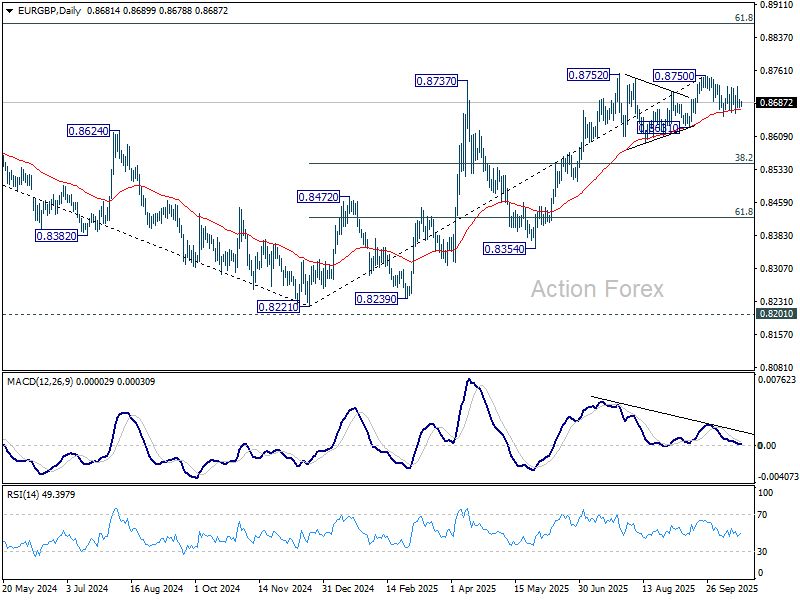
In the bigger picture, rise from 0.8221 medium term bottom is seen as a corrective move. While further rally cannot be ruled out, upside should be limited by 61.8% retracement of 0.9267 to 0.8221 at 0.8867. Considering bearish divergence condition in D MACD, firm break of 0.8631 support will be the first sign that this corrective bounce has completed. Sustained trading below 55 W EMA (now at 0.8549) will confirm, and bring retest of 0.8221 low.
EUR/AUD Daily Outlook
Daily Pivots: (S1) 1.7838; (P) 1.7907; (R1) 1.7945; More...
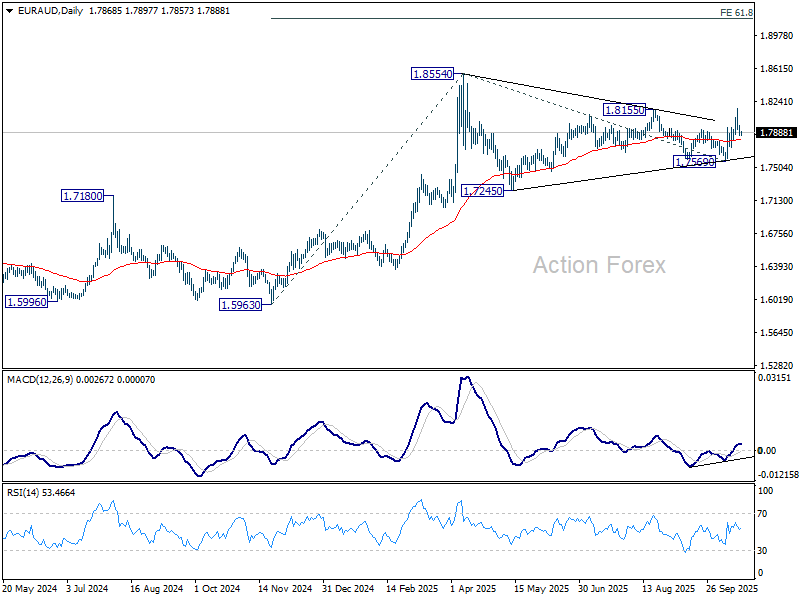
Intraday bias in EUR/AUD stays neutral at this point, and further rally is in favor as long as 1.7818 support holds. On the upside, above 1.7965 minor resistance will bring retest of 1.8160 first. Sustained break of 0.8155 resistance will affirm the case that larger up trend is resuming. Further rise should be seen to retest 1.8554 high next. However, break of 1.7818 will dampen this bullish view and turn focus back to 1.7569 support instead.
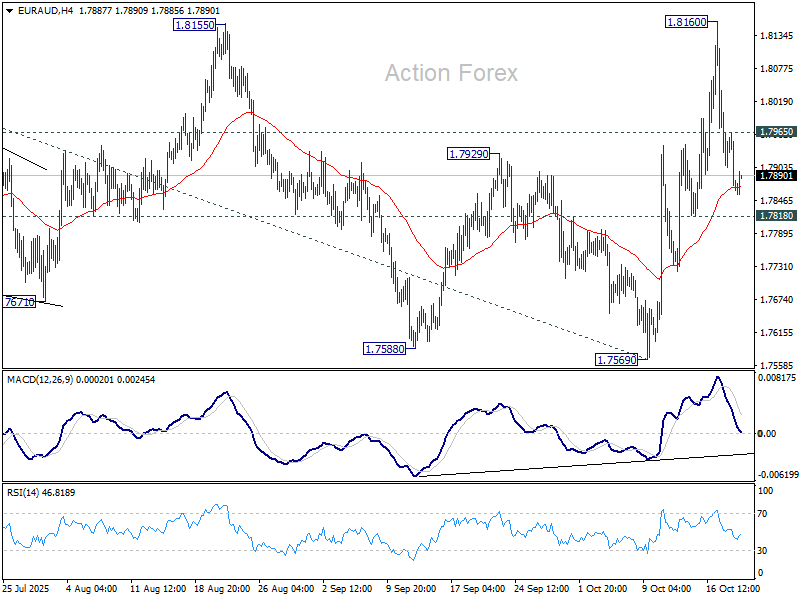
In the bigger picture, price actions from 1.8554 medium term top are seen as a corrective pattern, which might have completed already. Firm break of 1.8554 will resume larger up trend from 1.4281 (2022 low), and target 61.8% projection of 1.5963 to 1.8554 from 1.7569 at 1.9170. Nevertheless, break of 1.7569 support will delay the bullish case and extend the correction from 1.8554.
GBP/USD Recovery Stalls — Risk Of Renewed Decline Grows
Key Highlights
- GBP/USD started a recovery wave above the 1.3350 resistance.
- It cleared a key bearish trend line with resistance at 1.3400 on the 4-hour chart.
- EUR/USD recovered above 1.1650 but failed to clear 1.1730.
- Gold is now consolidating gains near the all-time high at $4,350.
GBP/USD Technical Analysis
The British started a recovery wave from 1.3350 against the US Dollar. GBP/USD managed to surpass 1.3380 and 1.3400 before the bears appeared.
Looking at the 4-hour chart, the pair traded above a key bearish trend line with resistance at 1.3400. It tested the 1.3470 level and the 200 simple moving average (green, 4-hour). The bears seem to be active below the 1.3470 level, and the pair is slowly trimming gains.
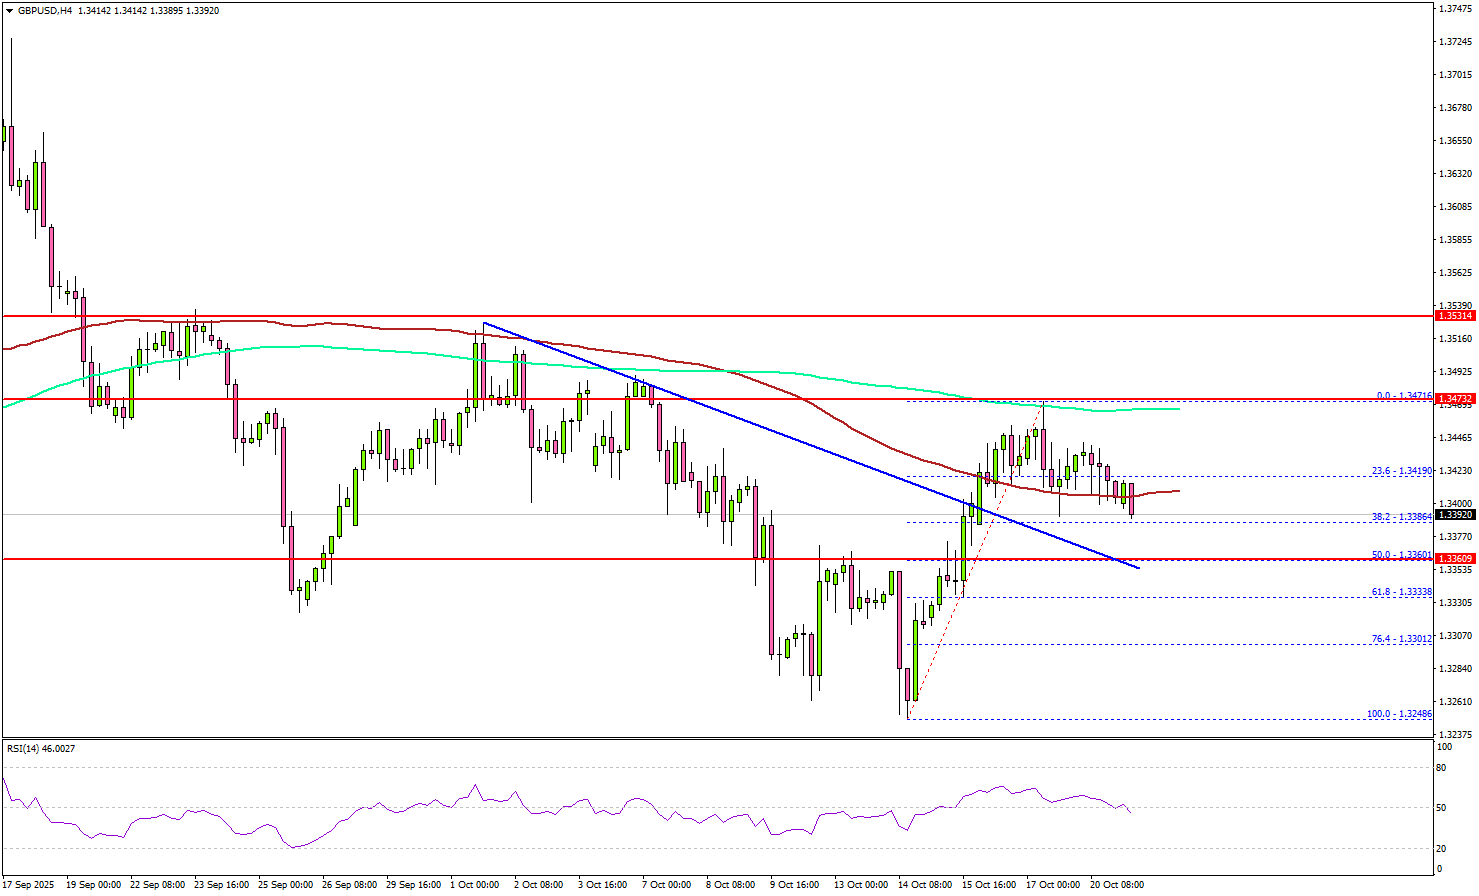
It already dipped below the 23.6% Fib retracement level of the recent increase from the 1.3248 swing low to the 1.3471 high. On the downside, the pair might find support at 1.3380.
The main support might be 1.3360 and the 50% Fib retracement level of the recent increase from the 1.3248 swing low to the 1.3471 high. A close below 1.3360 could start a major pullback toward 1.3300. Any more losses might open the doors for a test of 1.3240.
On the upside, the pair faces resistance near the 1.3470 level and the 200 simple moving average (green, 4-hour). The next hurdle could be near 1.3500. A close above 1.3500 resistance might push the pair to 1.3550.
Looking at EUR/USD, the pair started a recovery wave, but the bears might remain active near the 1.1720 and 1.1730 levels.
Upcoming Key Economic Events:
- ECB's President Lagarde speech.
- Fed's Waller speech.
EUR/CHF Daily Outlook
Daily Pivots: (S1) 0.9208; (P) 0.9234; (R1) 0.9252; More...
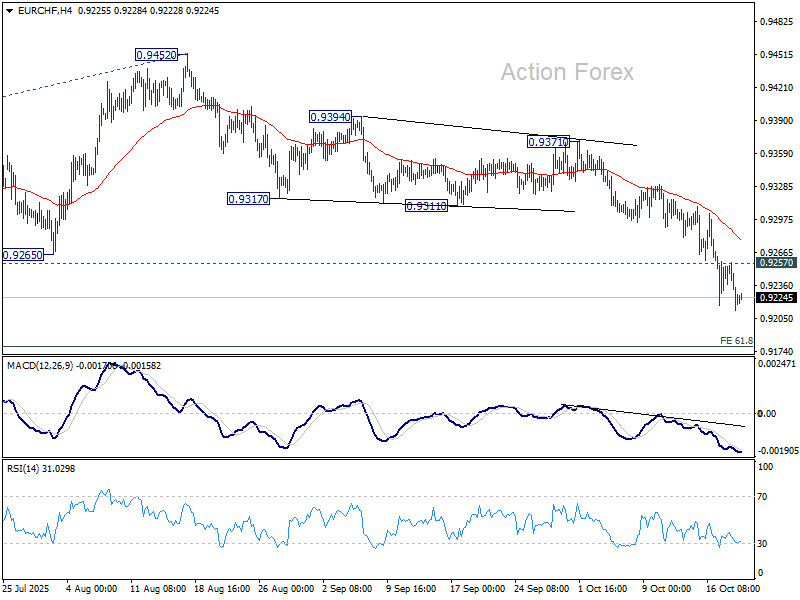
EUR/CHF's decline is in progress and intraday bias stays on the downside for 61.8% projection of 0.9660 to 0.9218 from 0.9452 at 0.9179. Firm break there will target 100% projection at 0.9010. On the upside, above 0.9257 minor resistance will turn intraday bias neutral and bring consolidations. But near term outlook will now stay bearish as long as 0.9311 support turned resistance holds, in case of recovery.
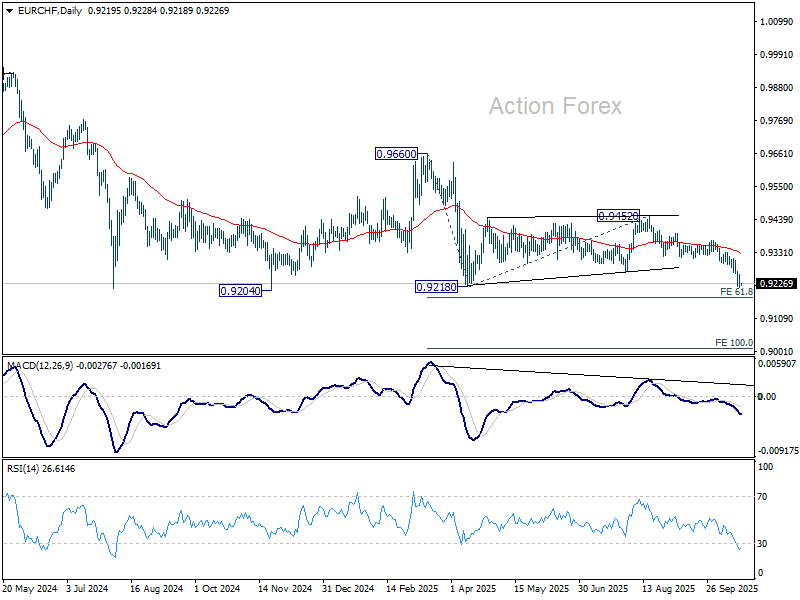
In the bigger picture, outlook remains bearish with EUR/CHF staying well inside long term falling channel after multiple rejection by 55 W EMA (now at 0.9390). Firm break of 0.9204 will resume the whole down trend from 1.2004 (2018 high). Next target is 61.8% projection of 1.1149 to 0.9407 from 0.9928 at 0.8851. Break of 0.9452 resistance is needed to be the first sign of medium term bottoming.
WTI oil to find floor near 55 as oversupply mostly priced in
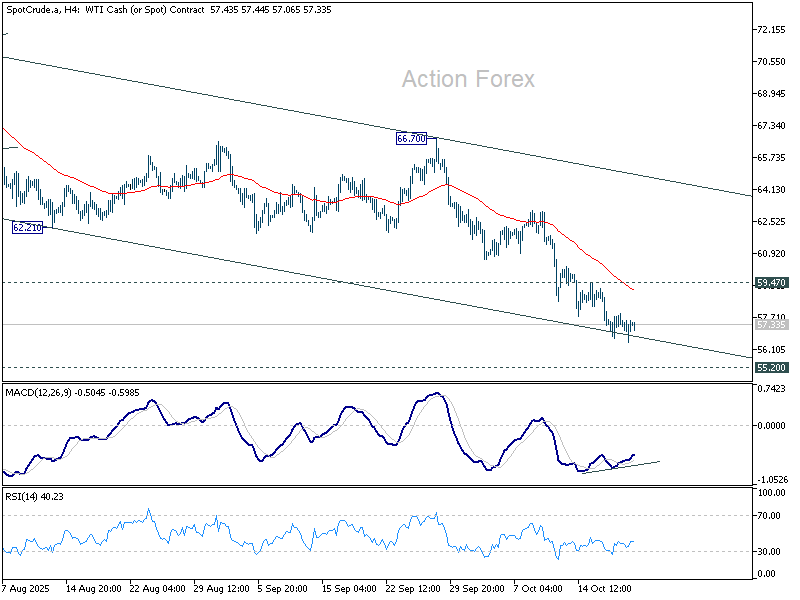
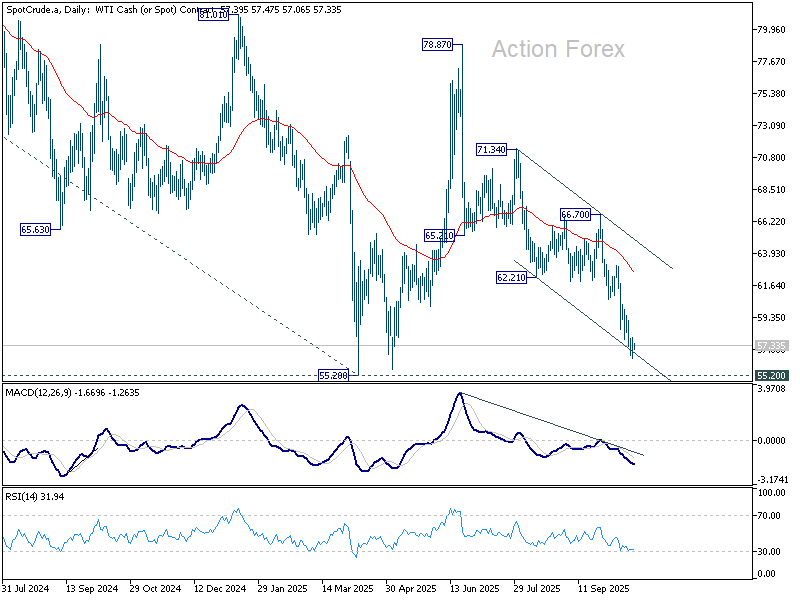
Oil prices continued to drift lower this week but signs are emerging that the pace of decline is easing. With much of the supply glut now likely reflected in prices, there is potential for WTI crude to stabilize around 55 handle, even if near-term weakness extends.
The downtrend persisted since OPEC and its allies started expanding production earlier in the year, and major institutions warn that oversupply may persist well into next year. Last week’s IEA forecast reinforced bearish sentiment, warning that the global oil market could swing into a 4 million barrel-per-day surplus by in. The agency cited sustained output growth and sluggish demand as key drivers.
At the same time, geopolitical backdrop has also turned calmer. Ceasefire between Israel and Hamas helped reduce the Middle East risk premium, dampening prices further as fears of supply disruption fade.
Technically, however, downside momentum in WTI is fading. Bullish convergence is starting to appear in 4H MACD, while WTI is pressing the lower boundary of its near-term descending channel. The 55.20 key support, marking this year’s low from April, may offer strong support and turn WTI into sideway consolidations. Nevertheless, break of 59.47 resistance is needed to indicate short term bottoming, or risk will remain on the downside.
New Zealand trade deficit widens NZD -14B despite strong 19% export growth
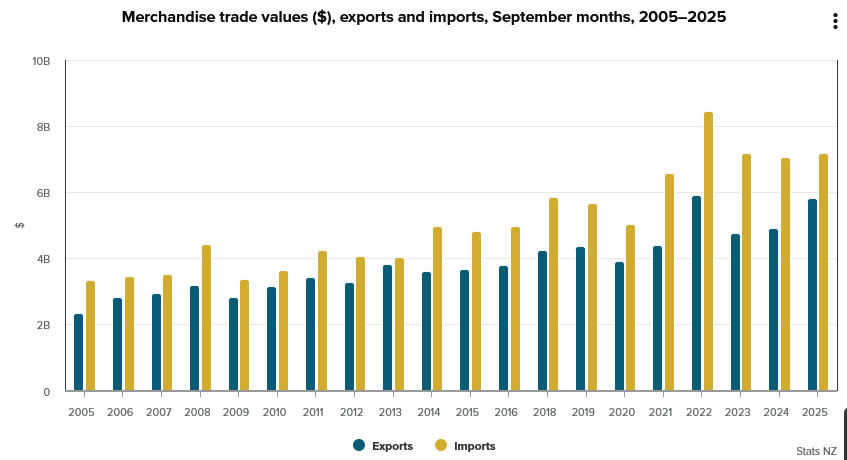
New Zealand recorded another sizeable trade deficit in September 2025, as import growth outstripped exports despite solid overseas demand. Statistics NZ data showed goods exports rose 19% yoy to NZD 5.8B. Imports increased 1.6% yoy to NZD 7.2B. The result was a monthly deficit of NZD -1.4B, versus expectation of NZD -6B and prior month's NZD -1.2B.
Export strength was broad-based, led by double-digit gains to all major partners. Shipments to China jumped 24% yoy, Australia 28%, and Japan 23%, while sales to the U.S. and EU rose 10% and 15%, respectively.
On the import side, purchases from China climbed 16% yoy, while inflows from the EU and Australia rose 7.3% and 6.4%. Offsetting that, imports from the U.S. slumped -30%, and South Korea fell -4.8%.