
Sample Category Title
USD/CHF Mid-Day Outlook
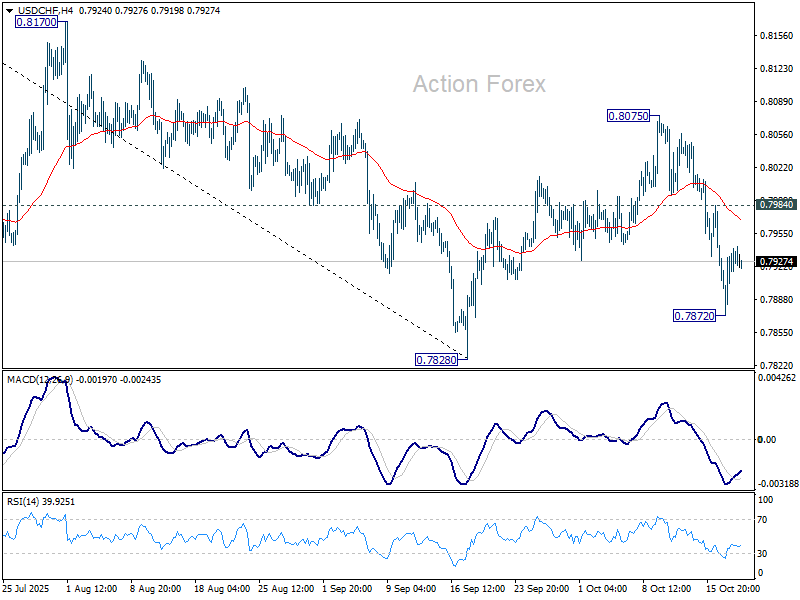
Daily Pivots: (S1) 0.7893; (P) 0.7916; (R1) 0.7958; More…
Range trading continues in USD/CHF and intraday bias stays neutral. Further decline is expected as long as 0.7984 resistance holds. On the downside, below 0.7872 will bring retest of 0.7828. Firm break there will resume larger down trend. However, break of 0.7984 will suggest that corrective pattern from 0.7828 is extending with another rising leg, and target 0.8075 again.
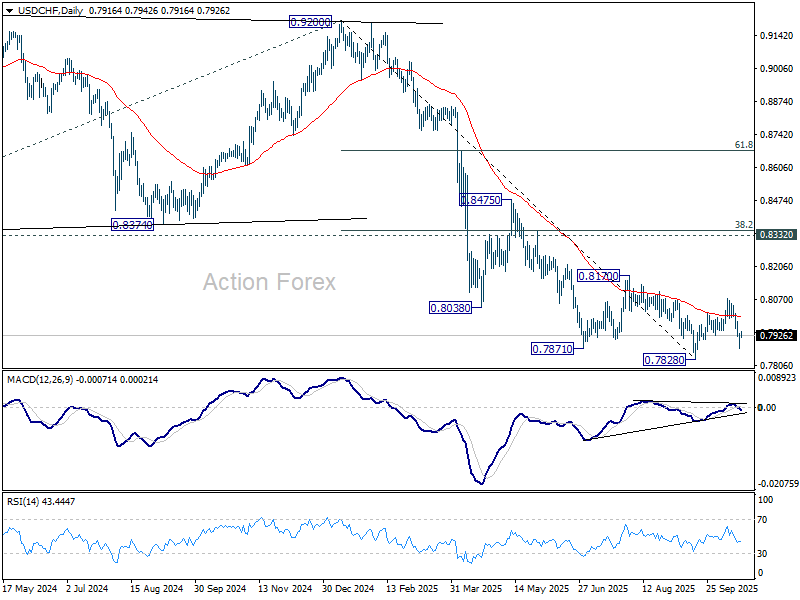
In the bigger picture, long term down trend from 1.0342 (2017 high) is still in progress. Next target is 100% projection of 1.0146 (2022 high) to 0.8332 from 0.9200 at 0.7382. In any case, outlook will stay bearish as long as 0.8332 support turned resistance holds (2023 low).
Markets Edge Higher as Shutdown Deal Hopes Lift Sentiment
Global markets traded with a mildly positive tone as investors entered the U.S. session on Monday, buoyed by some optimism that the prolonged government shutdown could end within days. U.S. top White House economic adviser Kevin Hassett said on CNBC that a resolution was “likely to end sometime this week,” citing signals from the Senate that moderate Democrats may soon move to reopen the government after nationwide “No Kings” protests over the weekend.
Hassett also warned that if talks stall, the administration may adopt “stronger measures” to push Democrats toward cooperation. But markets appeared focused more on the potential for compromise than confrontation. His comments gave a modest lift to risk sentiment, helping equities stabilize after last week’s volatility.
Overall, investors appear cautiously optimistic but reluctant to chase risk ahead of confirmation that the US government will indeed reopen. A successful deal this week could add momentum to equities and higher-yielding currencies in the near term, while any renewed political brinkmanship might quickly unwind the fragile calm currently seen across global markets.
In forex markets, direction remained limited. Kiwi outperformed, followed by Swiss Franc and Dollar. Loonie was the weakest of the majors, trailed by Aussie and Yen, while Euro and Sterling traded largely sideways in the middle of the pack.
In Europe, at the time of writing, FTSE is up 0.38%. DAX is up 1.48%. CAC is up 0.15%. UK 10-year yield is down -0.025 at 4.512. Germany 10-year yield is up 0.001 at 2.585. Earlier in Asia, Nikkei rose 3.37%. Hong Kong HSI rose 2.42%. China Shanghai SSE rose 0.63%. Singapore was on holiday. Japan 10-year JGB yield rose 0.037 to 1.669.
BoJ's Takata repeats call for rate hike warns inflation risks overshooting
BoJ board member Hajime Takata reinforced his hawkish stance today, arguing that Japan has roughly achieved the 2% inflation goal and now risks overshooting it. In a speech, Takata said steady gains in wages and prices show the economy is strong enough to withstand further normalization, calling the current environment a “prime opportunity to raise interest rates.”
Takata was one of two board members who dissented at the September meeting, when the BoJ voted to keep its policy rate at 0.5%. He instead proposed a 25bps hike to 0.75%.
Citing the BOJ’s October Tankan survey and feedback from branch managers, Takata said improvements in employment and income are supporting private consumption. He emphasized that both wage and price-setting behaviors have changed materially, signaling that Japan’s economy has entered a new phase after decades of deflationary mindset.
NZ CPI jumps to 3% in Q3, hits top of RBNZ target band
New Zealand’s inflation pulse picked up in the Q3, highlighting lingering price pressures that could restrain the RBNZ from cutting rates too aggressively. Headline CPI rose 1.0% qoq, above forecasts of 0.8% and sharply higher than 0.5% pace in Q2. On an annual basis, inflation climbed from 2.7% yoy to 3.0% yoy, matching expectations but reaching the top of the central bank’s target band and its highest level since mid-2024.
Much of the rebound came from tradeable prices, which rose 2.2% yoy versus 1.2% previously, suggesting imported cost pressures are resurfacing. By contrast, non-tradeable inflation eased slightly from 3.7% yoy to 3.5%, hinting at some moderation in domestic demand.
Even so, the composition of inflation is concerning: housing and utilities accounted for nearly one-third of the total rise in the annual CPI. Electricity prices jumped 11.3%, rents increased 2.6%, and local authority rates surged 8.8%.
With these three categories making up just 17% of the CPI basket, the data underline how sticky living costs have become. For the RBNZ, which only recently delivered an outsized 50bps rate cut to counter slowing growth, this renewed inflation uptick narrows its policy flexibility.
China GDP growth slows to 4.8% in Q3, property slump deepens
China’s GDP expanded 4.8% yoy in the Q3, the slowest pace in a year but still slightly ahead of expectations for 4.7%. Even so, with cumulative growth of 5.2% over the first nine months, China remains on track to meet its full-year target of “around 5%”.
Industrial production provided a bright spot, climbing 6.5% yoy in September, up sharply from August’s 5.2% and well above expectations of 5.0%. Retail sales also beat expectations of 2.9% yoy slightly, rising 3.0% even as the pace slowed from 3.4%, pointing to modest resilience in consumption.
Yet beneath the surface, the investment picture deteriorated further. Fixed-asset investment slipped -0.5% year-to-date yoy. Property investment fell -13.9%, extending the sector’s prolonged drag on growth. Private investment declined -3.1%, marking a deeper contraction than earlier in the year, and even ex-property investment slowed from 4.2% to 3.0% growth.
The data reaffirm that while parts of the industrial economy are stabilizing, domestic demand and investor sentiment remain fragile.
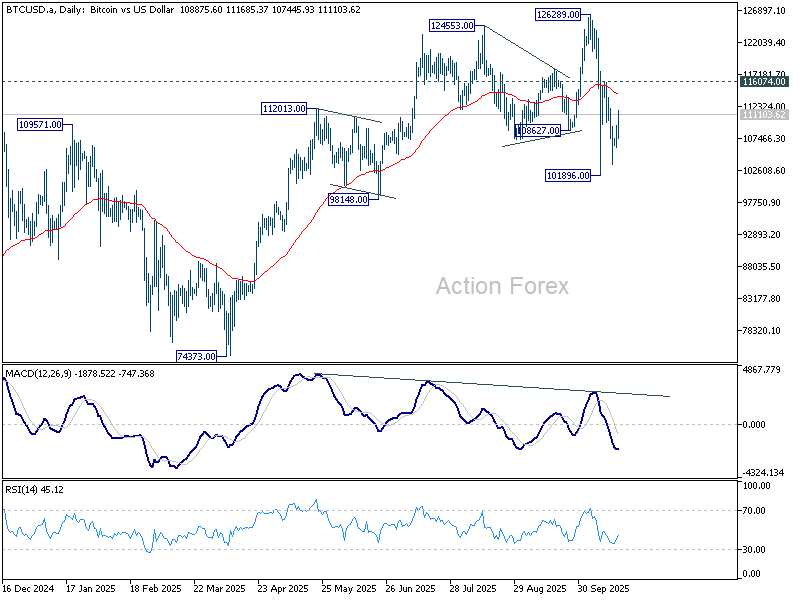
Bitcoin rebounds as market panic fades, consolidations seen between 101K–126K
Bitcoin rebounded sharply on Monday, regaining some footing after a two-week selloff driven by risk aversion across global markets. The recovery came as sentiment stabilized following an intense stretch of macro headwinds — including U.S. President Donald Trump’s renewed tariff threats on China and escalating worries over regional banks’ exposure to bad loans. Even expectations of Fed rate cuts failed to cushion the selloff.
With risk appetite showing tentative signs of recovery, Bitcoin rebounded alongside equities and other higher-beta assets. The technical picture, however, is not totally bullish.
The earlier break below 108,627 support confirmed that rise from 74,373 to 126,289 has likely completed its five-wave advance. Tentatively, price action from 126,289 is viewed as consolidations to the rise from 74,373 only.
A push above 116,074 would reinforce this view, and set up the range for the corrective pattern between 101,896 and 126,289. That would imply scope for further consolidation before another run to record highs. The structure suggests the market is resetting rather than reversing.
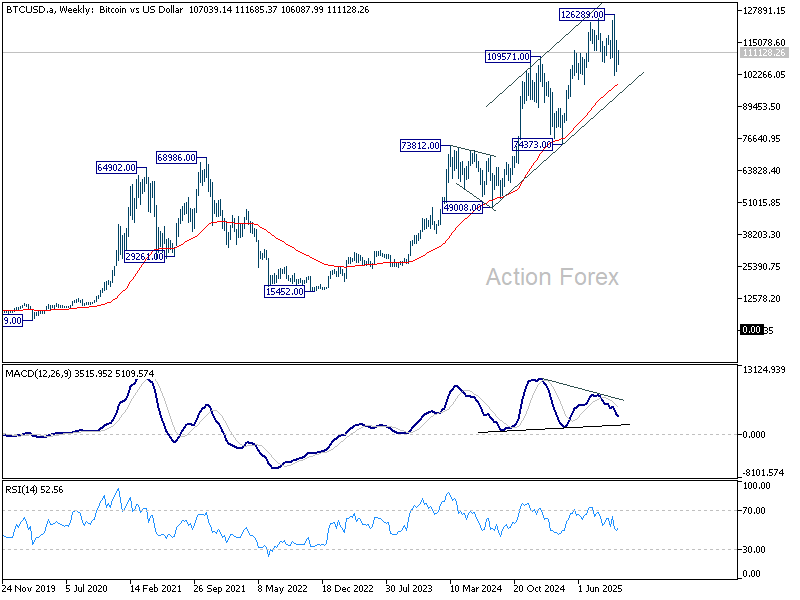
However, the broader trend shows signs of fatigue. W MACD continues to display bearish divergence, warning that upward momentum is fading. A break below 101,896 would put 55 W EMA (now at 96,913) in focus. Sustained move under that level would suggest a deeper correction of the entire uptrend from the 2022 low of 15,452.
USD/CHF Mid-Day Outlook
Daily Pivots: (S1) 0.7893; (P) 0.7916; (R1) 0.7958; More…
Range trading continues in USD/CHF and intraday bias stays neutral. Further decline is expected as long as 0.7984 resistance holds. On the downside, below 0.7872 will bring retest of 0.7828. Firm break there will resume larger down trend. However, break of 0.7984 will suggest that corrective pattern from 0.7828 is extending with another rising leg, and target 0.8075 again.
In the bigger picture, long term down trend from 1.0342 (2017 high) is still in progress. Next target is 100% projection of 1.0146 (2022 high) to 0.8332 from 0.9200 at 0.7382. In any case, outlook will stay bearish as long as 0.8332 support turned resistance holds (2023 low).
Oil Prices Could Fall Another 15% by the End of the Year
Crude oil prices fell 0.7% on Monday after three consecutive weeks of decline. Global production is growing while global economic growth is slowing, putting pressure on prices. In addition, the risk premium on signing the gas agreement and intensifying efforts to resolve the Ukrainian conflict has begun to decline. At the same time, oil prices are far from oversold, leaving room for further decline in the coming months.
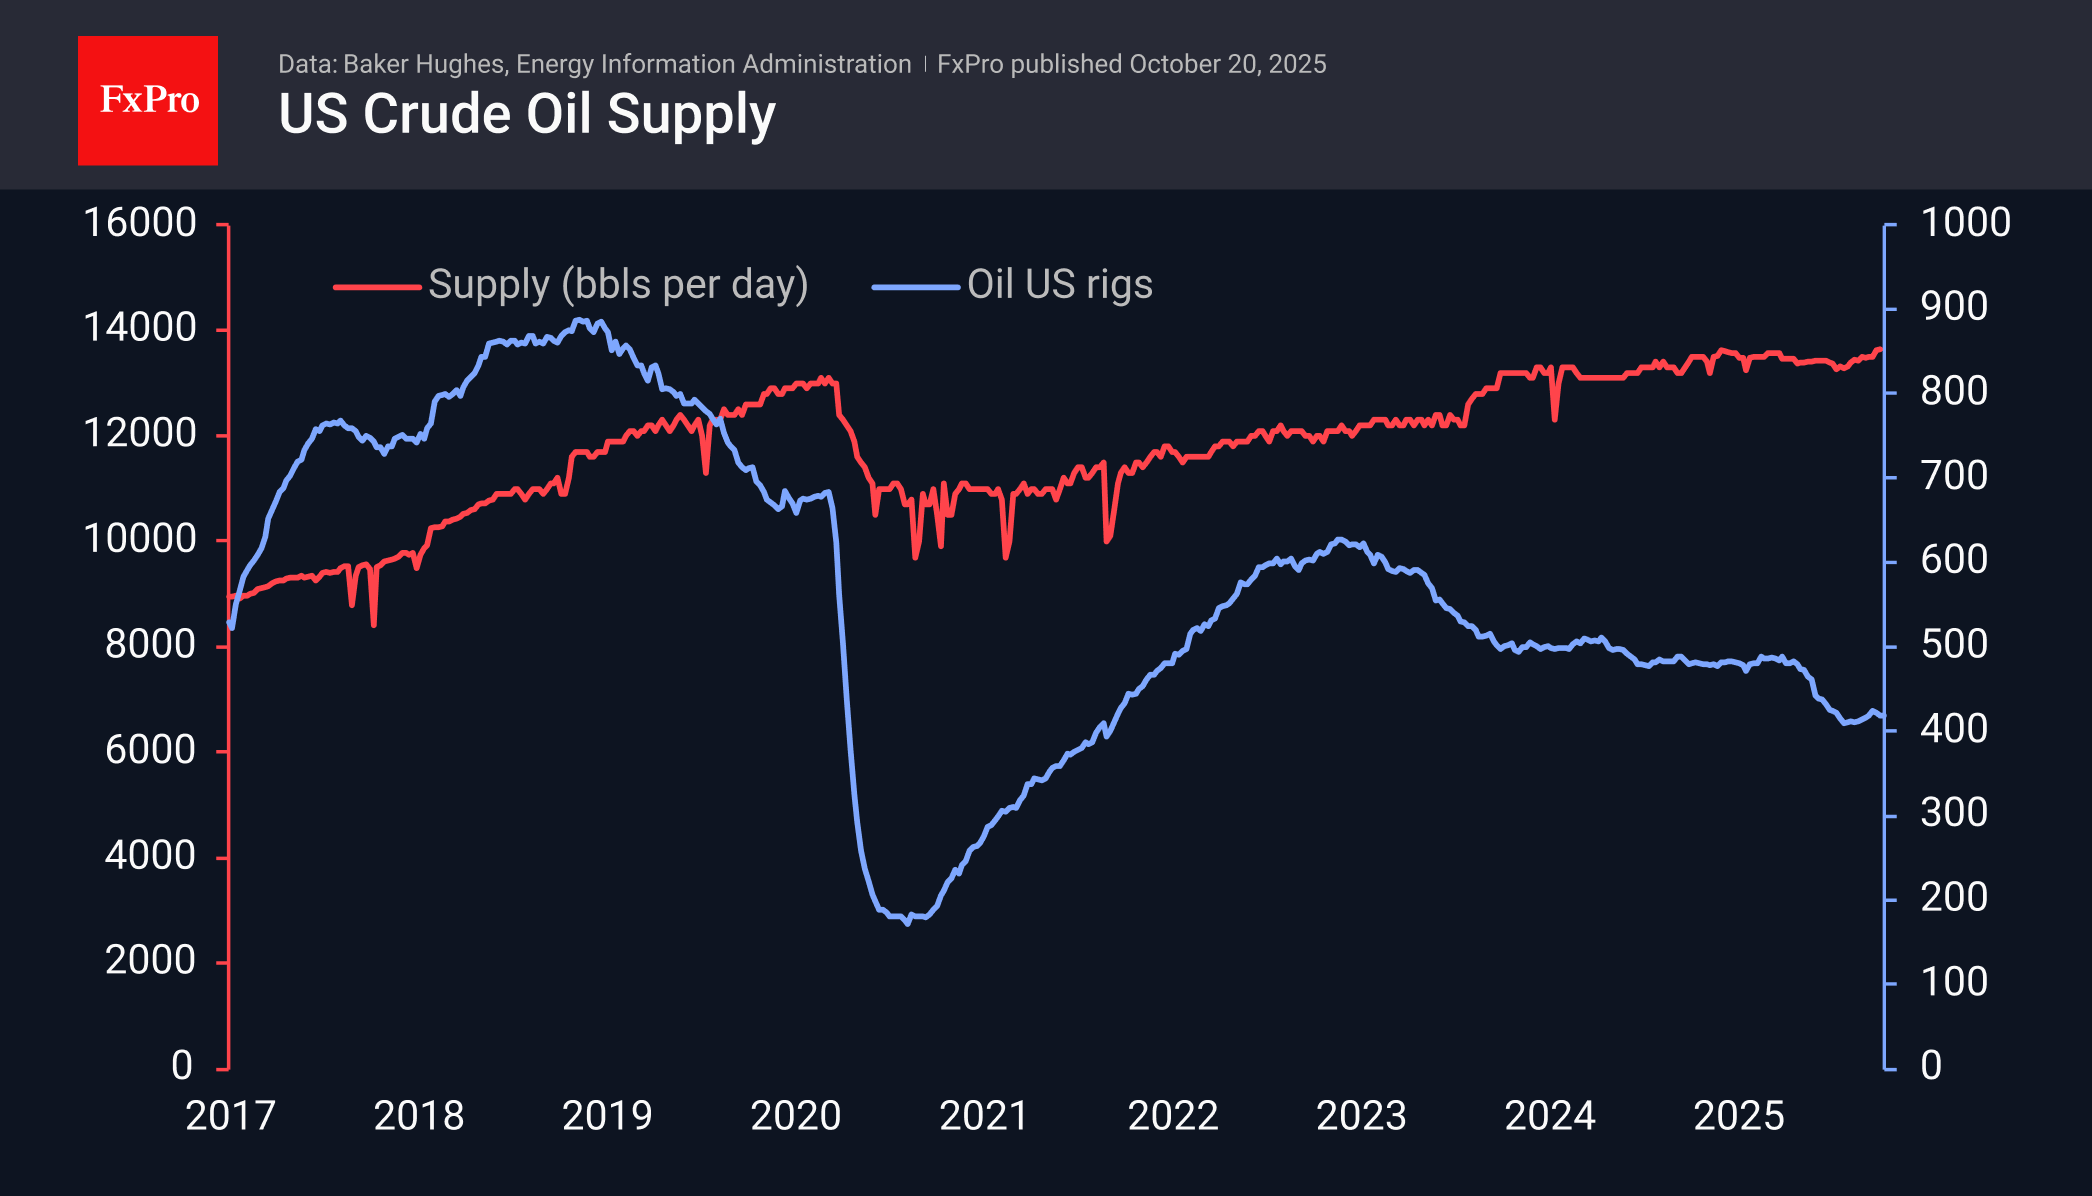
Baker Hughes reported on Friday that 418 oil rigs are operating in the US, the same as a week earlier, undermining the recovery trend seen since August. However, America is increasing production efficiency, extracting more oil from each well.
Bloomberg noted that there are now nearly 1.2 billion barrels of oil at sea, a record since the peak in 2020, when US production was at historic highs and Saudi Arabia and Russia were fighting for market share, boasting of their potential.
The current situation strongly resonates with what happened more than five years ago. The latest weekly data showed a record high in daily production in the US, with supplies of 13.64 million barrels per day.
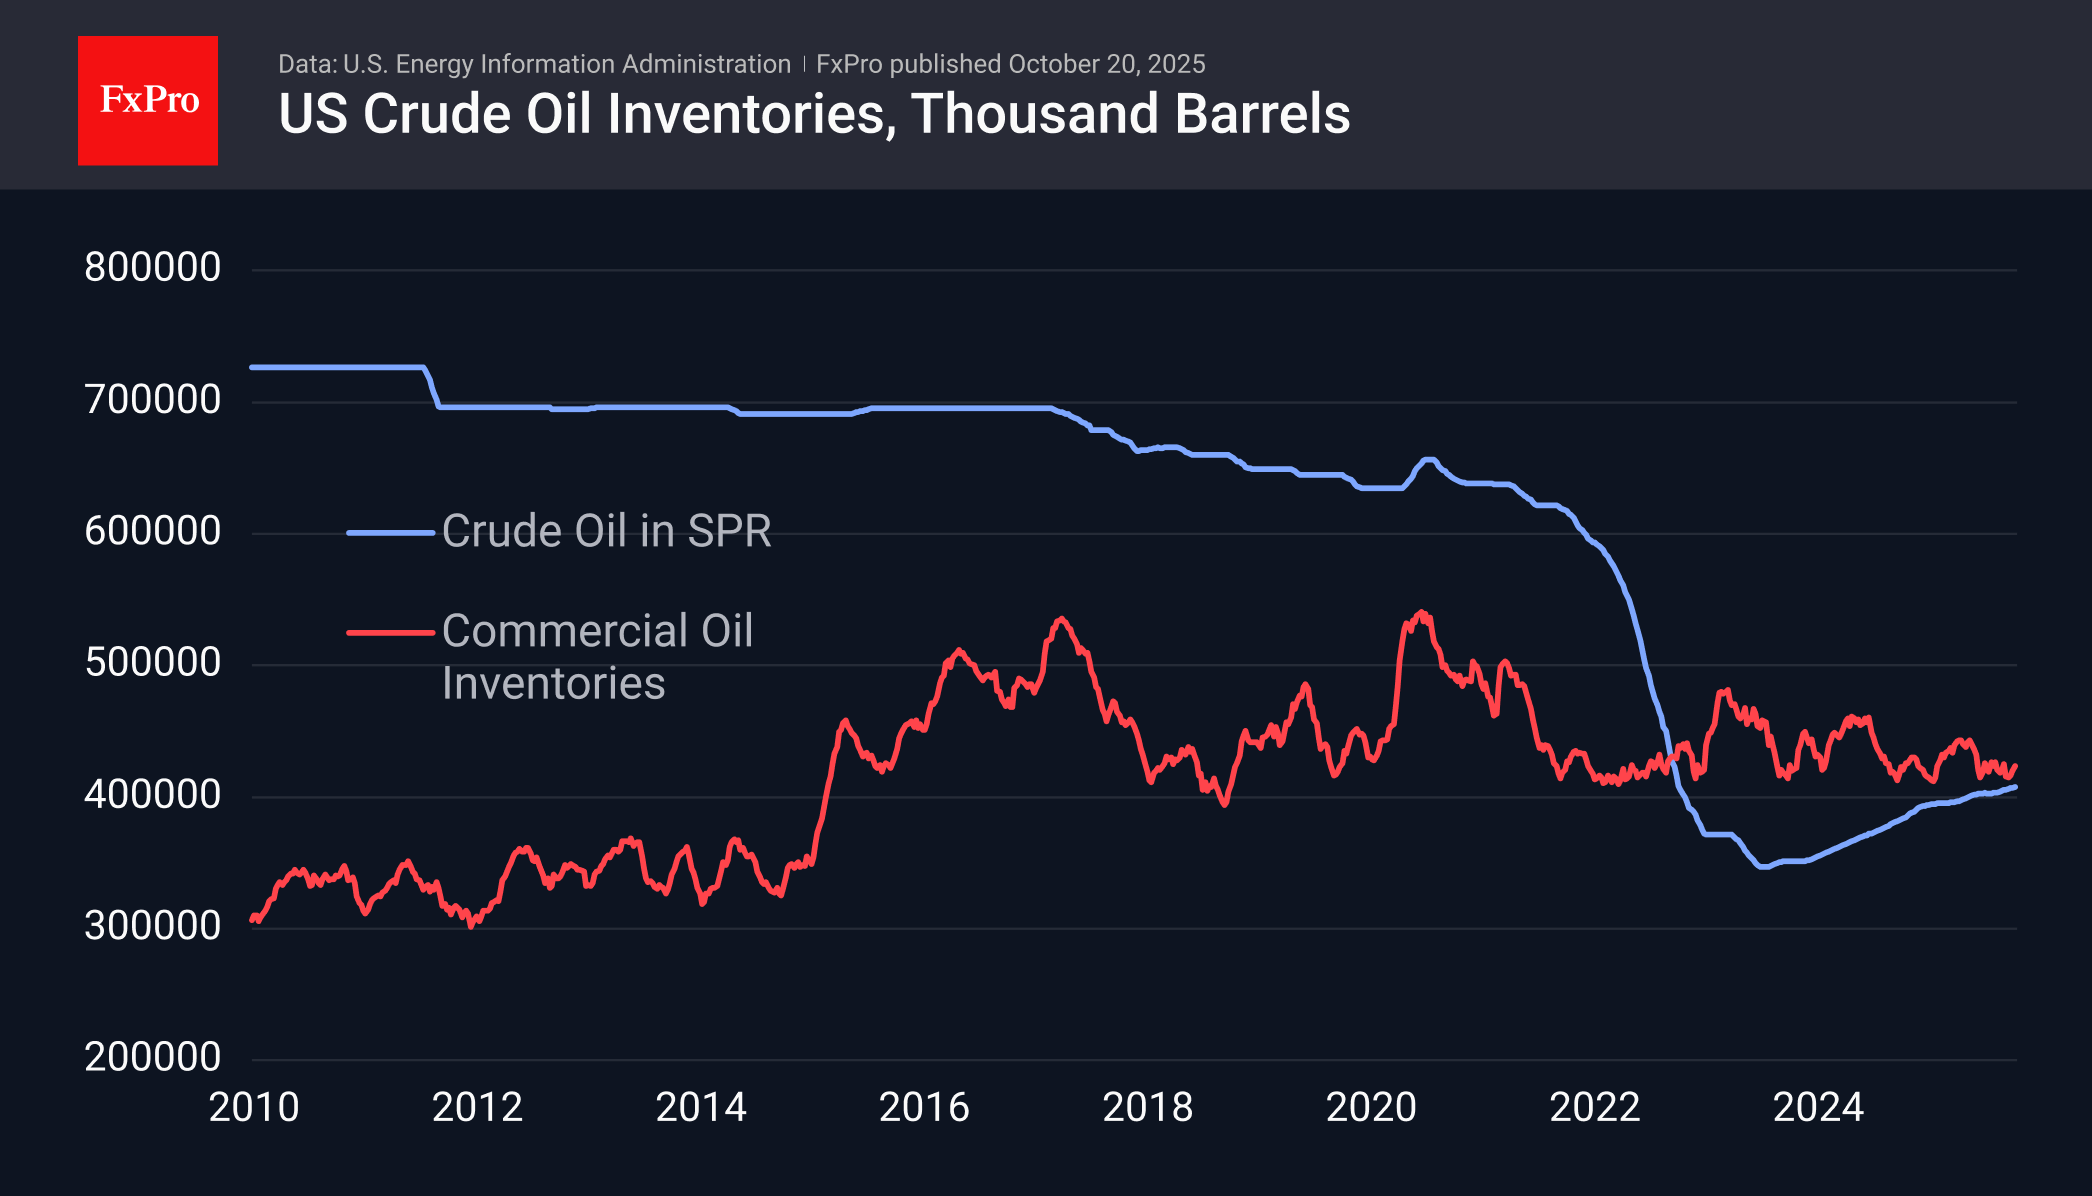
Inventory figures are a stabilising factor. Commercial inventories in the US are at the lower end of the range for the last decade, but they were about the same in January 2020, and six months later, this figure set a new record. However, without a collapse in consumption, such rapid growth should not be expected. The US government may also move to more actively rebuild the strategic petroleum reserve sold off in 2022.
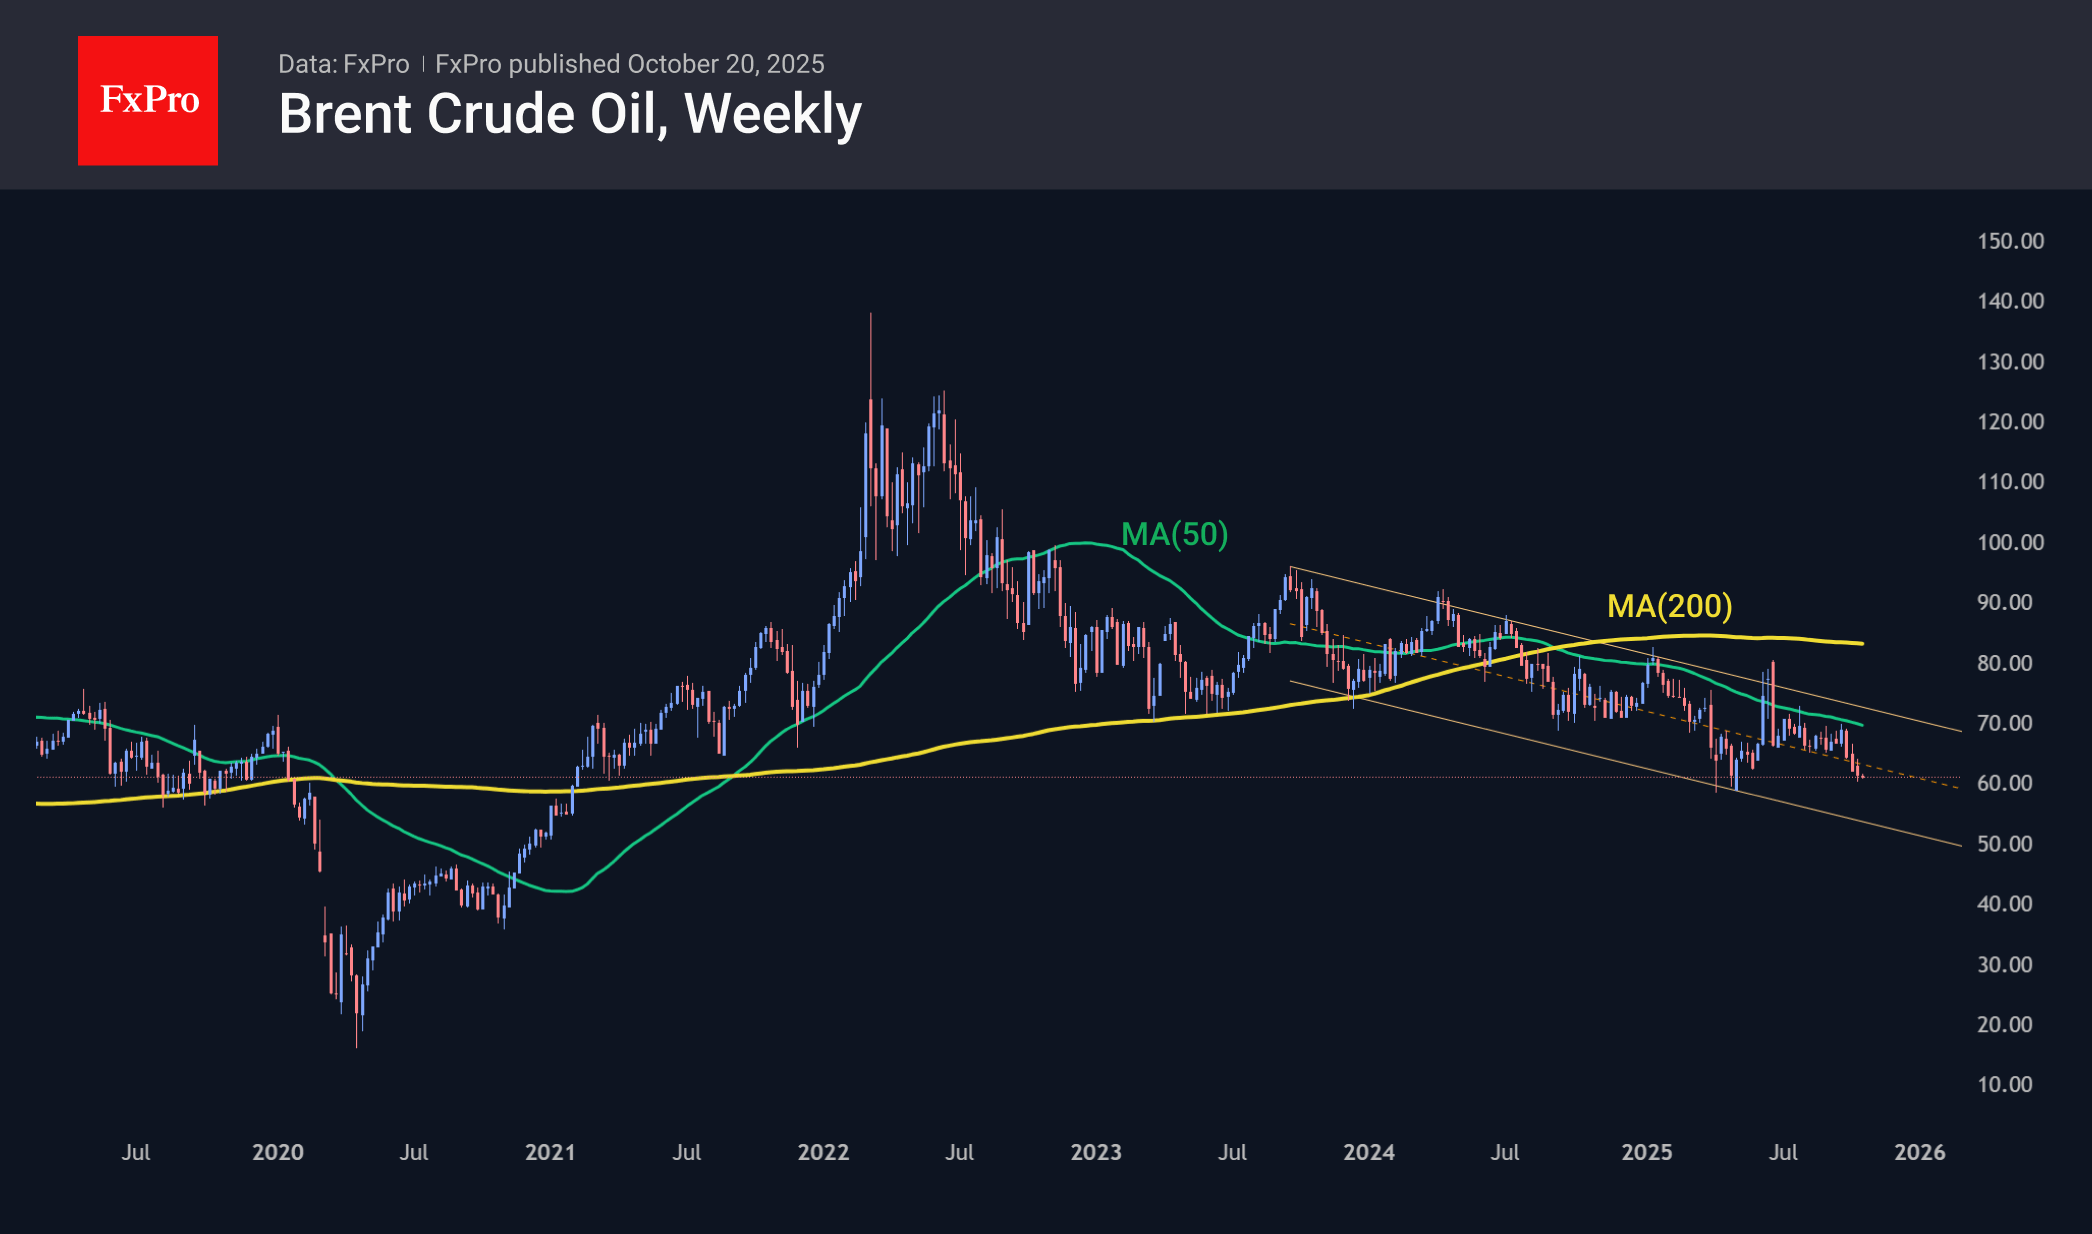
The price of oil has been in a downward channel for just over three years, and at the end of September, it accelerated its decline as it approached the 50-week moving average and the upper limit of the range. The lower limit of this range is now close to $53 per barrel of Brent, with a decline towards the end of the year closer to $50.50 against the current $61.00.
The main scenario for oil is a decline towards $50 in the next 2-4 months. At the same time, the potential for an increase in US inventories is a potential stabilising factor. We assume that the situation with inventories is roughly similar worldwide, excluding the abundance of oil at sea.
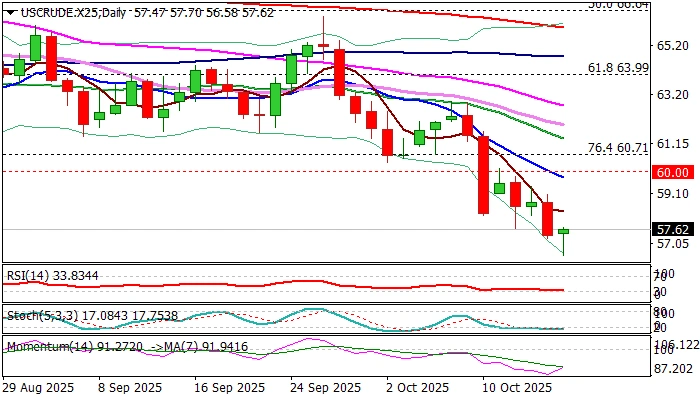
XTI/USD Chart Analysis: Oil Prices Fall to Yearly Lows
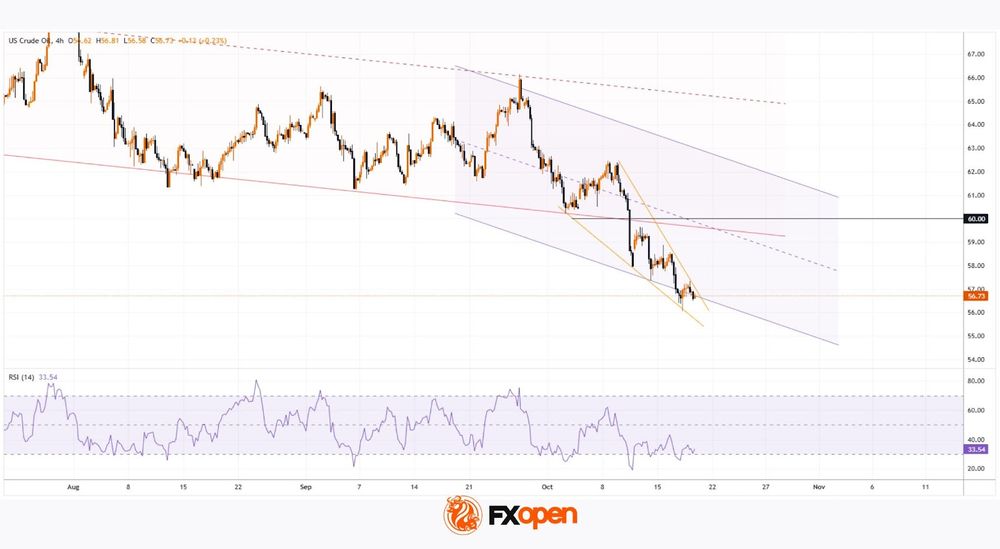
As shown on the XTI/USD chart, WTI crude is trading below $57 today, with the 2025 low sitting near $55. Several factors are currently weighing on oil prices:
→ Uncertainty surrounding the US-China trade deal — the world’s two largest oil consumers — continues to cloud the outlook for global growth and crude demand.
→ Increased output from OPEC+ members has added further pressure, with the IEA last week raising its forecast for a global oil surplus.
→ A decline in the risk premium following the peace agreement in the Middle East has also reduced support for oil prices.
So, what could happen next?
Technical Analysis of the XTI/USD Chart
Seven days ago, we noted that:
→ In the long-term context, oil price fluctuations — following the June escalation in the Middle East — have formed a downward channel (shown in red). The current price has now slipped below its lower boundary.
→ In the short term, the pace of the decline appears to be accelerating, highlighted by the purple trajectory lines.
At that time, we suggested a scenario in which WTI could drift towards its yearly low near $55, which is now materialising. However, note the following:
→ The RSI indicator is hovering near oversold territory.
→ The chart shows signs of a Falling Wedge pattern, which often precedes a bullish reversal.
Given these signals, it is reasonable to assume that, after a roughly 10% decline since the start of the month, bears may begin locking in profits on short positions. This could trigger a technical rebound in WTI prices — potentially towards the resistance area defined by:
→ The lower boundary of the red channel;
→ The psychological level of $60;
→ The median line of the purple channel.
Start trading commodity CFDs with tight spreads. Open your trading account now or learn more about trading commodity CFDs with FXOpen.
This article represents the opinion of the Companies operating under the FXOpen brand only. It is not to be construed as an offer, solicitation, or recommendation with respect to products and services provided by the Companies operating under the FXOpen brand, nor is it to be considered financial advice.
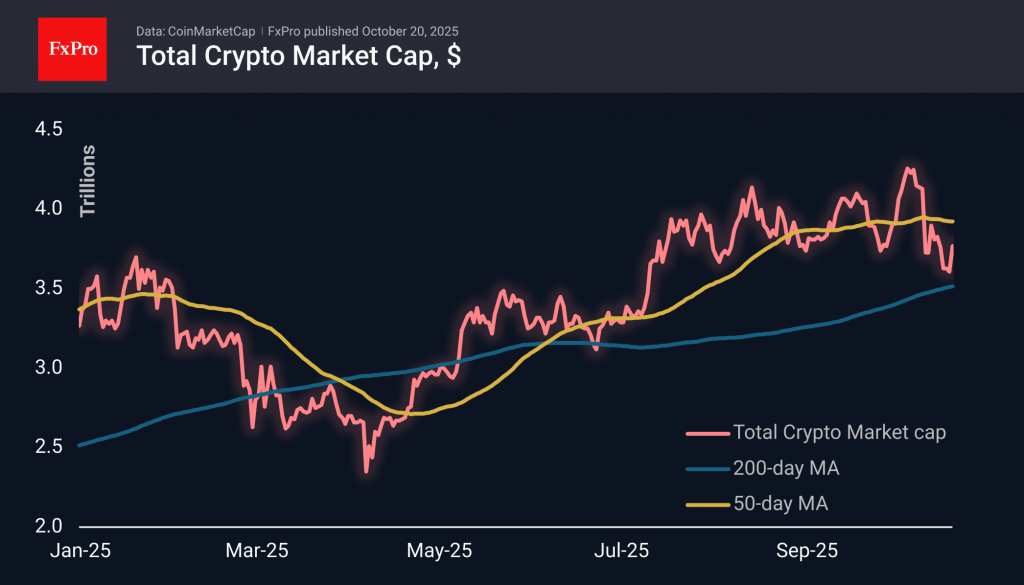
Crypto Market Rebounded from 200-Day MA, Confirming Bull Trend
Market Overview
The crypto market cap grew by 3.9% over the past 24 hours to $3.77 trillion. The decline was interrupted in the middle of the day on Friday as it approached the 200-day moving average. At this important long-term trend line, cryptocurrencies saw an influx of buyers. This could be confirmation of the prevailing strategy of buying on dips, but it could also turn out to be a temporary reload for the bears. The latter scenario will be confirmed if the market fails to exceed $3.95 trillion, the area of recent highs.
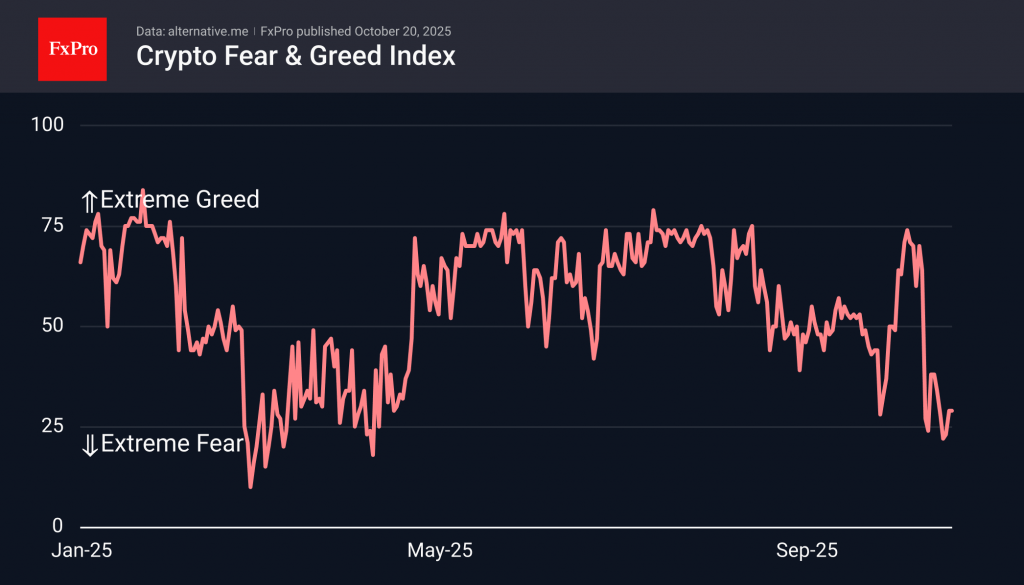
The cryptocurrency sentiment index is at 29 (fear) for the last two days, with a dip into extreme fear on Friday and Saturday. According to the logic of the index creators, a dip into extreme fear is a good buying opportunity. So far, this logic has worked, but it would have been wrong in February, as the market was under pressure until April.
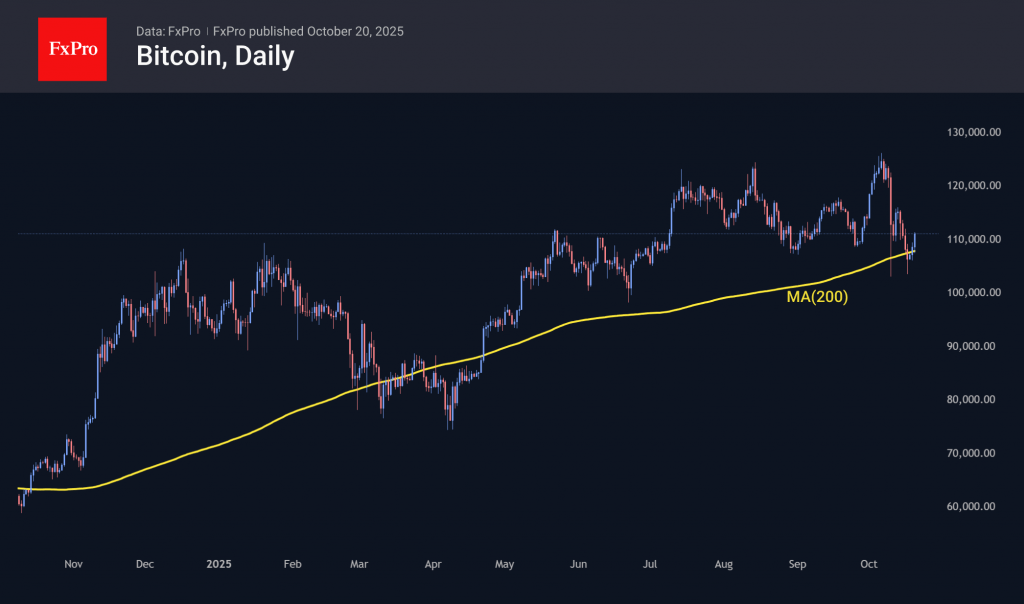
Bitcoin exceeded $111K, gaining ground after dipping below $103.3K on Friday. Bitcoin was bought back when it touched its own 200-day moving average. The positive momentum may signal a real recovery in risk appetite among investors, which has been a problem for the past two weeks.
News Background
The weekly inflow into spot Bitcoin ETFs in the US was interrupted after two weeks of inflows. According to SoSoValue, net outflows from spot BTC ETFs amounted to $1.23 billion last week, the highest since the end of February. Net outflows from spot ETH ETFs amounted to $311.8 million. Over the week, about 2% of total investments were withdrawn from funds for these coins.
The market continues to be influenced by two factors: geopolitical uncertainty and the continuing impact of tight monetary policy, ‘which has not yet changed course,’ Arctic Digital notes.
80% of companies focused on accumulating cryptocurrencies are currently trading below the net value of their crypto assets, said BitMine CEO Tom Lee. The market values such companies cheaper than the cryptocurrencies they hold.
The difficulty of mining Bitcoin fell last week for the first time since June. On October 16th, as a result of another recalculation, the indicator decreased by 2.73%. The network’s hash rate, on the contrary, reached a historic high on the eve of the recalculation.
Ripple acquired GTreasury for $1 billion to integrate its blockchain infrastructure with corporate finance solutions. The acquisition of GTreasury will give the company access to a ‘multi-trillion-dollar market and customer base of major international corporations.
XAU/USD: Gold Consolidating After Friday’s 2% Pullback
Gold holds within a narrow consolidation on Monday following almost 2% pullback from new record high ($4380) on Friday, driven by surprise comments from President Trump that the latest tariffs on China’s imports won’t be sustainable.
Reconciliating tones after a tough rhetoric during the past week, eased bullish pressure and sparked a partial profit taking, which resulted in the biggest daily loss since Nov 25.
However, Friday’s action closed well above $4200, significant support (the first lower breakpoint), keeping overall firm bullish structure intact and signaling that Friday’s drop, although quite significant, would mark positioning for fresh push higher.
The notion is supported by the fact that Trump’s comment should be viewed as isolated case (I was expecting him to soften his stance, as idea of adding 100% on existing tariffs would probably cause the equal damage to the US economy) as Trump aimed to threaten China over mounting problem with exports of rare earth metals, rather than imposing new taxes.
The factors that underpin safe haven demand remain unchanged, with the latest protest in the US, threatening to further destabilize already fragile political situation adding to high global uncertainty.
On the other hand, technical picture on daily chart weakens, as stochastic emerged from overbought territory, 14-d momentum is heading south and daily Tenkan / Kijun-sen turned sideways.
This warns that correction might not be over yet, but the price may hold in extended consolidation rather than attempting to dip further.
Holding above $4200 to keep bias with bulls and guard next trigger at $4162 (daily Tenkan-sen) violation of which would put bulls on hold and open way for deeper correction.
Res: 4300; 4330; 4380; 4400.
Sup: 4219; 4200; 4162; 4131.
Bitcoin rebounds as market panic fades, consolidations seen between 101K–126K
Bitcoin rebounded sharply on Monday, regaining some footing after a two-week selloff driven by risk aversion across global markets. The recovery came as sentiment stabilized following an intense stretch of macro headwinds — including U.S. President Donald Trump’s renewed tariff threats on China and escalating worries over regional banks’ exposure to bad loans. Even expectations of Fed rate cuts failed to cushion the selloff.
With risk appetite showing tentative signs of recovery, Bitcoin rebounded alongside equities and other higher-beta assets. The technical picture, however, is not totally bullish.
The earlier break below 108,627 support confirmed that rise from 74,373 to 126,289 has likely completed its five-wave advance. Tentatively, price action from 126,289 is viewed as consolidations to the rise from 74,373 only.
A push above 116,074 would reinforce this view, and set up the range for the corrective pattern between 101,896 and 126,289. That would imply scope for further consolidation before another run to record highs. The structure suggests the market is resetting rather than reversing.
However, the broader trend shows signs of fatigue. W MACD continues to display bearish divergence, warning that upward momentum is fading. A break below 101,896 would put 55 W EMA (now at 96,913) in focus. Sustained move under that level would suggest a deeper correction of the entire uptrend from the 2022 low of 15,452.
AUD/USD and NZD/USD Recover, Are Gains Just Getting Started?
AUD/USD is attempting a recovery wave from 0.6440. NZD/USD is also correcting losses and might recover if there is a clear move above 0.5760.
Important Takeaways for AUD/USD and NZD/USD Analysis Today
- The Aussie Dollar found support near 0.6440 and is now recovering against the US Dollar.
- There was a break above a key bearish trend line with resistance at 0.6490 on the hourly chart of AUD/USD at FXOpen.
- NZD/USD is attempting a recovery wave above 0.5700.
- There was a break above a major bearish trend line with resistance near 0.5720 on the hourly chart of NZD/USD at FXOpen.
AUD/USD Technical Analysis
On the hourly chart of AUD/USD at FXOpen, the pair dipped from well above 0.6600. The Aussie Dollar declined below 0.6500, but the bulls were active near 0.6440 against the US Dollar.
A low was formed near 0.6440, and the pair is now correcting losses. There was a move above the 23.6% Fib retracement level of the downward wave from the 0.6612 swing high to the 0.6440 low. There was also a break above a key bearish trend line with resistance at 0.6490.
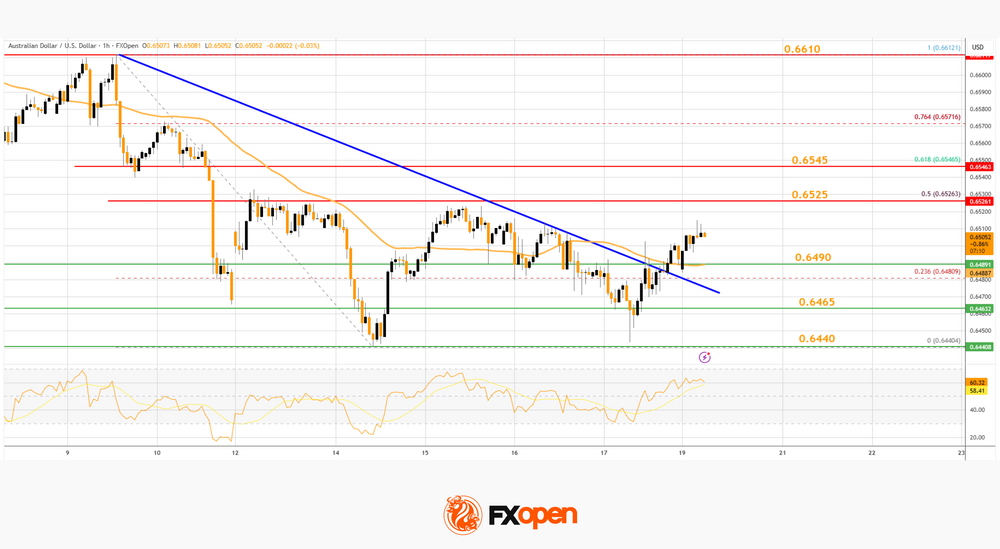
The pair is now above 0.6500 and the 50-hour simple moving average. On the upside, immediate resistance is near the 50% Fib retracement at 0.6525.
The first major hurdle for the bulls could be 0.6545. A clear upside break above 0.6545 could send the pair toward 0.6610. The next area of interest on the AUD/USD chart is near 0.6650, above which the price could rise toward 0.6680. Any more gains might send the pair toward 0.6720.
On the downside, initial support is near 0.6490 or the 50-hour simple moving average. The key breakdown zone could be 0.6465 and 0.6440. Any more losses might send the pair toward 0.6400.
NZD/USD Technical Analysis
On the hourly chart of NZD/USD on FXOpen, the pair also followed a similar pattern and declined from the 0.5800 zone. The New Zealand Dollar gained bearish momentum and traded below 0.5750 against the US Dollar.
The pair even dropped below the 50-hour simple moving average and tested 0.5680. A low was formed near 0.5682, and the pair is now attempting a fresh increase. It is back above 0.5700 and the 50-hour simple moving average.
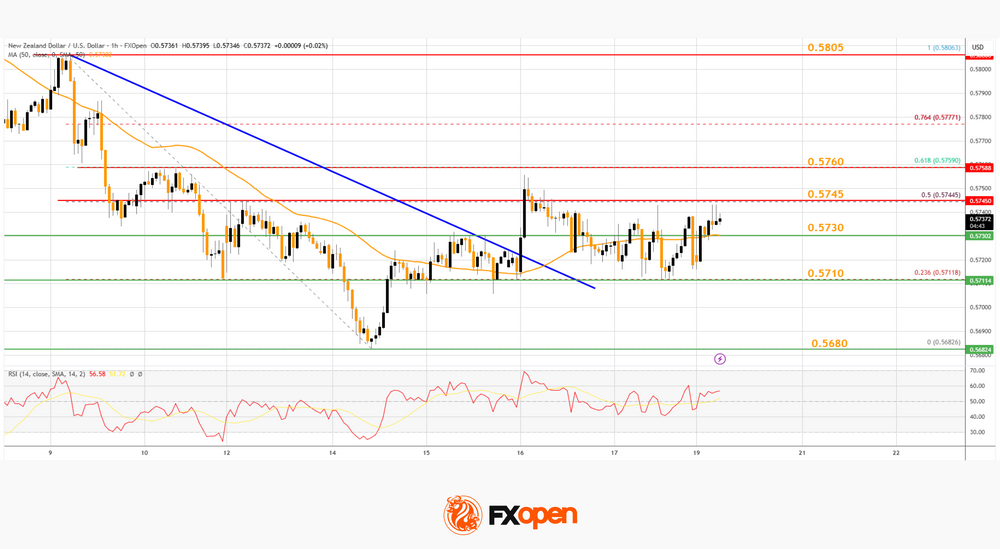
Besides, there was a break above a major bearish trend line with resistance near 0.5720. The pair tested the 50% Fib retracement level of the downward wave from the 0.5806 swing high to the 0.5682 low.
On the upside, the pair is facing a barrier near 0.5745. The next key breakout zone sits near the 61.8% Fib retracement at 0.5760. If there is a move above 0.5760, the pair could rise toward 0.5805. Any more gains might open the doors for a move to 0.5850.
On the downside, immediate support on the NZD/USD chart is near 0.5730. The next key area for the bulls might be 0.5710. If there is a downside break below 0.5710, the pair could extend the decline toward 0.5680. The main target for the bears below 0.5680 might be 0.5620.
Trade over 50 forex markets 24 hours a day with FXOpen. Take advantage of low commissions, deep liquidity, and spreads from 0.0 pips. Open your FXOpen account now or learn more about trading forex with FXOpen.
This article represents the opinion of the Companies operating under the FXOpen brand only. It is not to be construed as an offer, solicitation, or recommendation with respect to products and services provided by the Companies operating under the FXOpen brand, nor is it to be considered financial advice.
S&P 500 Index Shows Elevated Volatility
On the 4-hour chart of the S&P 500 Index (US SPX 500 mini on FXOpen), the ATR indicator with standard settings has not fallen below the 30 mark, signalling higher current market volatility compared to previous periods. Traders’ decisions are being influenced by the ongoing government shutdown, developments around a potential US-China tariff deal, and an increasingly active earnings season. Market sentiment has also been shaped by renewed concerns over regional bank stability and profit-taking in AI-related stocks.
Looking ahead, the new week is also expected to bring heightened volatility, as:
→ US Treasury Secretary Scott Bessent and Chinese Vice Premier He Lifeng are set to meet in the coming days, paving the way for a potential meeting between Presidents Trump and Xi later this month.
→ Attention will also turn to quarterly results from Netflix, Coca-Cola, Tesla, IBM, and Intel. With key US economic data releases suspended due to the government shutdown, investors are likely to look to corporate earnings for direction.
Technical Analysis of the S&P 500 Chart
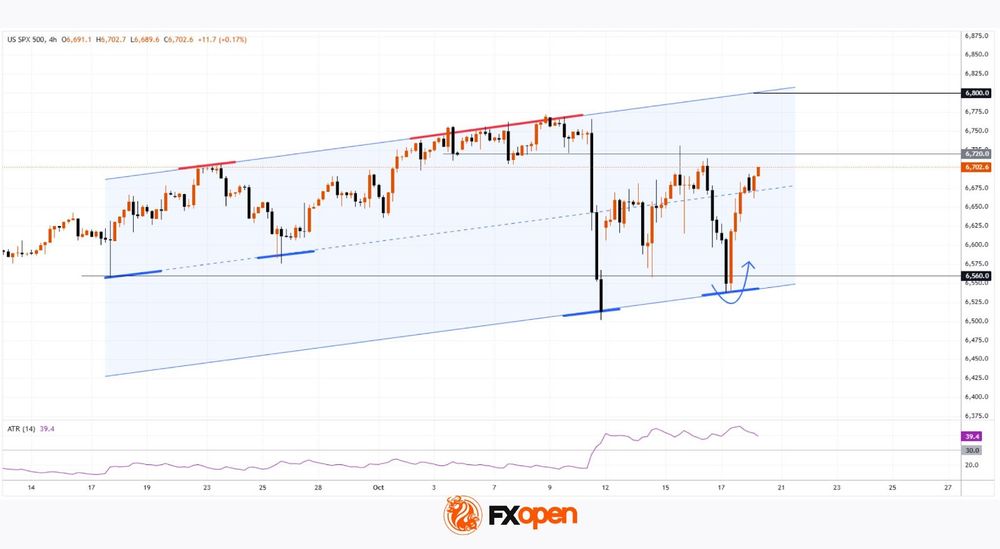
Major turning points on the 4-hour S&P 500 (US SPX 500 mini on FXOpen) chart, highlighted in bold, outline a broad ascending channel that reflects the market’s expanded price swings.
From a bullish perspective:
→ The price remains in the upper half of the channel.
→ Market sentiment is improving, with prices moving closer to last week’s highs during the European session.
→ As indicated by the arrow, a wide bullish engulfing pattern formed near the lower boundary of the channel, confirming strong buying interest around the 6,560 level.
From a bearish standpoint:
→ Selling pressure was particularly aggressive near 6,720, pushing the price lower on 10 October.
→ Last week, this level once again acted as resistance, suggesting that bears maintain control there, limiting near-term upside potential.
Given these dynamics, traders may wish to adjust their strategies to account for the prevailing volatility. Should positive headlines emerge on US-China trade progress, supported by upbeat corporate forecasts, the S&P 500 (US SPX 500 mini on FXOpen) could make a push towards the upper channel boundary, potentially setting a new record near the 6,800 mark.
Trade global index CFDs with zero commission and tight spreads. Open your FXOpen account now or learn more about trading index CFDs with FXOpen.
This article represents the opinion of the Companies operating under the FXOpen brand only. It is not to be construed as an offer, solicitation, or recommendation with respect to products and services provided by the Companies operating under the FXOpen brand, nor is it to be considered financial advice.
Yen Extends Its Correction
The yen is continuing its corrective phase, with the US dollar facing conflicting pressures. Political uncertainty in the US—stemming from the threat of a federal government shutdown—coupled with the escalation of Trump's trade wars, is creating a mixed environment for the greenback.
On one hand, the dollar continues to find support from high US bond yields and the Federal Reserve's hawkish stance on inflation risks, which is limiting the scale of its decline.
On the other hand, a trifecta of factors is bolstering the yen's appeal as a safe-haven asset: signs of weakening business activity, growing US budget deficits, and heightened geopolitical tensions in Asia, particularly concerning Taiwan and the South China Sea.
An additional layer of complexity comes from the energy market. Instability and rising oil prices threaten to reignite inflationary pressures, which could force investors to reassess their interest rate expectations.
Collectively, these elements create a volatile fundamental backdrop. Short-term movements in USD/JPY are likely to be dictated by the delicate balance between the dollar's yield appeal and rising demand for safe-haven assets like the yen.
Technical Analysis: USD/JPY
H4 Chart:
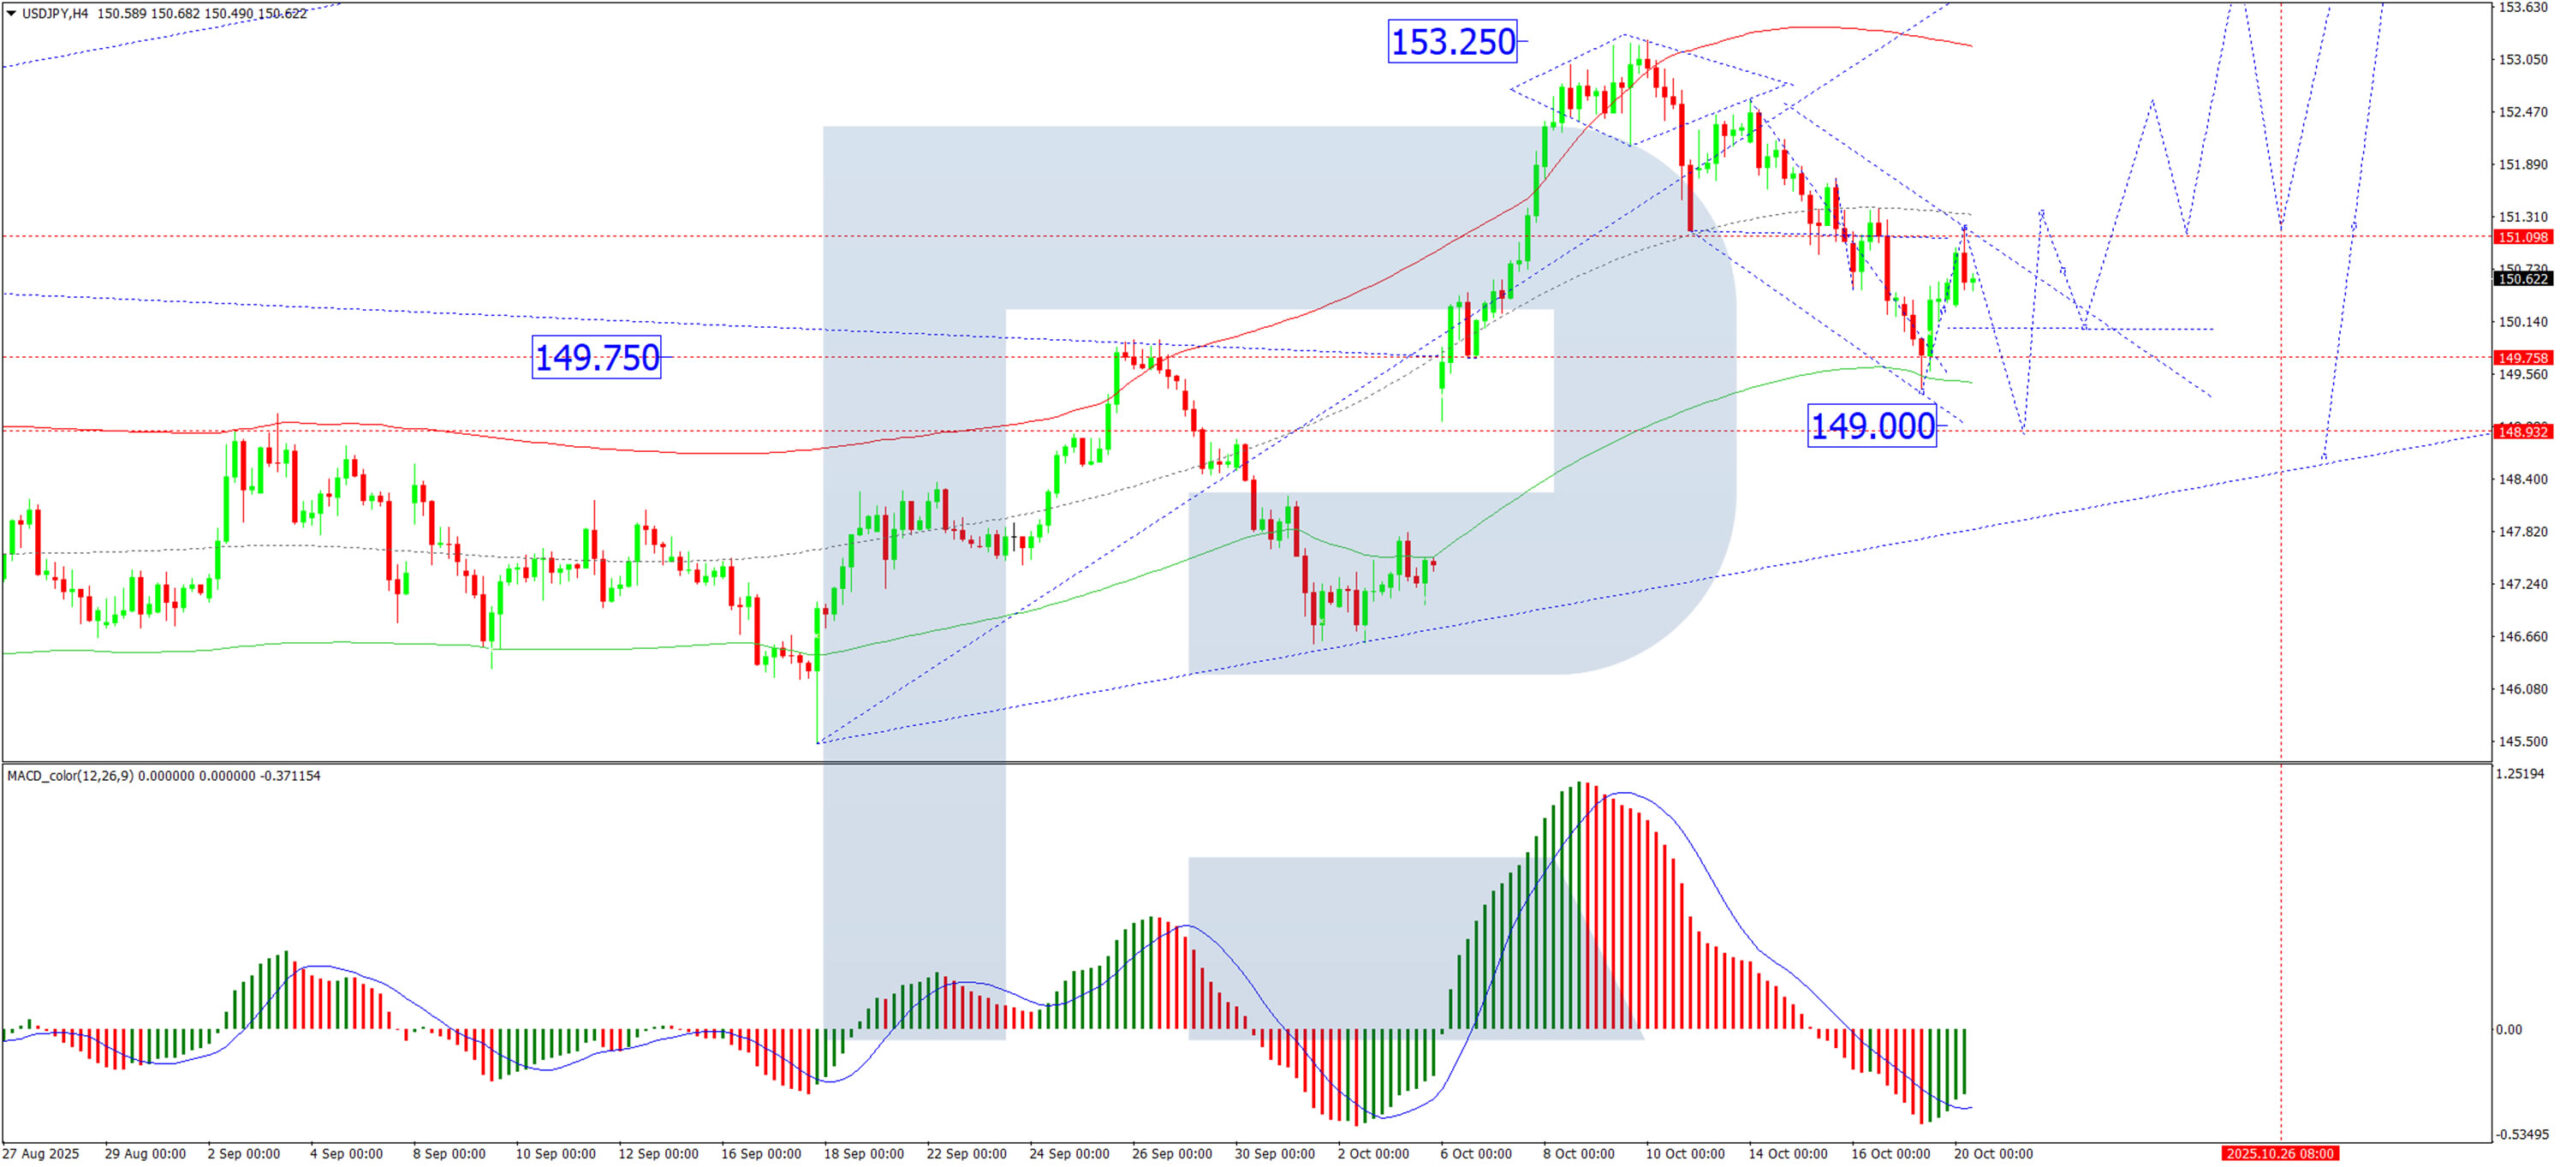
On the H4 chart, the USD/JPY pair formed a consolidation range around 151.10. Following a downward breakout, the pair successfully reached its initial target at 149.38. The market has since completed a technical retest of the 151.10 level from below. The immediate scenario favours a further correction towards 149.00. Following this decline, we anticipate the start of a new growth wave, with initial targets at 151.50 and a longer-term prospect of resuming the broader uptrend towards 154.10. This outlook is technically confirmed by the MACD indicator. Its signal line remains below zero and is pointing downward, reflecting sustained bearish momentum with potential for a subsequent reversal.
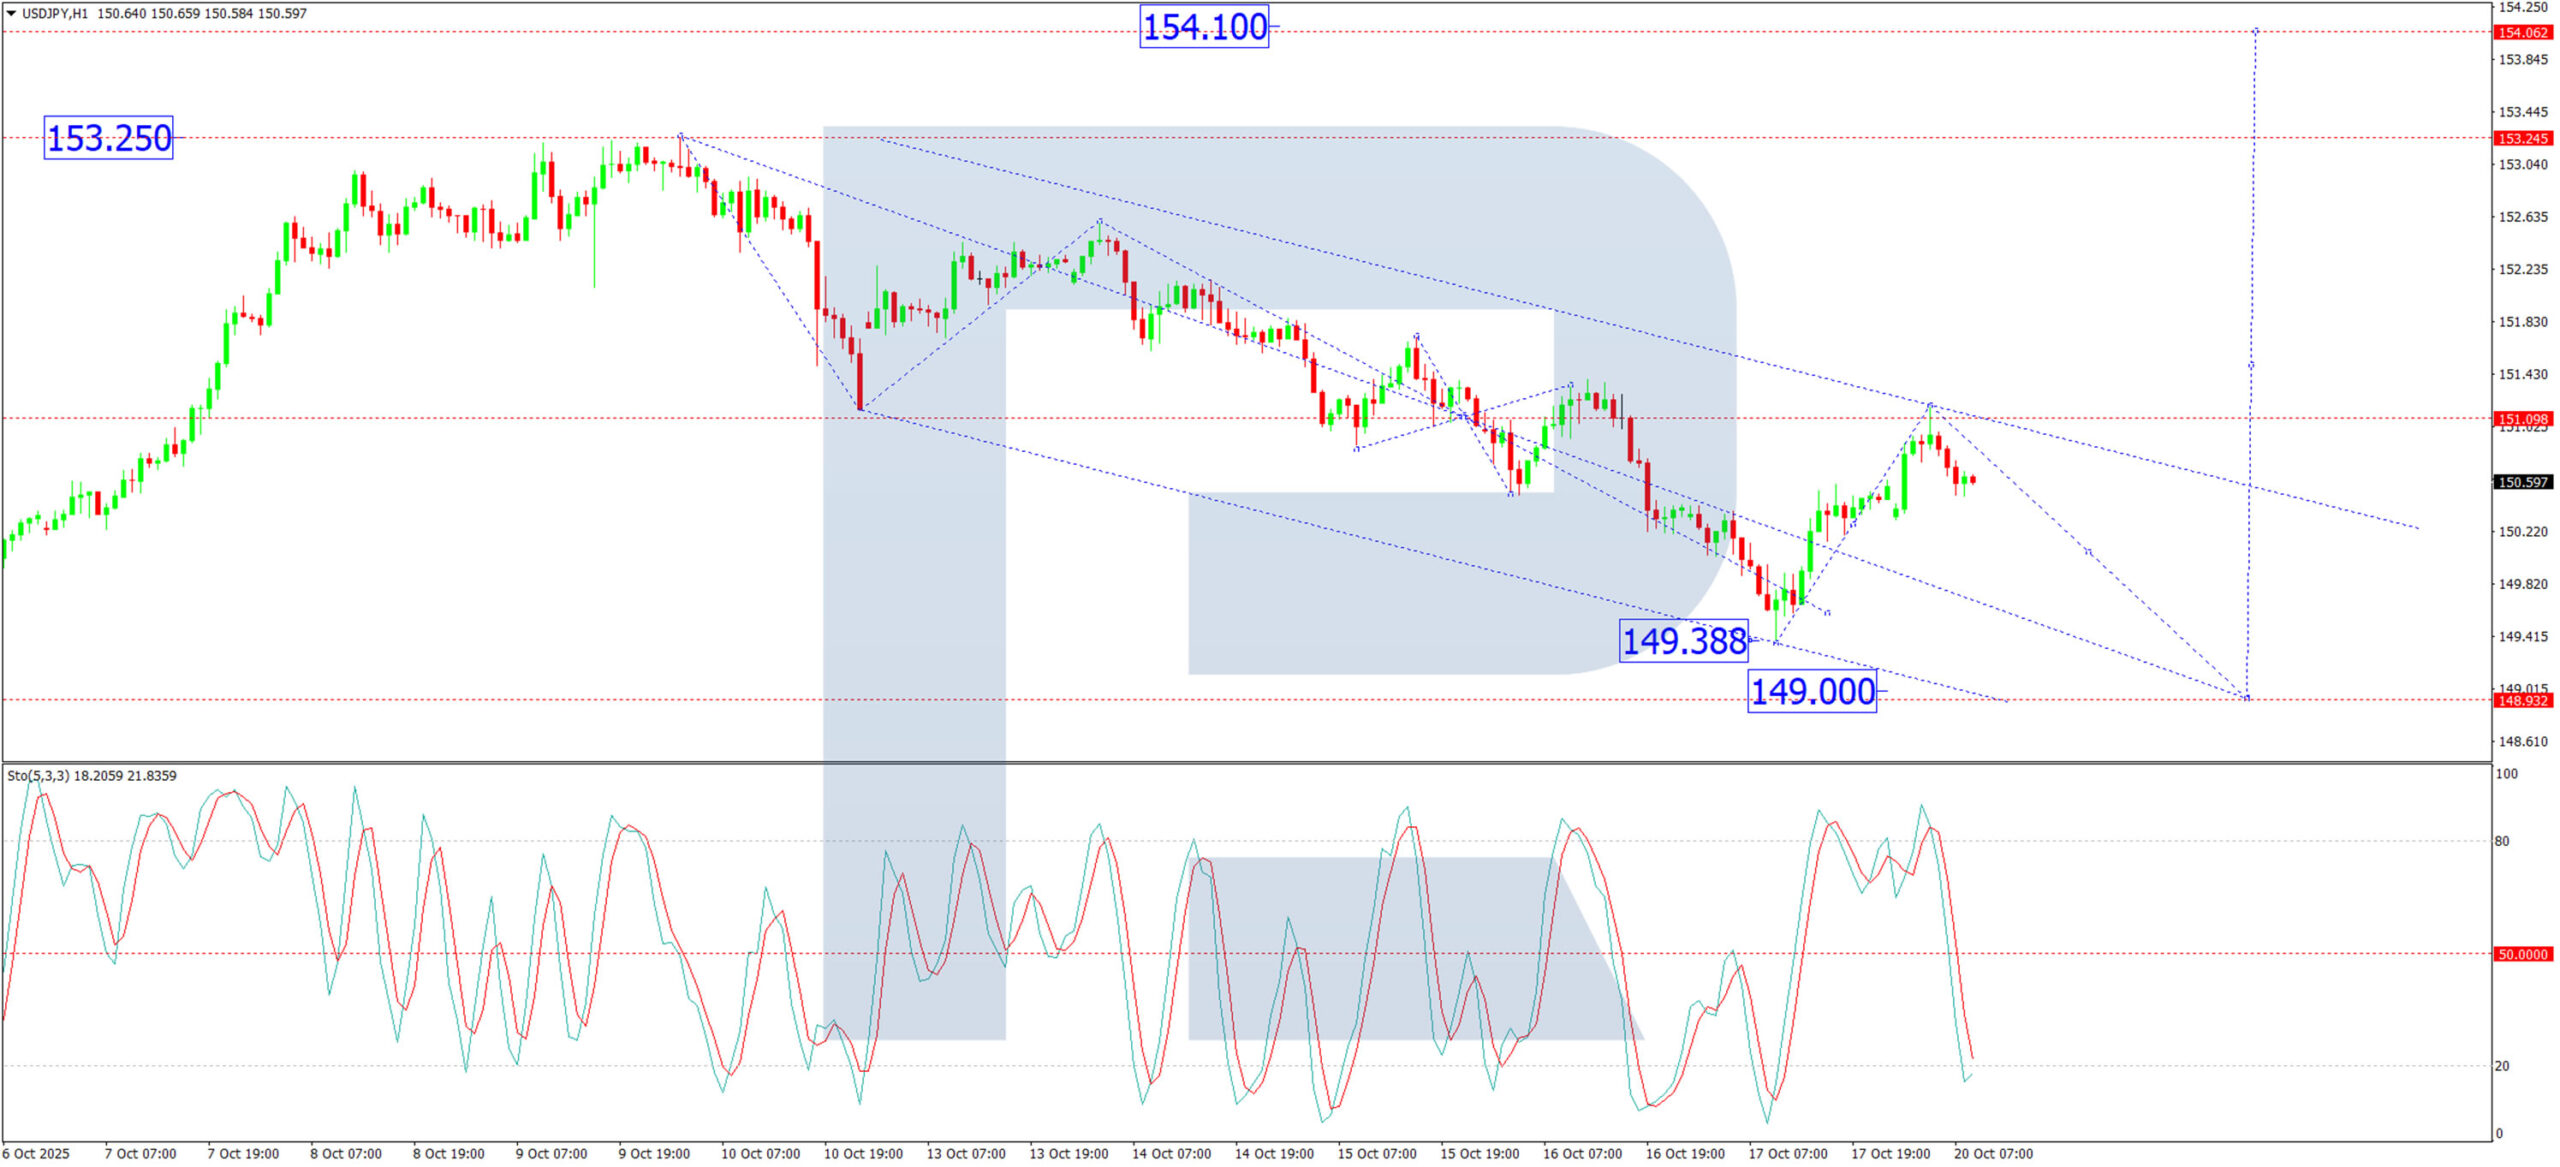
H1 Chart:
On the H1 chart, the pair completed an upward leg to 151.10, forming a structure that suggests the correction phase has concluded. We now expect the development of a fifth decline wave towards 149.00. After this move lower, we will assess the potential for a new upward movement targeting 151.10. The Stochastic oscillator corroborates this view. Its signal line is currently below 50 and trending downwards towards the 20 zone, indicating that short-term downward potential remains intact.
Conclusion
The yen's correction is set to continue in the near term, driven by a complex mix of fundamental headwinds for the dollar and safe-haven demand. Technically, the path of least resistance appears to be a further dip towards 149.00, after which the broader bullish trend is expected to reassert itself, targeting levels above 151.50.