Sample Category Title
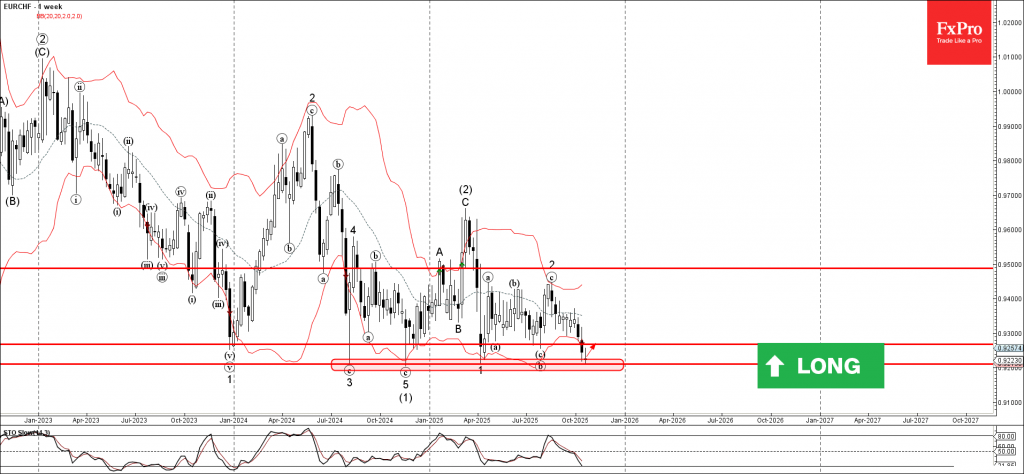
EURCHF Wave Analysis
EURCHF: ⬆️ Buy
- EURCHF reversed from support area
- Likely to rise to resistance level 0.9270
EURCHF currency pair recently reversed from the support area between the long-term support level 0.9210 (which has been reversing the price from the middle of 2024) and the lower weekly Bollinger Band.
This support area also stopped the previous impulse waves 3, (1), 1 and c, as can be seen from the weekly EURCHF chart below.
Given the strength of the support level 0.9210 and the oversold weekly Stochastic, EURCHF currency pair can be expected to rise to the next resistance level 0.9270.
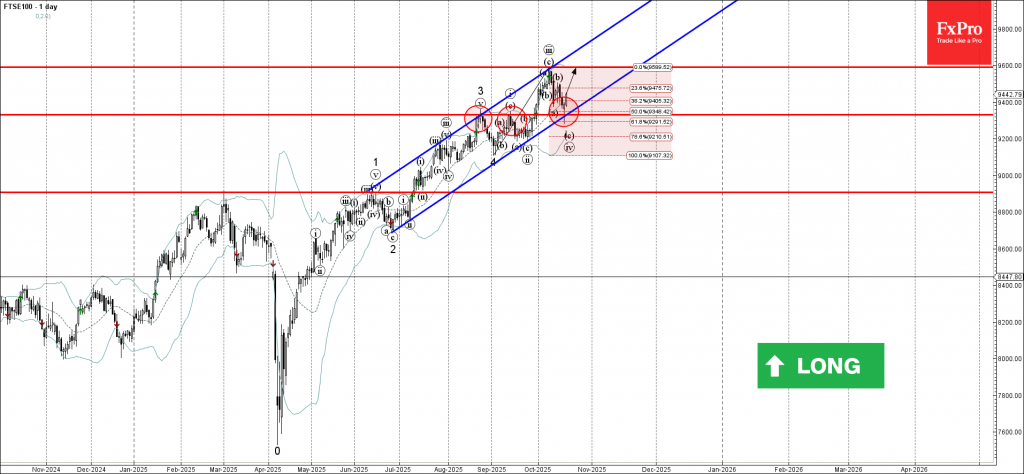
FTSE 100 Wave Analysis
FTSE 100: ⬆️ Buy
- FTSE 100 reversed from key support level 9330.00
- Likely to rise to resistance level 9600.00
FTSE 100 index recently reversed from the support area between the key support level 9330.00 (former strong resistance from August and September), 50% Fibonacci correction of the upward impulse from September and the lower weekly Bollinger Band.
The upward reversal from this support zone created the daily Japanese candlesticks reversal pattern Hammer.
Given the strong daily uptrend, FTSE 100 index can be expected to rise to the next resistance level 9600.00 (which stopped the previous impulse wave iii).
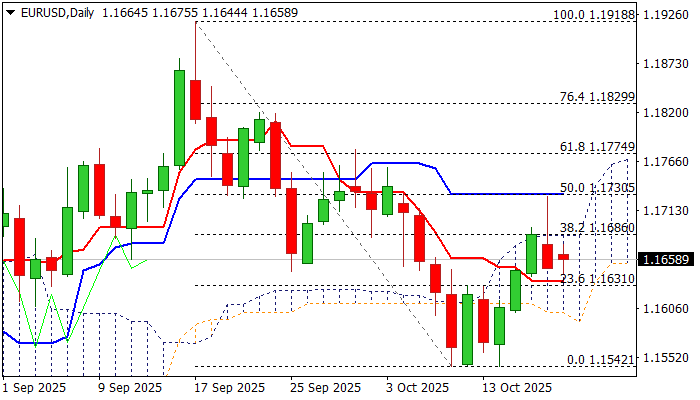
EURUSD – Mixed Signals While Price Holds Within Daily Cloud
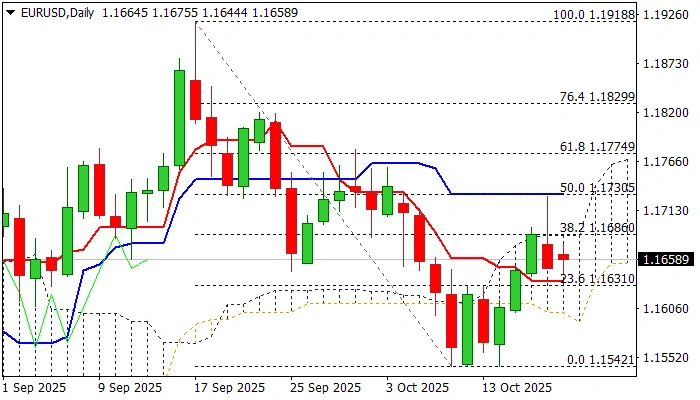
The Euro remains in red on Monday, although with limited downside so far, after Friday’s strong upside rejection left bearish daily candle with long upper shadow and formed a bull-trap at daily cloud top, generating initial negative signal.
Technical picture on daily chart shows MA’s in mixed setup, negative momentum and the price moving within daily cloud (spanned between 1.1600 and 1.1685) and holding above broken daily Tenkan-sen (1.1635) for the third consecutive day, lacking direction signal for now.
Traders look for fresh catalysts, such as strong recovery of gold after pullback and revived risk aversion, with focus also on release of US inflation report on Friday (if government reopens) that may generate fresh signals.
Initial negative signals are expected on break of Tenkan-sen, while sustained break below daily cloud will be bearish.
Conversely close above daily cloud top to revive bulls and lift above 1.1730 (daily Kijun-sen / 50% of 1.1918/1.1542 descend) to confirm.
Res: 1.1685; 1.1700; 1.1730; 1.1774
Sup: 1.1635; 1.1600; 1.1555; 1.1542
EURUSD: Mixed Signals While Price Holds Within Daily Cloud
The Euro remains in red on Monday, although with limited downside so far, after Friday’s strong upside rejection left bearish daily candle with long upper shadow and formed a bull-trap at daily cloud top, generating initial negative signal.
Technical picture on daily chart shows MA’s in mixed setup, negative momentum and the price moving within daily cloud (spanned between 1.1600 and 1.1685) and holding above broken daily Tenkan-sen (1.1635) for the third consecutive day, lacking direction signal for now.
Traders look for fresh catalysts, such as strong recovery of gold after pullback and revived risk aversion, with focus also on release of US inflation report on Friday (if government reopens) that may generate fresh signals.
Initial negative signals are expected on break of Tenkan-sen, while sustained break below daily cloud will be bearish.
Conversely close above daily cloud top to revive bulls and lift above 1.1730 (daily Kijun-sen / 50% of 1.1918/1.1542 descend) to confirm.
Res: 1.1685; 1.1700; 1.1730; 1.1774
Sup: 1.1635; 1.1600; 1.1555; 1.1542
BTCUSD: Recovery Extends into Second Straight Day But Risk of Stall Under Daily Cloud Persists
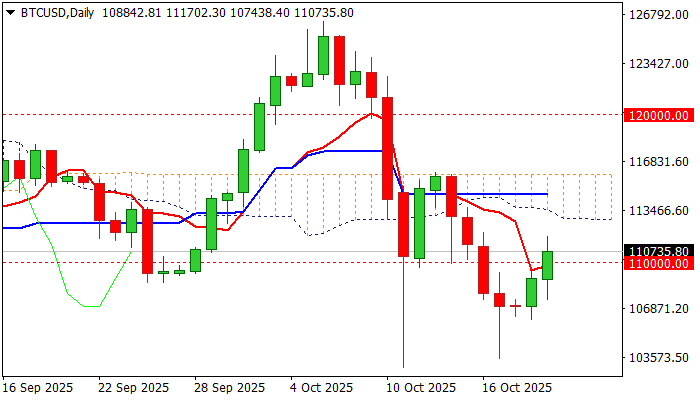
BTCUSD recovery extends into second straight day and cracks 111K barrier, following another strong downside rejection (Friday’s spike to 103500 zone and short-lived break below ascending 200DMA).
Double weekly candle with long tail added to recovery prospects, along with revived risk aversion and signals of potential easing of tensions between the US and China that would contribute to stronger short squeeze.
However, optimism is likely to be limited as daily studies remain in predominantly bearish configuration (strong negative momentum / MA’s mainly in bearish setup / thickening daily cloud above the price weighs).
Also, gold recovery from $4200 zone (where Friday’s 2% pullback found firm ground) picked up and rose above $4300 that may deflate Bitcoin’s recovery and contribute to formation of dead cat bounce bearish continuation pattern on daily chart.
Broken 110K level marks solid support, loss of which would soften near-term structure and generate initial signals of recovery stall, with dip below 107K /106K needed to confirm and open way for retest recent spike lows at 103K zone and unmask psychological 100K level.
Conversely, daily close above 110K to keep near-term action biased higher, with sustained break above 111K to strengthen near-term structure, although it will be a tough job to clear key barrier, presented by daily Ichimoku cloud (spanned between 112960 and 115900), break of which is needed to bring bulls fully in play.
Res: 111700; 112960; 113854; 115900
Sup: 110000, 109466; 108527; 106750
Sunset Market Commentary
Markets
Whether one should denominate today’s global price action as outright ‘risk-on’ might be subject to debate. Most major stock market indices are trading in green. The Eurostoxx 50 even adds 1% and is only a whisker away from an all-time record. US indices open with solid gains (S&P 500 +0.65%). Japan outperforms (Topix + 2.46%) as a coalition agreement between the LDP and the Japan Innovation Party (Ishin) is seen removing uncertainty and opening the door for a growth supportive policy. Contrary to last week, there are no new unsettling headlines on trade tensions between the US and China. Uncertainty on potential tensions in parts of the US credit market/regional banks also subsided. Even the surprise downgrade of the French credit rating by S&P (A+ from AA-) after the European close on Friday only caused limited repricing for OAT’s (10 spread vs swap widened from 77 bps on Friday to 79 bps today). No news currently apparently allows for some kind of glass half full feeling. However, this feeling has hardly any impact on core bond/interest rate markets. German yields today are changing less than 1 bp across the curve. US yields are easing between 0.5 bp (2-y) and -3 bps (30-y). In this respect, bonds easily maintain most of the recent gains. The US 10-y yield hovers near the psychological barrier of 4%. The 2-y yield still doesn’t really know which side of the 3.43%/3.50% support area to go (currently 3.46%). No additional guidance is to be expected from Fed-governors this week as they entered the back-out period in the run-up to next week’s policy decision. The US Bureau of Labour Statistics on Friday will make an exception to the ‘publication-shutdown’ of eco data and release the September US CPI data in order to allow the calculation of the annual Social security cost of living increase. Even so, markets currently don’t see an expected rise in headline CPI (3.1% from 2.9%) as derailing the intentions of a majority of Fed governors to ease policy restriction to accommodate a weakening labour market.
On FX markets, moves in most major cross rates are limited and some kind of erratic in nature. DXY holds in the mid 98 area (98.55). EUR/USD declines marginally (1.165), but stays firmly in the 1.155/1.192 trading range with little indication on a break either side. USD/JPY also holds near the 150 pivot (currently 150.65). Japanese yields in the 2-y/10-y sector jumped 4-5 bps as the coalition agreement between the LDP and Ishin was seen as a potential support to growth. At the same time, it also removed a factor of uncertainty for the BoJ. Hawkish BoJ member Takata reiterated his support for a rate hike. For now, the direct impact of the BoJ debate on the yen remains limited. Among the smaller currencies, the Swiss franc at EUR/CHF 0.9235 is again challenging historic top levels against the single currency (except for the early 2015 spike).
News & Views
Statistics Poland released a bunch of (secondary) data today. Produces prices fell by 0.2% M/M in September to be 1.2% lower in Y/Y-terms. Apart from July (+0.5% M/M), factory gate prices have been sliding M/M since December 2024. In annual terms, producer price inflation has been negative since July 2023. The biggest September drop was recorded in manufacturing (-0.3%). Average Polish gross wages and salaries were marginally lower in September (-0.2% M/M) to be up 7.5% Y/Y. Employment levels fell slightly, by 0.1% M/M and 0.8% Y/Y. Last but not least, industrial production recovered significantly after the holiday period with the higher number of working days than in August helping as well. Industrial output surged by 16% M/M and 7.4% Y/Y. In the period January-September of 2025, sold production was 2.7% higher than in the corresponding period of 2024 (which saw an increase by 0.2%). The Polish zloty trades with a slight positive bias in today’s positive risk climate with EUR/PLN testing the downside its extremely narrow sideways trading range at 4.24.
New Zealand inflation accelerated from 0.5% Q/Q in Q2 to 1% in Q3 (vs 0.9% expected). Annual inflation rose from 2.7% to 3%, the highest level since Q2 2024. The largest contributors to annual inflation were all in the housing and housing utilities group with electricity (+11.3% Y/Y), rent (+2.6% Y/Y) and local authority rates and payments (+8.8% Y/Y). They make up 17% of the CPI basket. NZ money markets still discount a 25 bps rate cut at the November meeting, but the probability of more action afterwards fell towards just over 50% after the sticky CPI release. NZD swap rate rose by 2 to 3.5 bps across the curve. The kiwi dollar failed to profit, holding just above the recent lows at NZD/USD 0.57.
EUR/USD Mid-Day Outlook
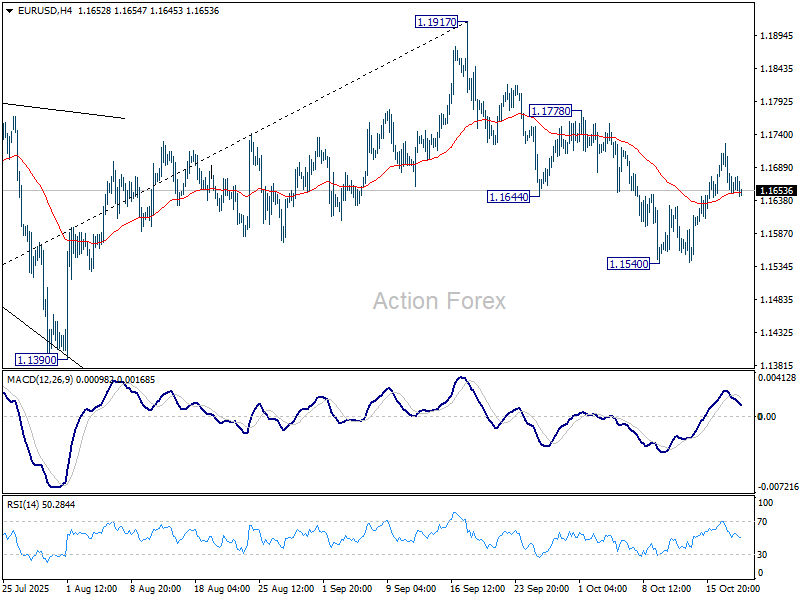
Daily Pivots: (S1) 1.1627; (P) 1.1677; (R1) 1.1705; More…
Outlook is EUR/USD is unchanged and intraday bias stays neutral. Further decline is in favor as long as 1.1778 resistance holds. Break of 1.1540 will resume the decline from 1.1917 and target 1.1390 support, or even further to 38.2% retracement of 1.0176 to 1.1917 at 1.1252. On the upside, through, break of 1.1778 will target retest of 1.1917 high instead.
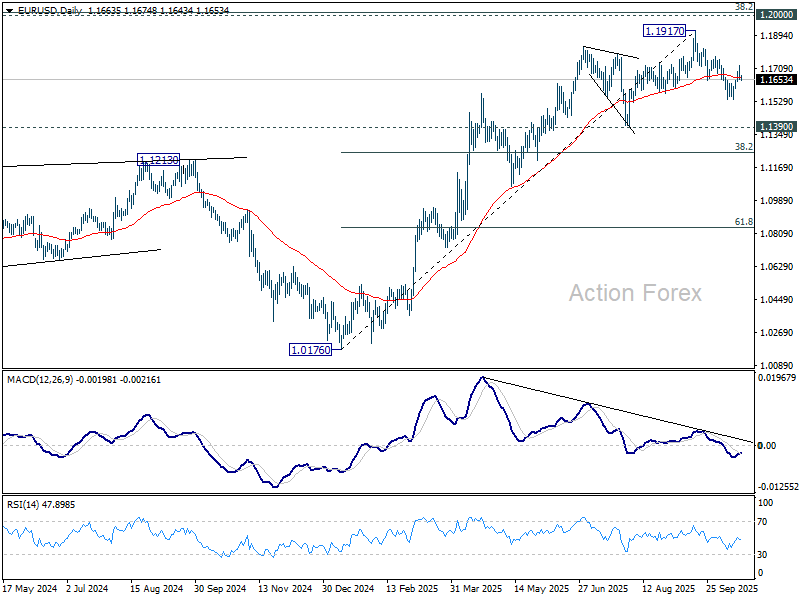
In the bigger picture, considering bearish divergence condition in D MACD, a medium term top is likely in place at 1.1917, just ahead of 1.2 key psychological level. As long as 55 W EMA (now at 1.1290) holds, the up trend from 0.9534 (2022 low) is still expected to continue. Decisive break of 1.2000 will carry larger bullish implications. However, sustained trading below 55 W EMA will argue that rise from 0.9534 has completed as a three wave corrective bounce, and keep outlook bearish.
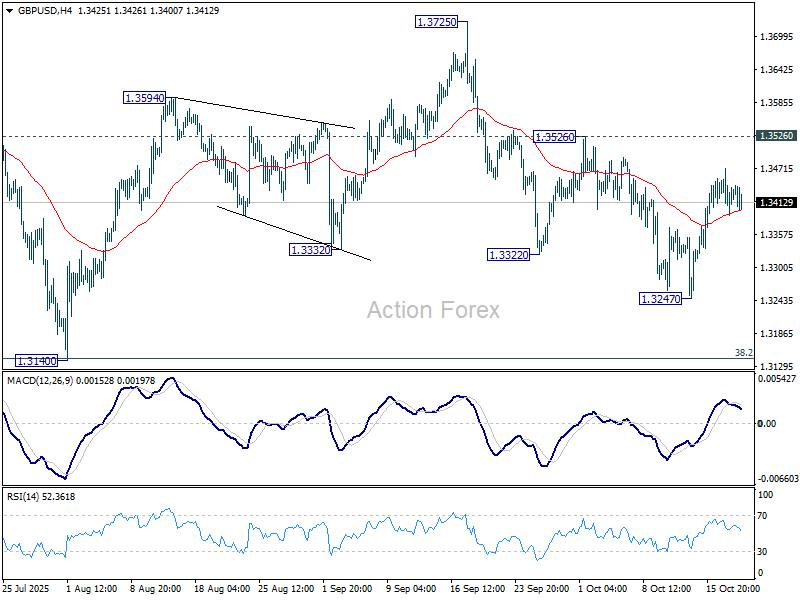
GBP/USD Mid-Day Outlook
Daily Pivots: (S1) 1.3388; (P) 1.3430; (R1) 1.3468; More...
Outlook in GBP/USD is unchanged and intraday bias stays neutral. On the downside, break of 1.3247 will target 1.3140 cluster (38.2% retracement of 1.2099 to 1.3787 at 1.3142). Strong support is expected there to contain downside to complete the corrective pattern from 1.3787. On the upside, break of 1.3526 will target 1.3725/87 resistance zone.
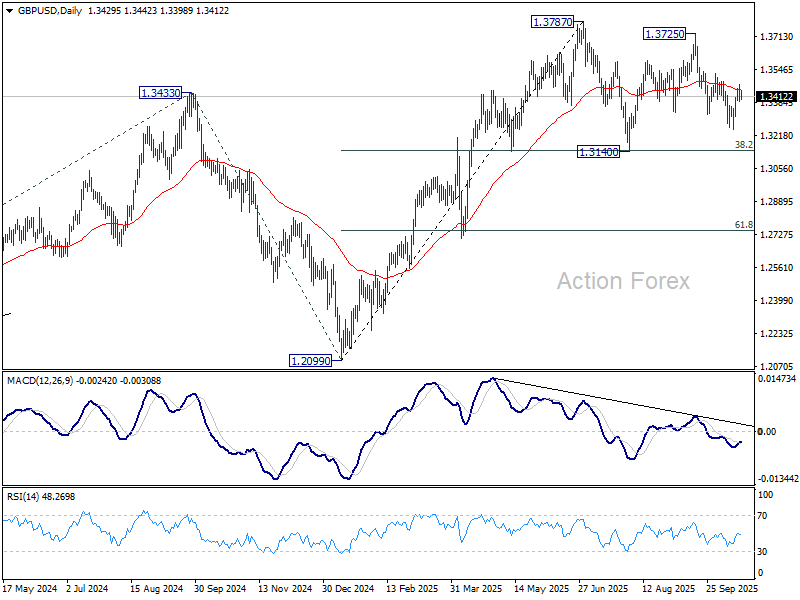
In the bigger picture, rise from 1.0351 (2022 low) is still seen as a corrective move. Further rally could be seen to 61.8% projection of 1.0351 to 1.3433 (2024 high) from 1.2099 (2025 low) at 1.4004. But strong resistance could emerge from 1.4248 (2021 high) to limit upside. Sustained break of 55 W EMA (now at 1.3191) will argue that a medium term top has already formed and bring deeper fall back to 1.2099.
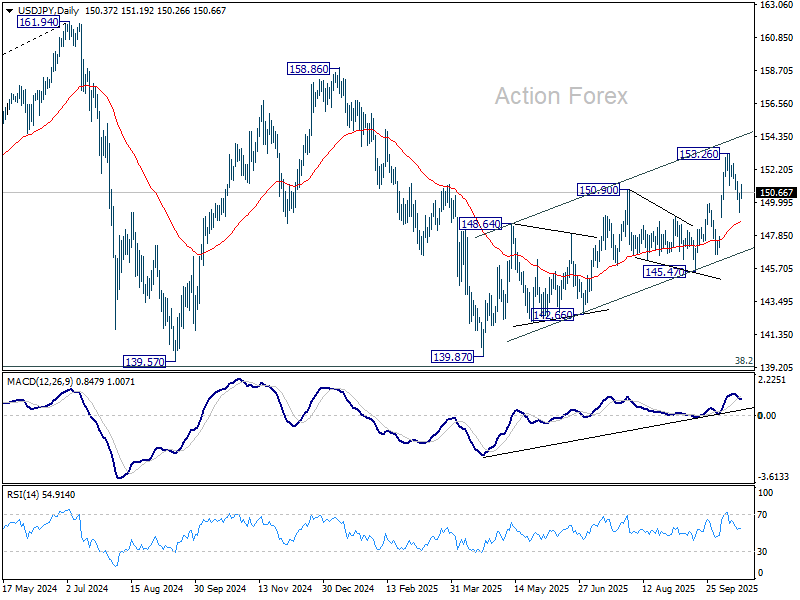
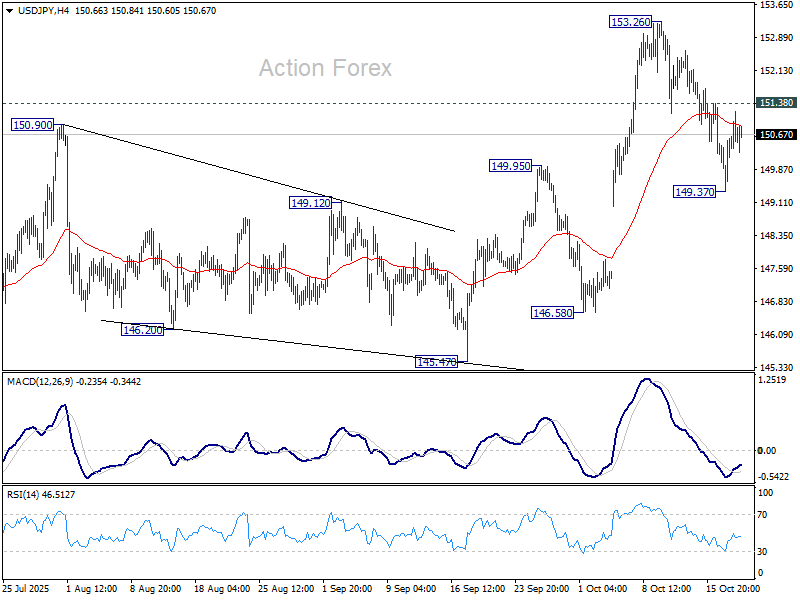
USD/JPY Mid-Day Outlook
Daily Pivots: (S1) 149.79; (P) 150.22; (R1) 151.05; More...
Intraday bias in USD/JPY remains neutral at this point. On the downside, below 149.37 will target 55 D EMA (now at 148.78). Sustained break there will target 145.47 support next. Nevertheless, firm break of 151.38 minor resistance will argue that pullback from 153.26 short term top has completed, and bring retest of this high.
In the bigger picture, current development suggests that corrective pattern from 161.94 (2024 high) has completed with three waves at 139.87. Larger up trend from 102.58 (2021 low) could be ready to resume through 161.94 high. On the downside, break of 145.47 support will dampen this bullish view and extend the corrective pattern with another falling leg.