
Sample Category Title
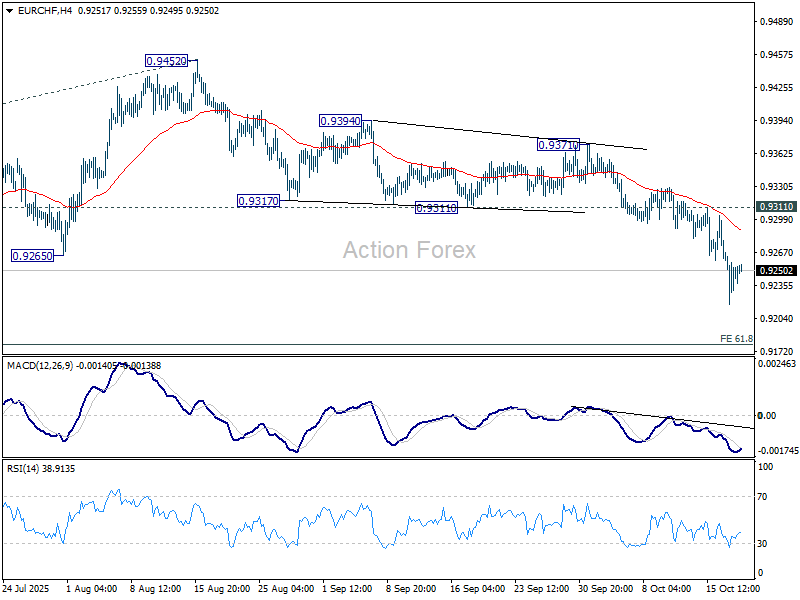
EUR/CHF Daily Outlook
Daily Pivots: (S1) 0.9219; (P) 0.9247; (R1) 0.9276; More...
Intraday bias in EUR/CHF stays on the downside for the moment. Current fall is resuming larger down trend and should target 61.8% projection of 0.9660 to 0.9218 from 0.9452 at 0.9179. Firm break there will target 100% projection at 0.9010. Near term outlook will now stay bearish as long as 0.9311 support turned resistance holds, in case of recovery.
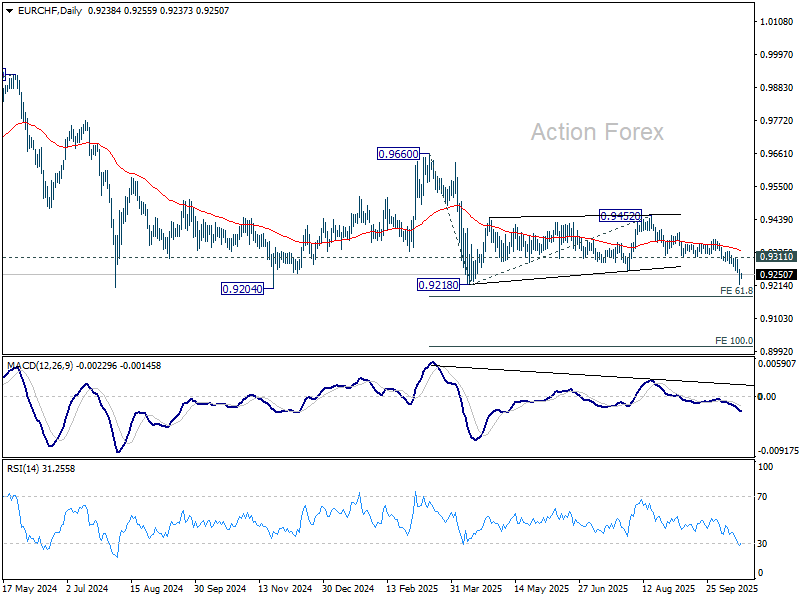
In the bigger picture, outlook remains bearish with EUR/CHF staying well inside long term falling channel after multiple rejection by 55 W EMA (now at 0.9390). Firm break of 0.9204 will resume the whole down trend from 1.2004 (2018 high). Next target is 61.8% projection of 1.1149 to 0.9407 from 0.9928 at 0.8851. Break of 0.9452 resistance is needed to be the first sign of medium term bottoming.
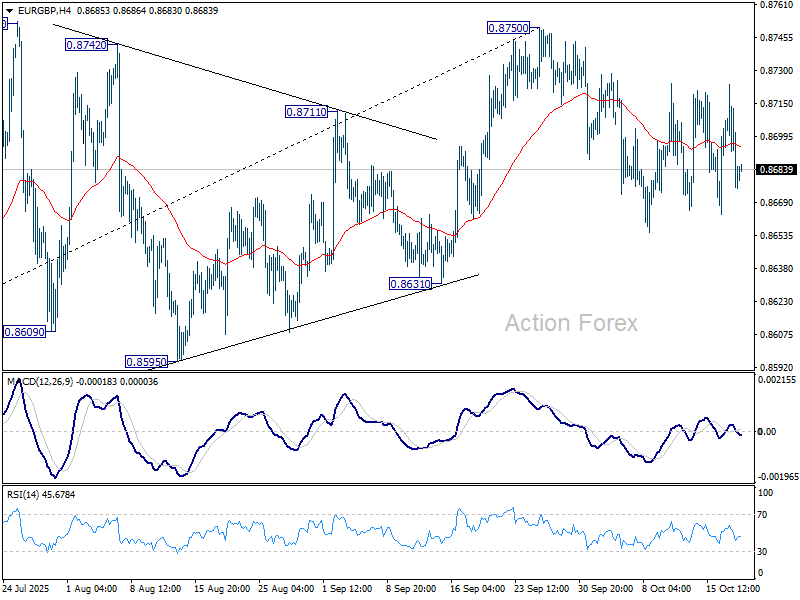
EUR/GBP Daily Outlook
Daily Pivots: (S1) 0.8664; (P) 0.8695; (R1) 0.8710; More…
Range trading continues in EUR/GBP and intraday bias remains neutral for the moment. On the downside, break of 0.8654 will resume the fall from 0.8750. Decisive break there will indicate bearish reversal and target 38.2% retracement of 0.8221 to 0.8750 at 0.8548. Nevertheless, on the upside, break of 0.8750/2 will resume the rise from 0.8221 towards 0.8867 fibonacci level.
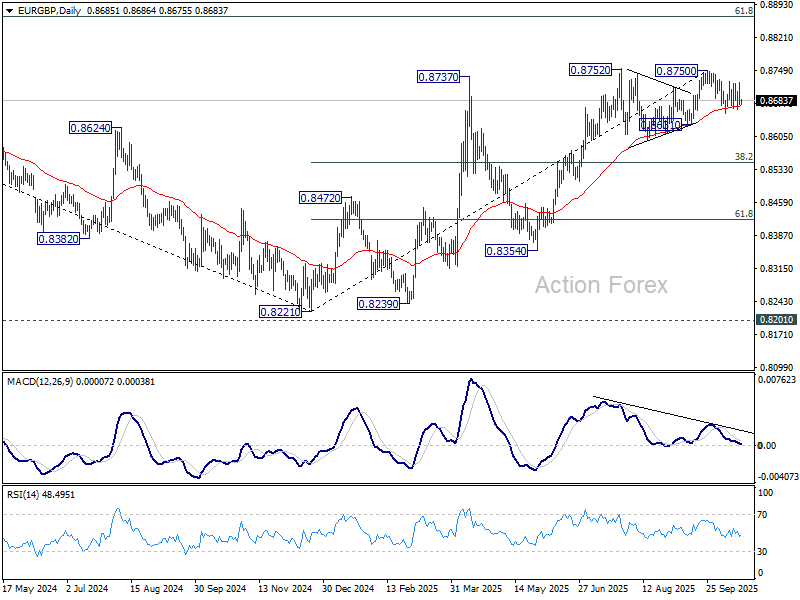
In the bigger picture, rise from 0.8221 medium term bottom is seen as a corrective move. While further rally cannot be ruled out, upside should be limited by 61.8% retracement of 0.9267 to 0.8221 at 0.8867. Considering bearish divergence condition in D MACD, firm break of 0.8631 support will be the first sign that this corrective bounce has completed. Sustained trading below 55 W EMA (now at 0.8549) will confirm, and bring retest of 0.8221 low.
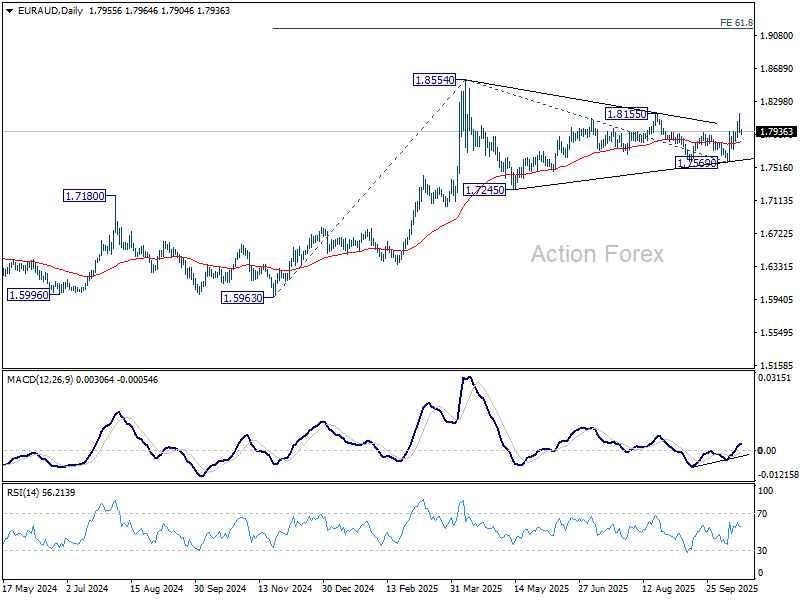
EUR/AUD Daily Outlook
Daily Pivots: (S1) 1.7868; (P) 1.8015; (R1) 1.8093; More...
Intraday bias in EUR/AUD remains neutral for the moment, and more consolidations could be seen first. On the upside, sustained break of 0.8155 resistance will affirm the case that larger up trend is resuming. Further rise should be seen to retest 1.8554 high next. However, break of 1.7818 will dampen this bullish view and turn focus back to 1.7569 support instead.
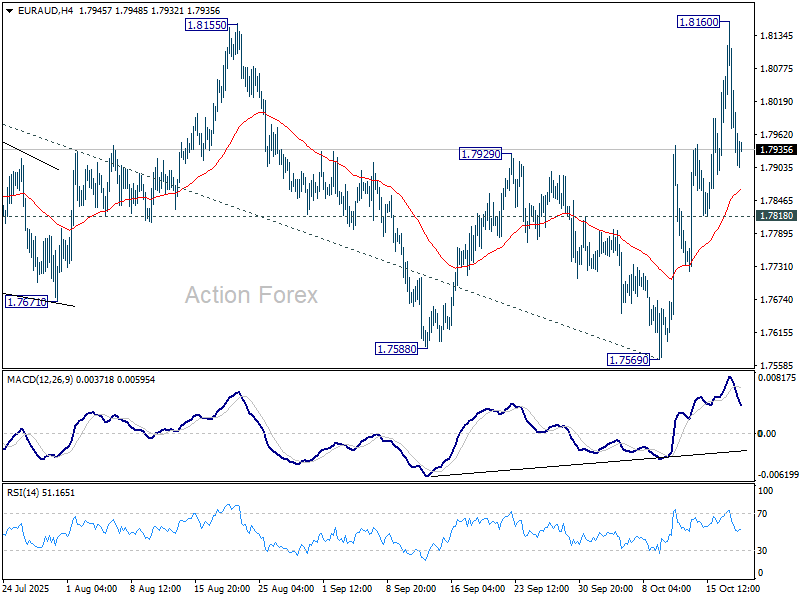
In the bigger picture, price actions from 1.8554 medium term top are seen as a corrective pattern, which might have completed already. Firm break of 1.8554 will resume larger up trend from 1.4281 (2022 low), and target 61.8% projection of 1.5963 to 1.8554 from 1.7569 at 1.9170. Nevertheless, break of 1.7569 support will delay the bullish case and extend the correction from 1.8554.
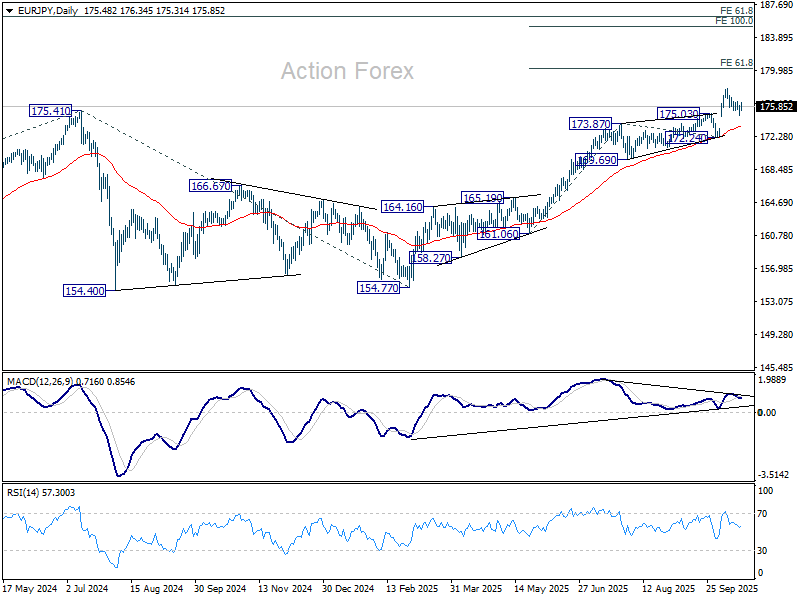
EUR/JPY Daily Outlook
Daily Pivots: (S1) 174.91; (P) 175.44; (R1) 176.06; More...
Intraday bias in EUR/JPY remains neutral for the moment. On the upside, break of 176.44 resistance will suggest that pullback from 177.91 has completed, and bring retest of this high. Further break of 177.91 will resume larger up trend to 61.8% projection of 161.06 to 173.87 from 172.24 at 180.15 next. However, break of 174.80 and sustained trading below 175.03 resistance turned support will indicate that it's already in a larger scale correction, and target 172.24 support.
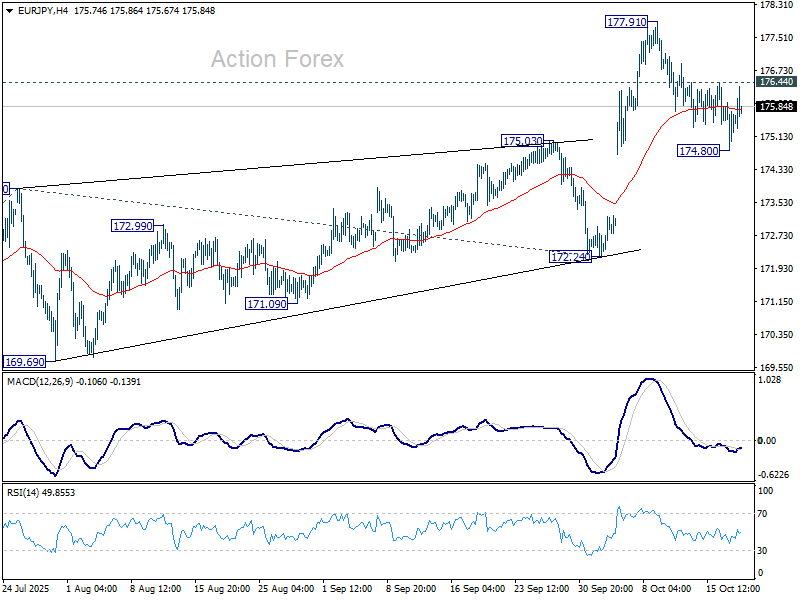
In the bigger picture, up trend from 114.42 (2020 low) is in progress and should target 61.8% projection of 124.37 to 175.41 from 154.77 at 186.31. Firm break of 172.24 support will suggests that it has turned into consolidations again. But still, outlook will continue to stay bullish as long as 55 W EMA (now at 167.43) holds, even in case of deep pullback.
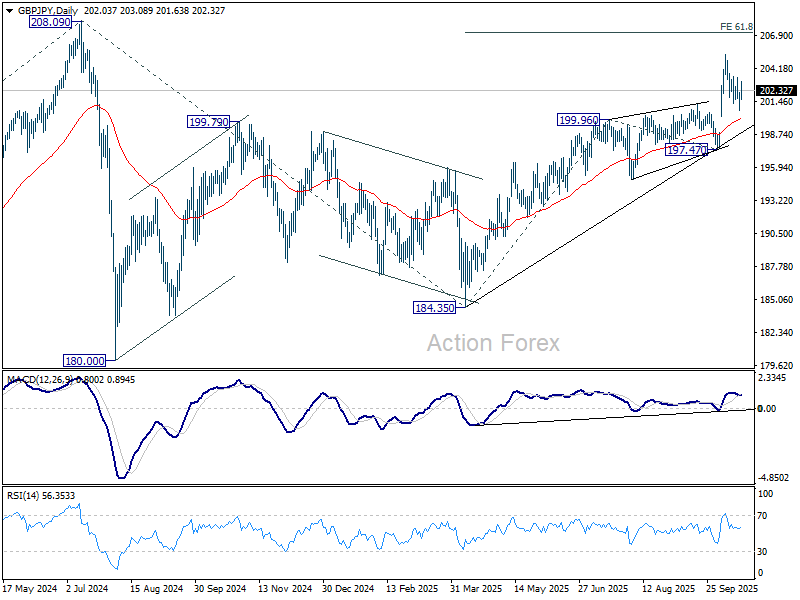
GBP/JPY Daily Outlook
Daily Pivots: (S1) 201.20; (P) 201.72; (R1) 202.76; More...
Intraday bias in GBP/JPY remains neutral for the moment. On the upside, above 203.41 will suggest that pullback from 205.30 has completed, and bring retest of this high. Firm break there will resume larger rally to 61.8% projection of 184.35 to 199.96 from 197.47 at 207.11. However, break of 200.67 and sustained trading below 201.24 resistance turned support will raise the chance of bearish reversal, and bring deeper decline to 197.47 instead.
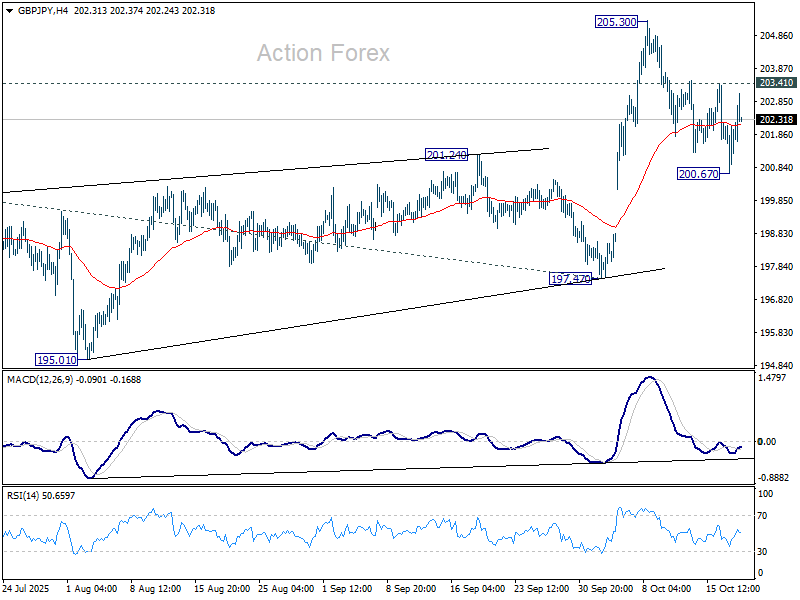
In the bigger picture, price actions from 208.09 (2024 high) are seen as a corrective pattern which might have completed at 184.35. Firm break of 208.09 high will resume the up trend from 123.94 (2020 low). Next target is 61.8% projection of 148.93 to 208.09 from 184.35 at 220.90. However, decisive break of 197.47 will dampen this view and could extend the corrective pattern with another fall.
Nikkei Hits Record as Takaichi Secures Coalition to Become Japan’s First Female PM
Asian equities advanced today, led by the sharp rally in Japan where Nikkei hit record highs after political uncertainty finally cleared. The ruling Liberal Democratic Party struck a coalition agreement with the Japan Innovation Party, ensuring LDP leader Sanae Takaichi will become Japan’s first female prime minister. Investors cheered the prospect of a stable government and continuity in pro-growth economic policy.
The coalition deal, expected to be signed Monday evening between Takaichi and JIP leader Hirofumi Yoshimura, effectively secures Takaichi’s victory in Tuesday’s parliamentary vote. Her ascent is seen as a boost to market confidence, removing the leadership vacuum that had weighed on sentiment in recent weeks. Nikkei’s record-setting performance reflected renewed optimism toward domestic policy coordination and reform momentum.
Economists expect Takaichi to favor fiscal stimulus and resist further monetary tightening, a stance consistent with recent LDP priorities. Such positioning is typically negative for Yen and Japanese bonds but supportive for equities and corporate profits.
Sentiment was also lifted by slightly better-than-expected Chinese GDP data. Growth slowed to 4.8% in Q3, the weakest in a year but still above forecasts. Industrial output accelerated sharply, offsetting deeper weakness in property and private investment. While the overall picture remains uneven, the resilience reinforced the perception that Beijing remains on track to meet its “around 5%” growth target.
Diplomatic news further helped risk appetite. A phone call between U.S. Treasury Secretary Scott Bessent and Chinese Vice Premier He Lifeng last Friday was described as productive, with both sides agreeing to continue discussions in Malaysia later this week. The constructive tone fueled hopes of avoiding the threatened 100% tariffs scheduled for November 1.
Across FX markets, risk currencies outperformed. Kiwi led gains after local CPI data showed inflation holding at the top of the RBNZ’s target band, followed by Aussie and Euro. In contrast, the Dollar, Yen, and Swiss Franc weakened as investors rotated into higher-beta assets. Sterling and Loonie traded in the middle of the field.
In Asia, at the time of writing, Nikkei is up 2.90%. Hong Kong HSI is up 2.22%. China Shanghai SSE is up 0.57%. Singapore is on holiday. Japan 10-year JGB yield is up 0.038 at 1.669.
BoJ's Takata repeats call for rate hike warns inflation risks overshooting
BoJ board member Hajime Takata reinforced his hawkish stance today, arguing that Japan has roughly achieved the 2% inflation goal and now risks overshooting it. In a speech, Takata said steady gains in wages and prices show the economy is strong enough to withstand further normalization, calling the current environment a “prime opportunity to raise interest rates.”
Takata was one of two board members who dissented at the September meeting, when the BoJ voted to keep its policy rate at 0.5%. He instead proposed a 25bps hike to 0.75%.
Citing the BOJ’s October Tankan survey and feedback from branch managers, Takata said improvements in employment and income are supporting private consumption. He emphasized that both wage and price-setting behaviors have changed materially, signaling that Japan’s economy has entered a new phase after decades of deflationary mindset.
NZ CPI jumps to 3% in Q3, hits top of RBNZ target band
New Zealand’s inflation pulse picked up in the Q3, highlighting lingering price pressures that could restrain the RBNZ from cutting rates too aggressively. Headline CPI rose 1.0% qoq, above forecasts of 0.8% and sharply higher than 0.5% pace in Q2. On an annual basis, inflation climbed from 2.7% yoy to 3.0% yoy, matching expectations but reaching the top of the central bank’s target band and its highest level since mid-2024.
Much of the rebound came from tradeable prices, which rose 2.2% yoy versus 1.2% previously, suggesting imported cost pressures are resurfacing. By contrast, non-tradeable inflation eased slightly from 3.7% yoy to 3.5%, hinting at some moderation in domestic demand.
Even so, the composition of inflation is concerning: housing and utilities accounted for nearly one-third of the total rise in the annual CPI. Electricity prices jumped 11.3%, rents increased 2.6%, and local authority rates surged 8.8%.
With these three categories making up just 17% of the CPI basket, the data underline how sticky living costs have become. For the RBNZ, which only recently delivered an outsized 50bps rate cut to counter slowing growth, this renewed inflation uptick narrows its policy flexibility.
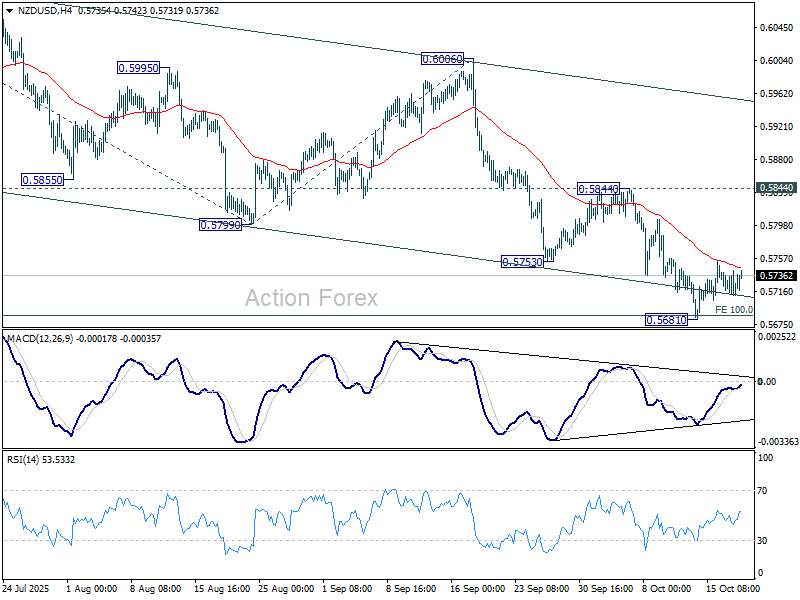
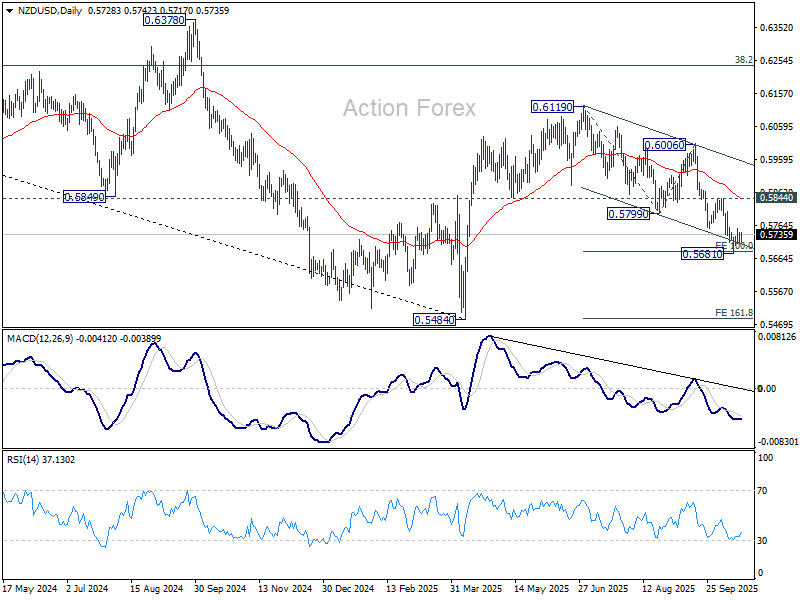
NZD/USD bounces slightly in consolidations, CPI fails to shift bearish outlook
New Zealand Dollar found modest support after Q3 CPI data showed inflation rising back to the top of the RBNZ’s 1–3% target band. The 3.0% annual print, while firmer than Q2’s 2.7%, was largely in line with expectations and matched the RBNZ’s own August forecast. While the data limits the case for another large rate cut like the 50bps one at last meeting, it doesn't materially alter the easing bias.
The RBNZ has signaled confidence that inflation will gradually ease toward 2% by mid-2026 as economic slack expands. The latest data confirm that while imported, or tradeable, inflation picked up, non-tradeable inflation — the domestically driven component — continued to cool, reinforcing the central bank’s belief that underlying pressures are softening. That leaves the door open for another 25bps cut later this year.
Technically, NZD/USD has just hit 100% projection of 0.6119 to 0.5799 from 0.6006 at 0.5686 last week. Considering bullish convergence condition in 4H MACD too, a short term bottom is likely formed at 0.5681. Some consolidations is likely in the near term, with prospect of stronger recovery.
But outlook will stay bearish as long as 0.5844 resistance holds. Firm break of 0.5681 will resume the whole fall from 0.6119 to 161.8% projection at 0.5488, which is close to 0.5484 key support (2025 low so far).
China GDP growth slows to 4.8% in Q3, property slump deepens
China’s GDP expanded 4.8% yoy in the Q3, the slowest pace in a year but still slightly ahead of expectations for 4.7%. Even so, with cumulative growth of 5.2% over the first nine months, China remains on track to meet its full-year target of “around 5%”.
Industrial production provided a bright spot, climbing 6.5% yoy in September, up sharply from August’s 5.2% and well above expectations of 5.0%. Retail sales also beat expectations of 2.9% yoy slightly, rising 3.0% even as the pace slowed from 3.4%, pointing to modest resilience in consumption.
Yet beneath the surface, the investment picture deteriorated further. Fixed-asset investment slipped -0.5% year-to-date yoy. Property investment fell -13.9%, extending the sector’s prolonged drag on growth. Private investment declined -3.1%, marking a deeper contraction than earlier in the year, and even ex-property investment slowed from 4.2% to 3.0% growth.
The data reaffirm that while parts of the industrial economy are stabilizing, domestic demand and investor sentiment remain fragile.
Inflation week with CPI from the US, UK and Canada
Other than trade policy, this week’s economic narrative revolves around one word: inflation. Consumer price data from the US, UK, Canada and New Zealand headline a critical stretch that will test the conviction of rate-cut expectations across the world’s leading central banks.
With the US government shutdown still in place, investors are bracing for a rare week where one report — Friday’s CPI — could carry disproportionate weight. For the Fed, the timing is crucial. The September CPI figures, gathered before the shutdown began on October 1, will likely be the only federal dataset available before the October 28-29 FOMC meeting.
Consensus forecasts see headline inflation ticking up to 3.1% yoy from 2.9%, with core unchanged at 3.1%. Such results would not disrupt the strong market consensus for a 25bps rate cut this month, though the data could still influence the debate over a follow-up move in December.
In the UK, inflation is again threatening to upend the BoE’s easing roadmap. September CPI is forecast to hit 4.0%, doubling the 2% target. BoE hawks, led by Chief Economist Huw Pill, have been vocal about the risk of premature rate cuts, a stance reinforced by the IMF’s warning that the UK faces the most persistent inflation among G7 peers.
The November BoE meeting remains finely balanced, but another inflation overshoot could make it politically difficult for the BoE to resume cuts this year. .
In Canada, policymakers face a similar dilemma. A surprisingly robust September jobs report has already reduced the odds of a back-to-back rate cut at the upcoming BoC meeting. The September CPI data will provide the final input before a decision, with any renewed inflation momentum likely to reinforce the case for a pause.
Rounding out the week, PMI releases from Australia, Japan, the Eurozone, the UK and the US will offer the broadest read yet on global demand conditions — with the US prints carrying extra weight as one of the few near-term gauges of economic activity during the data blackout.
Here are some highlights for the week:
- Monday: New Zealand CPI; China rate decision, GDP, industrial production, retail sales, fixed asset investment; Germany PPI; Canada IPPI and RMPI.
- Tuesday: New Zealand trade balance; Swiss Trade balance; Canada CPI.
- Wednesday: Japan trade balance; UK CPI, PPI.
- Thursday: Canada retail sales; Eurozone consumer confidence.
- Friday: Australia PMIs; Eurozone PMIs; UK retail sales, PMIs; US CPI, PMIs.
GBP/JPY Daily Outlook
Daily Pivots: (S1) 201.20; (P) 201.72; (R1) 202.76; More...
Intraday bias in GBP/JPY remains neutral for the moment. On the upside, above 203.41 will suggest that pullback from 205.30 has completed, and bring retest of this high. Firm break there will resume larger rally to 61.8% projection of 184.35 to 199.96 from 197.47 at 207.11. However, break of 200.67 and sustained trading below 201.24 resistance turned support will raise the chance of bearish reversal, and bring deeper decline to 197.47 instead.
In the bigger picture, price actions from 208.09 (2024 high) are seen as a corrective pattern which might have completed at 184.35. Firm break of 208.09 high will resume the up trend from 123.94 (2020 low). Next target is 61.8% projection of 148.93 to 208.09 from 184.35 at 220.90. However, decisive break of 197.47 will dampen this view and could extend the corrective pattern with another fall.
BoJ’s Takata repeats call for rate hike warns inflation risks overshooting
BoJ board member Hajime Takata reinforced his hawkish stance today, arguing that Japan has roughly achieved the 2% inflation goal and now risks overshooting it. In a speech, Takata said steady gains in wages and prices show the economy is strong enough to withstand further normalization, calling the current environment a “prime opportunity to raise interest rates.”
Takata was one of two board members who dissented at the September meeting, when the BoJ voted to keep its policy rate at 0.5%. He instead proposed a 25bps hike to 0.75%..
Citing the BOJ’s October Tankan survey and feedback from branch managers, Takata said improvements in employment and income are supporting private consumption. He emphasized that both wage and price-setting behaviors have changed materially, signaling that Japan’s economy has entered a new phase after decades of deflationary mindset.
EUR/USD Upside Looks Capped As Market Momentum Turns Cautious
Key Highlights
- EUR/USD started a recovery wave above the 1.1620 resistance.
- It cleared a major bearish trend line with resistance at 1.1660 on the 4-hour chart.
- GBP/USD started a recovery wave above 1.3400 but faces hurdles.
- Gold rallied to a fresh all-time high above $4,350 before correcting some gains.
EUR/USD Technical Analysis
The Euro started a recovery wave from 1.1540 against the US Dollar. EUR/USD formed a base and cleared the 1.1600 barrier.
Looking at the 4-hour chart, the pair traded above the 38.2% Fib retracement level of the downward move from the 1.1918 swing high to the 1.1542 low. Besides, it cleared a major bearish trend line with resistance at 1.1660.
However, the bears remained active near the 1.1730 level and the 50% Fib retracement level of the downward move from the 1.1918 swing high to the 1.1542 low.
On the downside, the pair might find support at 1.1630. The main support might be 1.1600. A close below 1.1600 could start a major pullback toward 1.1550. Any more losses might open the doors for a test of 1.1500.
On the upside, the pair faces resistance near the 1.1720 level and the 200 simple moving average (green, 4-hour). The next hurdle could be near 1.1775. A close above 1.1775 resistance might push the pair to 1.1850.
Looking at GBP/USD, the pair started a recovery wave, but the bears might remain active near the 1.3450 and 1.3460 levels.
Upcoming Key Economic Events:
- ECB's Schnabel speech.
- ECB's Nagel speech.
NZD/USD bounces slightly in consolidations, CPI fails to shift bearish outlook
New Zealand Dollar found modest support after Q3 CPI data showed inflation rising back to the top of the RBNZ’s 1–3% target band. The 3.0% annual print, while firmer than Q2’s 2.7%, was largely in line with expectations and matched the RBNZ’s own August forecast. While the data limits the case for another large rate cut like the 50bps one at last meeting, it doesn't materially alter the easing bias.
The RBNZ has signaled confidence that inflation will gradually ease toward 2% by mid-2026 as economic slack expands. The latest data confirm that while imported, or tradeable, inflation picked up, non-tradeable inflation — the domestically driven component — continued to cool, reinforcing the central bank’s belief that underlying pressures are softening. That leaves the door open for another 25bps cut later this year.
Technically, NZD/USD has just hit 100% projection of 0.6119 to 0.5799 from 0.6006 at 0.5686 last week. Considering bullish convergence condition in 4H MACD too, a short term bottom is likely formed at 0.5681. Some consolidations is likely in the near term, with prospect of stronger recovery.
But outlook will stay bearish as long as 0.5844 resistance holds. Firm break of 0.5681 will resume the whole fall from 0.6119 to 161.8% projection at 0.5488, which is close to 0.5484 key support (2025 low so far).
China GDP growth slows to 4.8% in Q3, property slump deepens
China’s GDP expanded 4.8% yoy in the Q3, the slowest pace in a year but still slightly ahead of expectations for 4.7%. Even so, with cumulative growth of 5.2% over the first nine months, China remains on track to meet its full-year target of “around 5%”.
Industrial production provided a bright spot, climbing 6.5% yoy in September, up sharply from August’s 5.2% and well above expectations of 5.0%. Retail sales also beat expectations of 2.9% yoy slightly, rising 3.0% even as the pace slowed from 3.4%, pointing to modest resilience in consumption.
Yet beneath the surface, the investment picture deteriorated further. Fixed-asset investment slipped -0.5% year-to-date yoy. Property investment fell -13.9%, extending the sector’s prolonged drag on growth. Private investment declined -3.1%, marking a deeper contraction than earlier in the year, and even ex-property investment slowed from 4.2% to 3.0% growth.
The data reaffirm that while parts of the industrial economy are stabilizing, domestic demand and investor sentiment remain fragile.