
Sample Category Title
AUD/USD Weekly Report
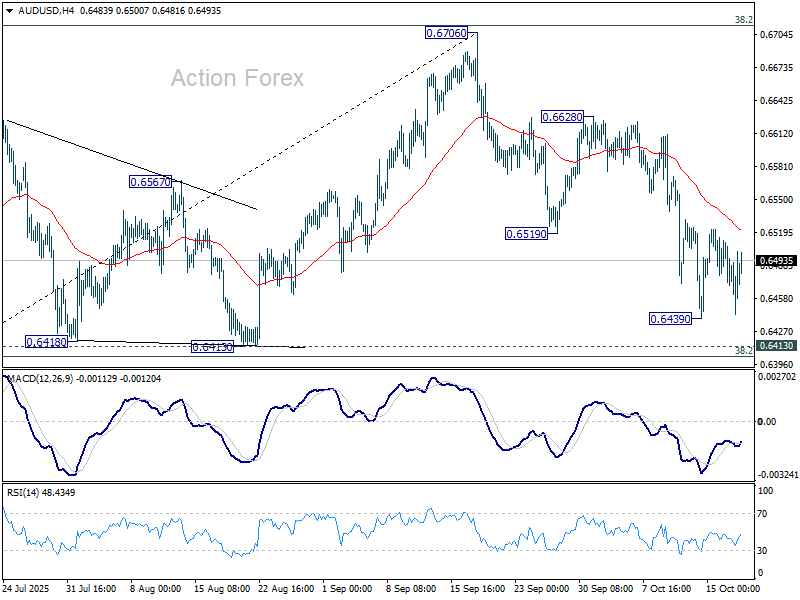
AUD/USD's fall from 0.6706 extended lower to 0.6439 last week but turned sideway. Initial bias stays neutral this week first. Further decline is in favor as long as 55 D EMA (now at 0.6545) holds. Below 0.6439 will target 0.6413 cluster support (38.2% retracement of 0.5913 to 0.6706 at 0.6403. Decisive break there will indicate bearish reversal after rejection by 0.6713 fibonacci level. Nevertheless, sustained trading above 55 D EMA will keep the rise from 0.5913 intact, and bring retest of 0.6706 high.
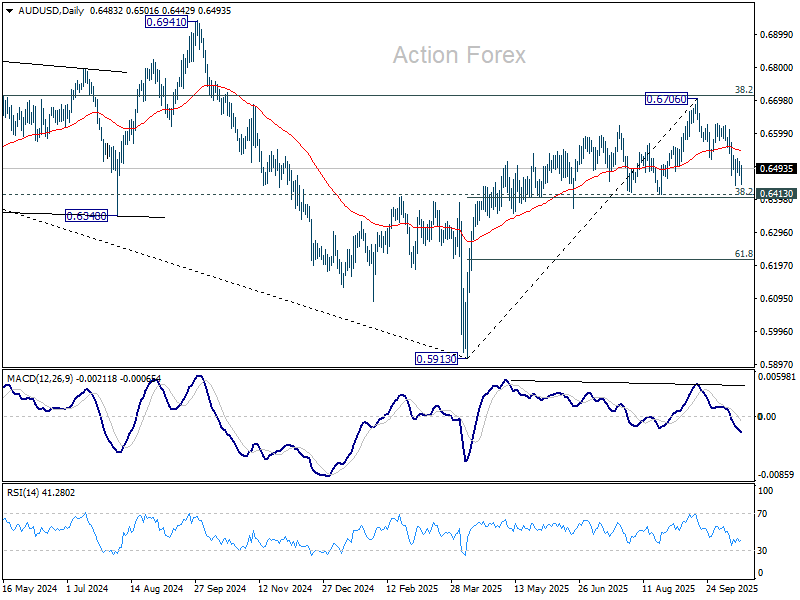
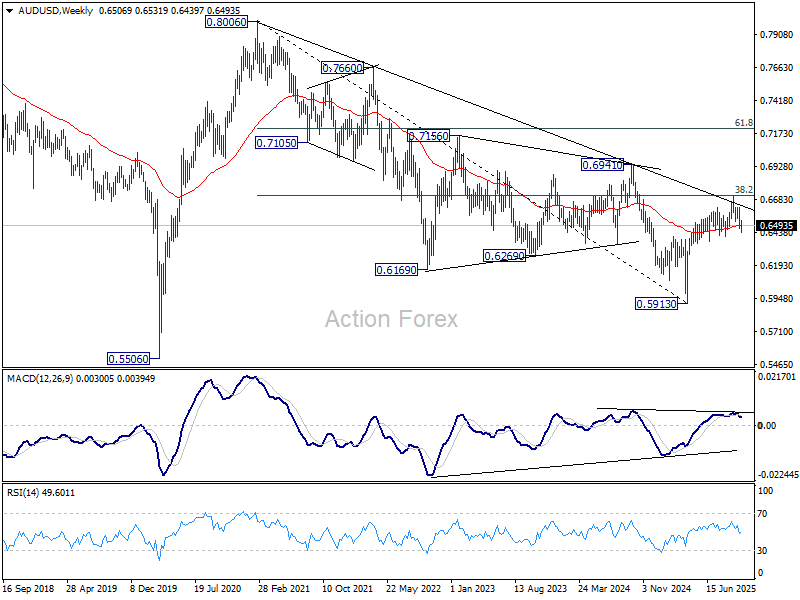
In the bigger picture, there is no clear sign that down trend from 0.8006 (2021 high) has completed. Rebound from 0.5913 is seen as a corrective move. Outlook will remain bearish as long as 38.2% retracement of 0.8006 to 0.5913 at 0.6713 holds. Nevertheless, considering bullish convergence condition in W MACD, sustained break of 0.6713 will be a strong sign of bullish trend reversal, and pave the way to 0.6941 structural resistance for confirmation.
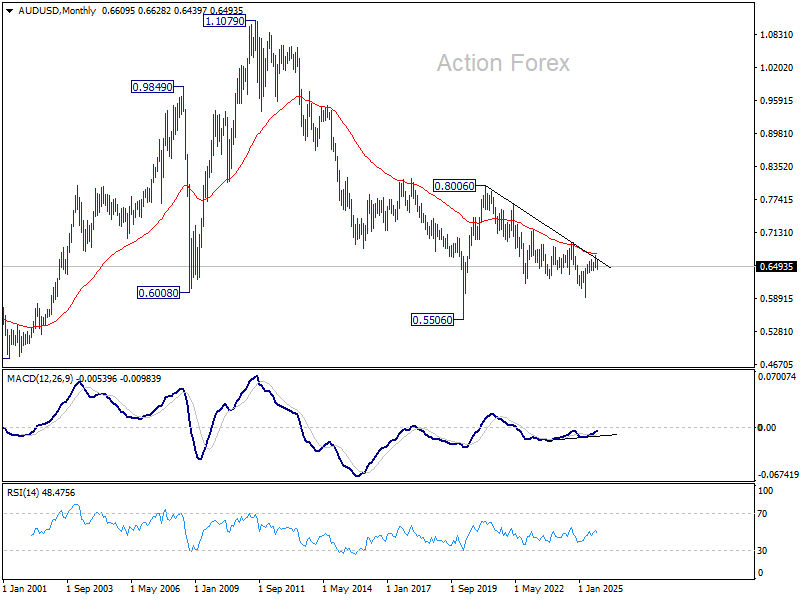
In the long term picture, fall from 0.8006 is seen as the second leg of the corrective pattern from 0.5506 long term bottom (2020 low). Hence, in case of deeper decline, strong support should emerge above 0.5506 to contain downside to bring reversal. On the upside, firm break of 0.6941 will argue that the third leg has already started back to 0.8006.
USD/CAD Weekly Outlook
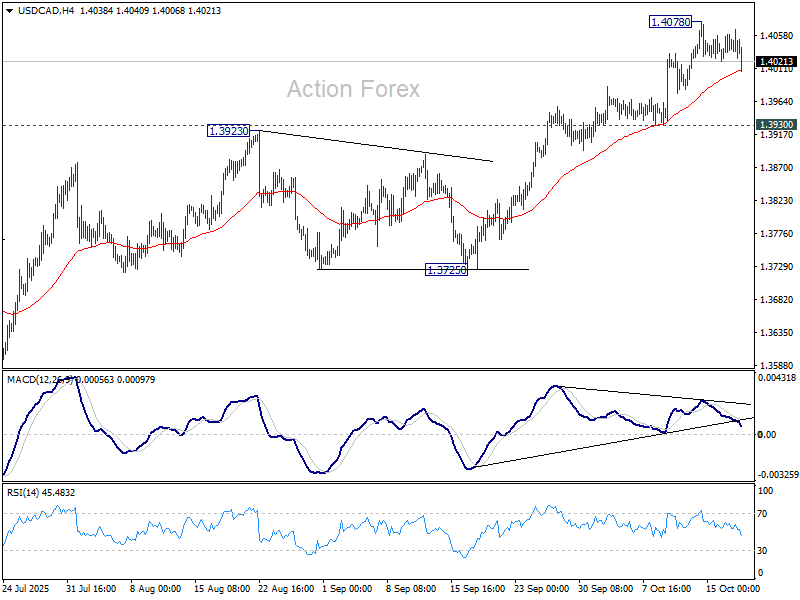
USD/CAD rose further to 1.4078 last week but formed a temporary top there and retreated. Initial bias remains neutral this week for some more consolidations. Further rally is expected as long as 1.3930 support holds. Current development suggest that rise from 1.3538 is reversing whole fall from 1.4791. Above 1.4078 will target 61.8% retracement of 1.4791 to 1.3538 at 1.4312.
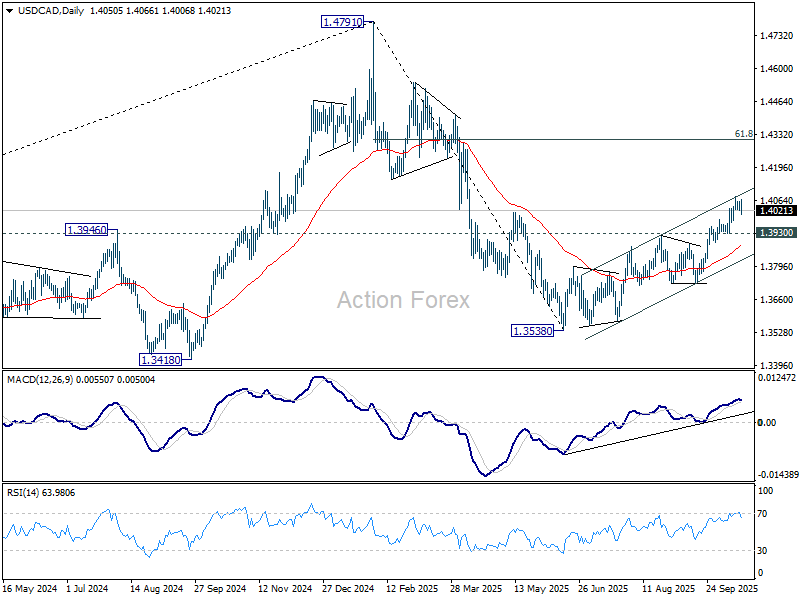
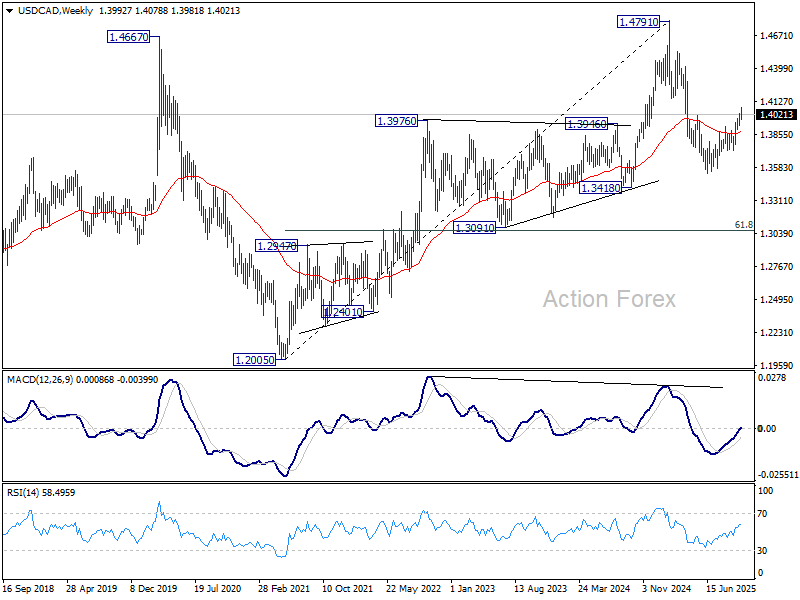
In the bigger picture, price actions from 1.4791 medium term top is likely just unfolding as a correction to up trend from 1.2005 (2021 low). Based on current momentum, rise from 1.3538 is the second leg, and a third leg should follow before up trend resumption. That is, range trading is set to extend for the medium term. For now, this will remain the favored case as long as 1.3725 support holds.
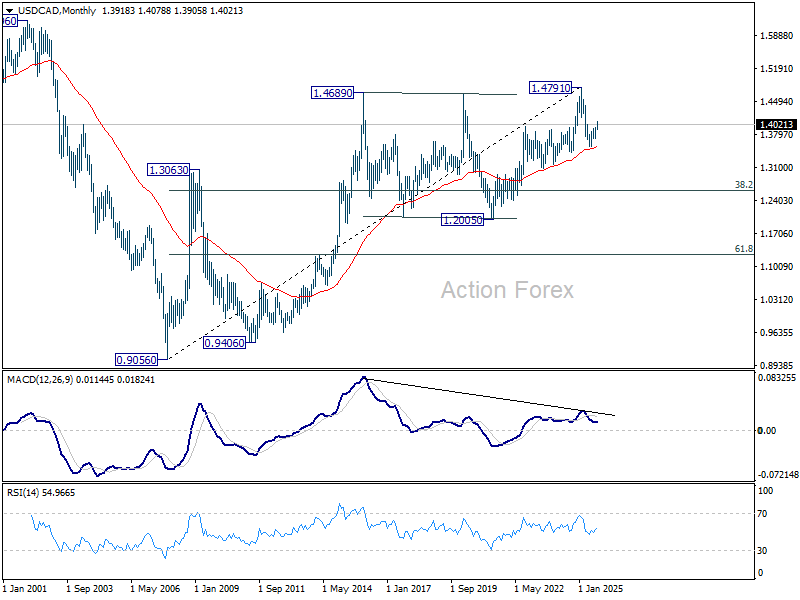
In the long term picture, 55 M EMA (now at 1.3525) remains intact. Thus, up trend from 0.90567 (2007 low) should still be in progress. However, considering bearish divergence condition M MACD, sustained trading below 55 M EMA will argue that the up trend has completed with five waves up to 1.4791, and turn medium term outlook bearish for correction.
GBP/JPY Weekly Outlook
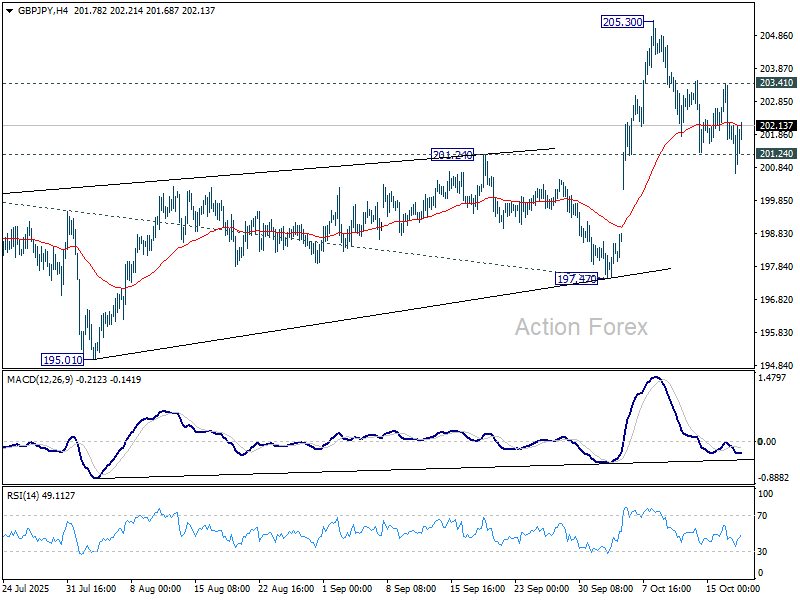
GBP/JPY's pullback from 205.30 extended lower last week but failed to sustained below 201.24 resistance turned support. Initial bias remains neutral this week first and further rally is mildly in favor. On the upside, above 203.41 resistance will bring retest of 205.30 high. However, sustained break of 201.24 will bring deeper fall to 197.47 support instead.
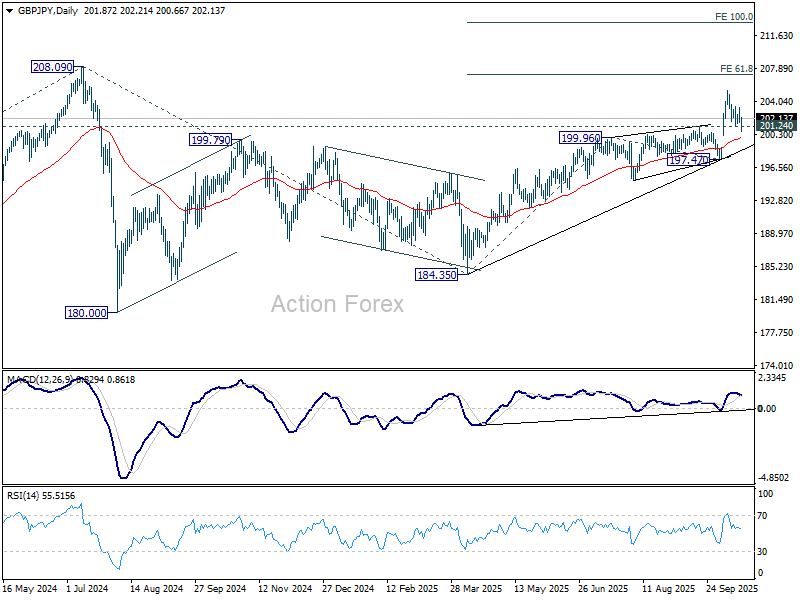
In the bigger picture, price actions from 208.09 (2024 high) are seen as a corrective pattern which might have completed at 184.35. Firm break of 208.09 high will resume the up trend from 123.94 (2020 low). Next target is 61.8% projection of 148.93 to 208.09 from 184.35 at 220.90. However, decisive break of 197.47 will dampen this view and could extend the corrective pattern with another fall.
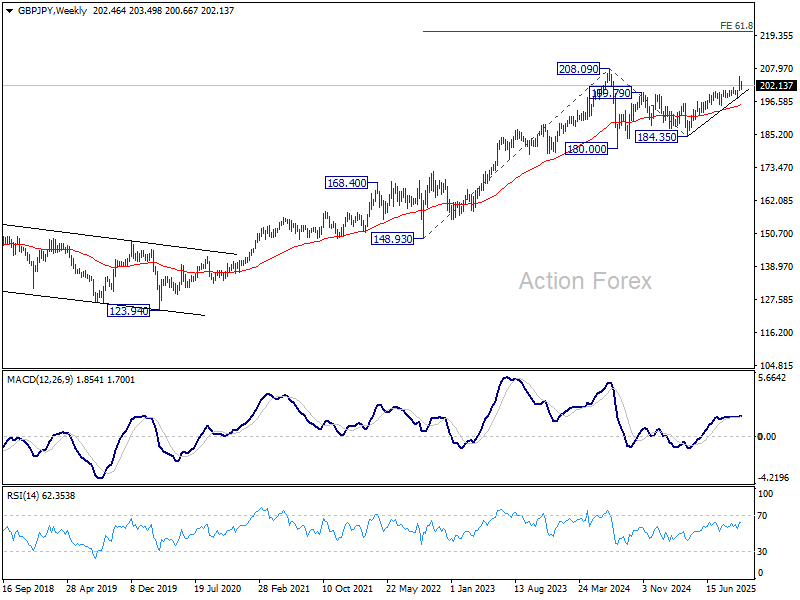
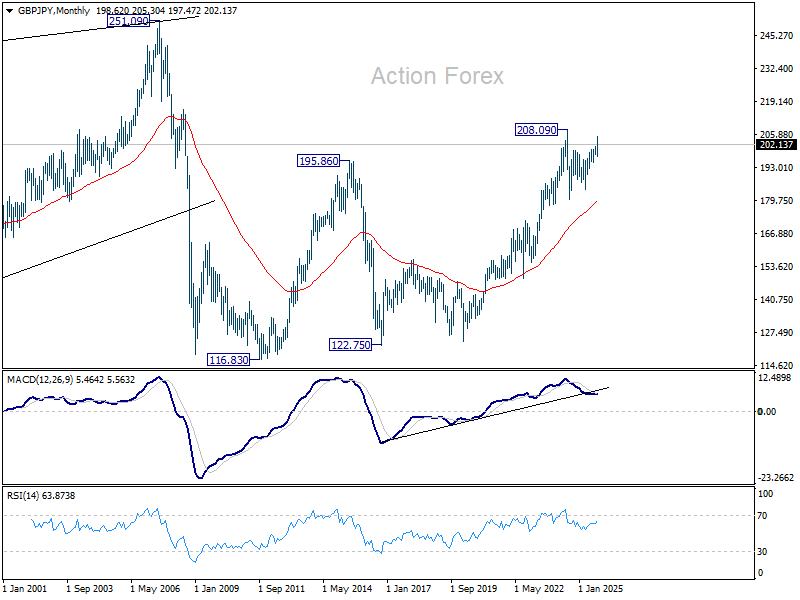
In the long term picture, there is no sign that the long term up trend from 122.75 (2016 low) has concluded. But firm break of 208.09 is needed to confirm resumption. Otherwise, more medium term range trading could still be seen.
EUR/JPY Weekly Outlook
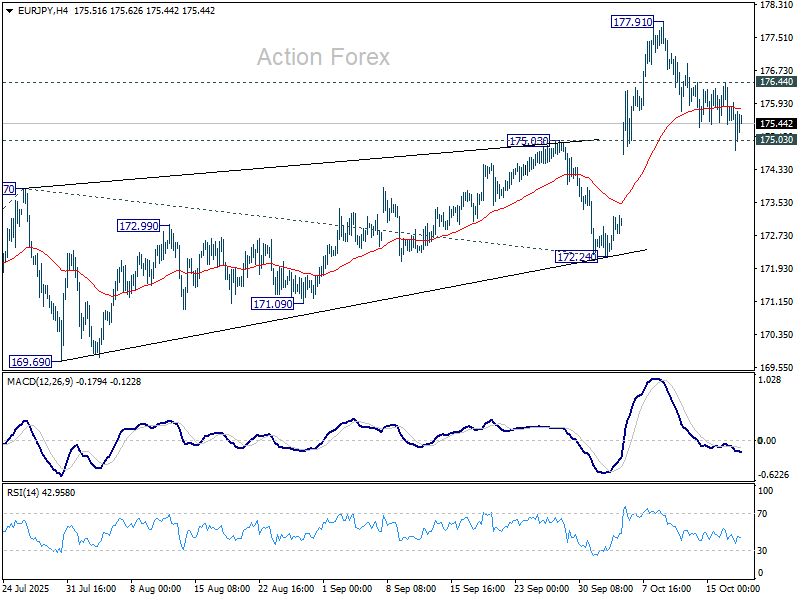
EUR/JPY's pullback from 177.91 extended lower last week but failed to sustain below 175.03 resistance turned support. Initial bias remains neutral this week and further rally is in favor. Above 176.44 minor resistance will turn bias back to the upside for retesting 177.91. However, decisive break of 175.03 will bring deeper decline back to 172.24 support instead.
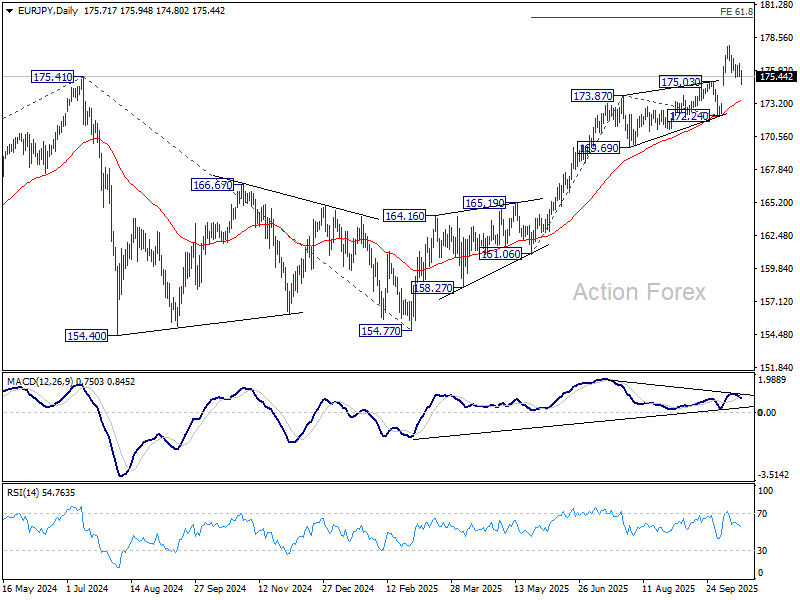
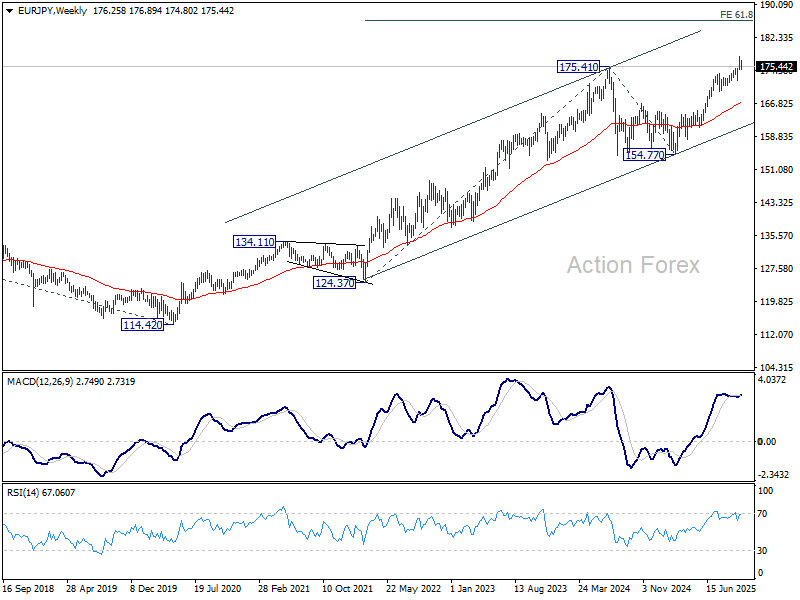
In the bigger picture, up trend from 114.42 (2020 low) is in progress and should target 61.8% projection of 124.37 to 175.41 from 154.77 at 186.31. Firm break of 172.24 support will suggests that it has turned into consolidations again. But still, outlook will continue to stay bullish as long as 55 W EMA (now at 167.16) holds, even in case of deep pullback.
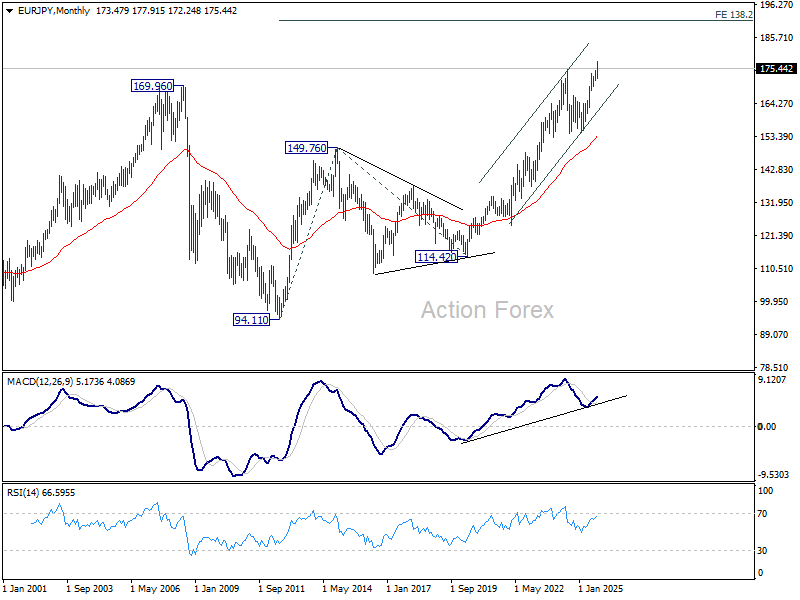
In the long term picture, up trend from 94.11 (2021 low) is in progress. Next target is 138.2% projection of 94.11 to 149.76 (2014 high) from 114.42 (2020 low) at 191.32. This will remain the favored case as long as 154.77 support holds.
EUR/GBP Weekly Outlook
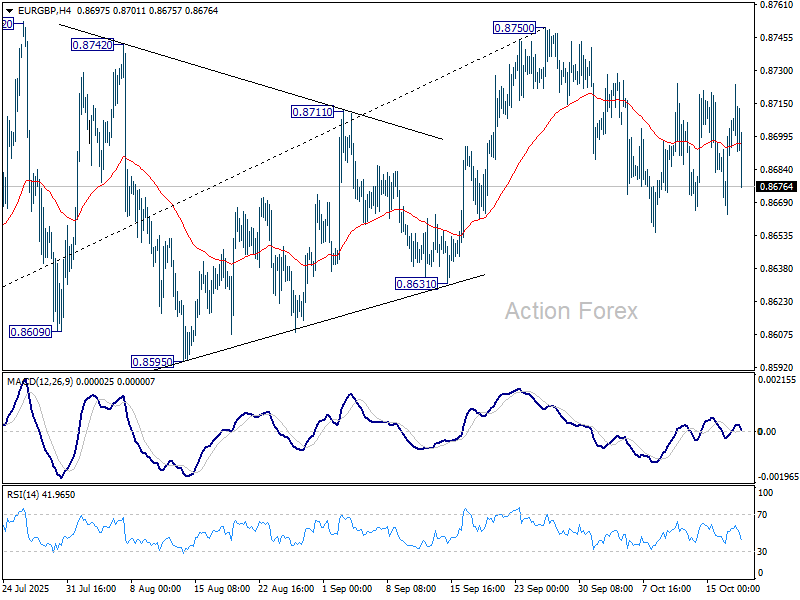
EUR/GBP stayed in sideway trading last week and outlook is unchanged. Initial bias remains neutral this week first. On the downside, break of 0.8654 will resume the fall from 0.8750. Decisive break there will indicate bearish reversal and target 38.2% retracement of 0.8221 to 0.8750 at 0.8548. Nevertheless, on the upside, break of 0.8750/2 will resume the rise from 0.8221 towards 0.8867 fibonacci level.
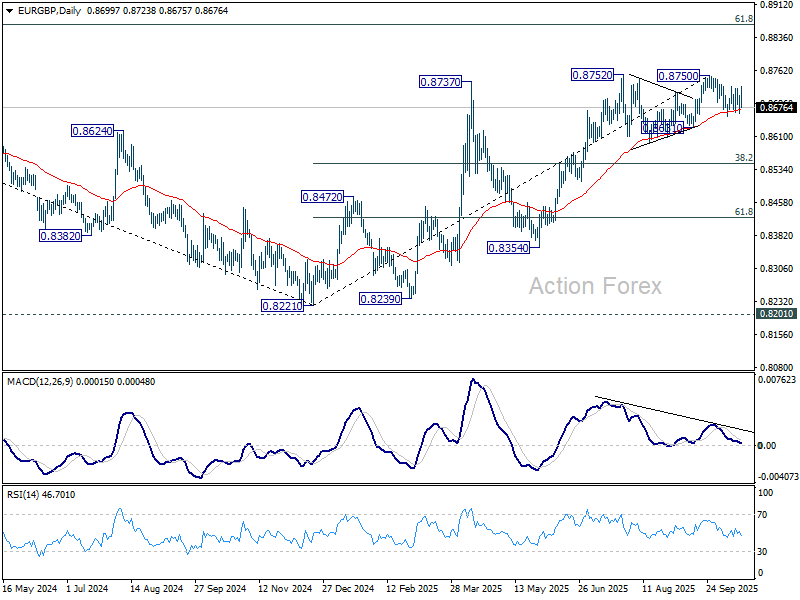
In the bigger picture, rise from 0.8221 medium term bottom is seen as a corrective move. While further rally cannot be ruled out, upside should be limited by 61.8% retracement of 0.9267 to 0.8221 at 0.8867. Considering bearish divergence condition in D MACD, firm break of 0.8631 support will be the first sign that this corrective bounce has completed. Sustained trading below 55 W EMA (now at 0.8549) will confirm, and bring retest of 0.8221 low.
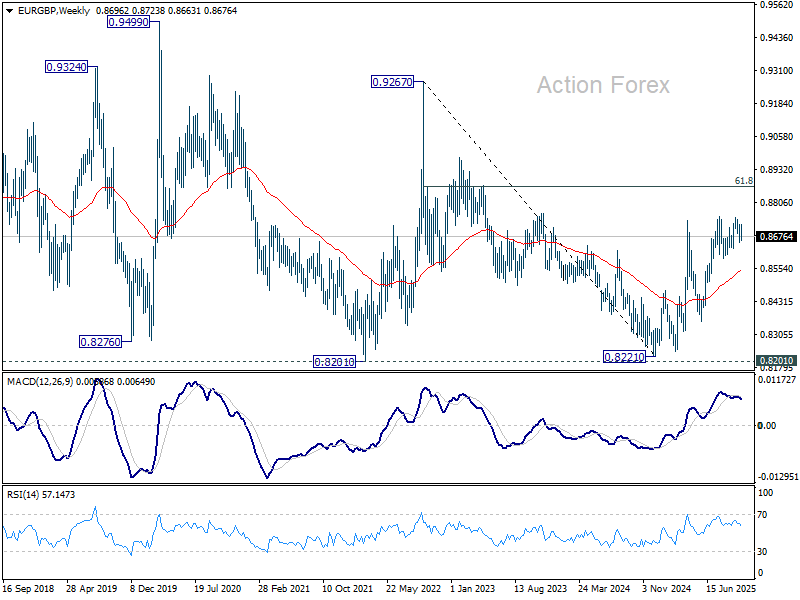
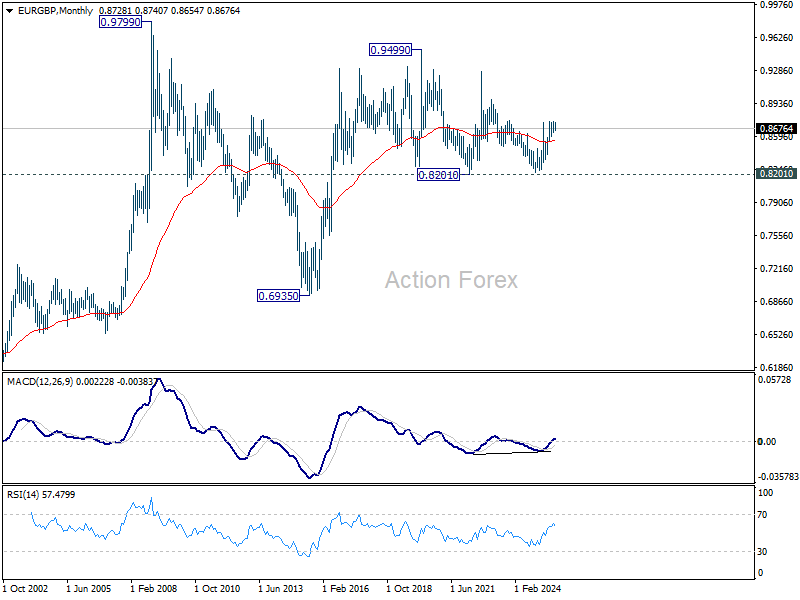
In the long term picture, price action from 0.9499 (2020 high) is seen as part of the long term range pattern from 0.9799 (2008 high). Range trading should continue between 0.8201 and 0.9499, until there is clear signal of imminent breakout.
EUR/AUD Weekly Outlook
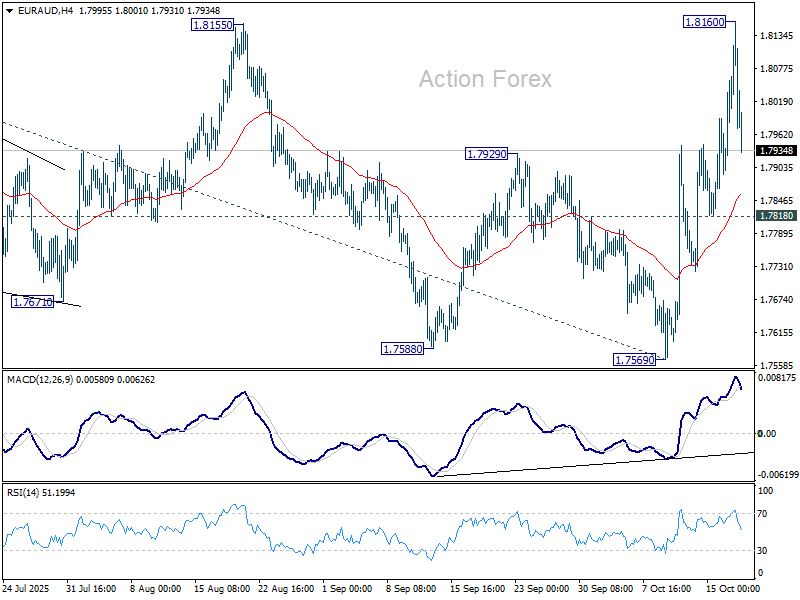
EUR/AUD's strong rally last week suggests that corrective pattern from 1.8554 has completed with three waves to 1.7569. Nevertheless, since a temporary top was formed at 0.8160 after first rejection by 1.8155 resistance, initial bias is turned neutral this week first. On the upside, sustained break of 1.8155 will affirm this bullish case and bring retest of 1.8554 high next. However, break of 1.7818 will dampen this bullish view and turn focus back to 1.7569 support instead.
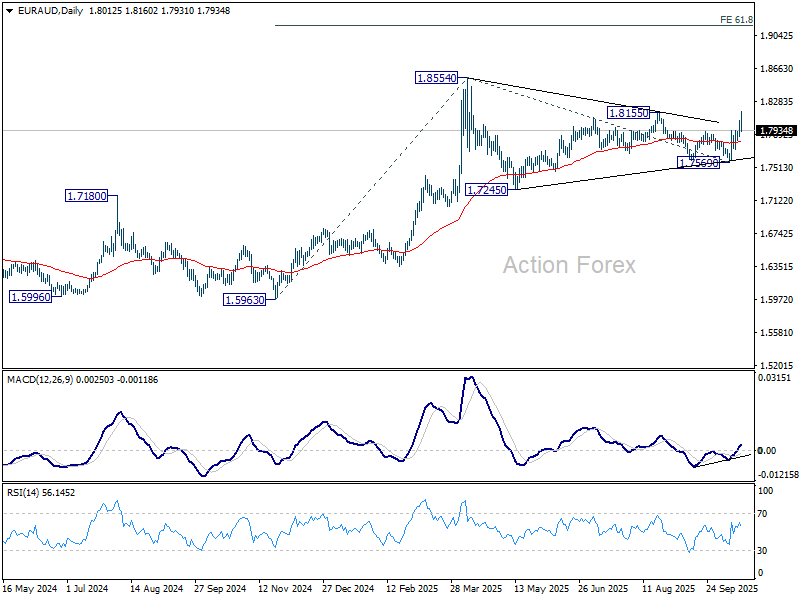
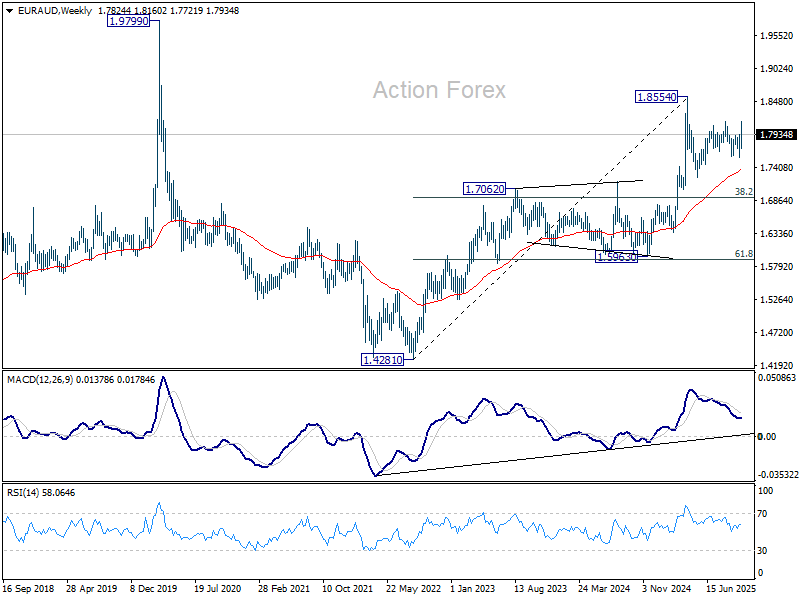
In the bigger picture, price actions from 1.8554 medium term top are seen as a corrective pattern, which might have completed already. Firm break of 1.8554 will resume larger up trend from 1.4281 (2022 low), and target 61.8% projection of 1.5963 to 1.8554 from 1.7569 at 1.9170. Nevertheless, break of 1.7569 support will delay the bullish case and extend the correction from 1.8554.
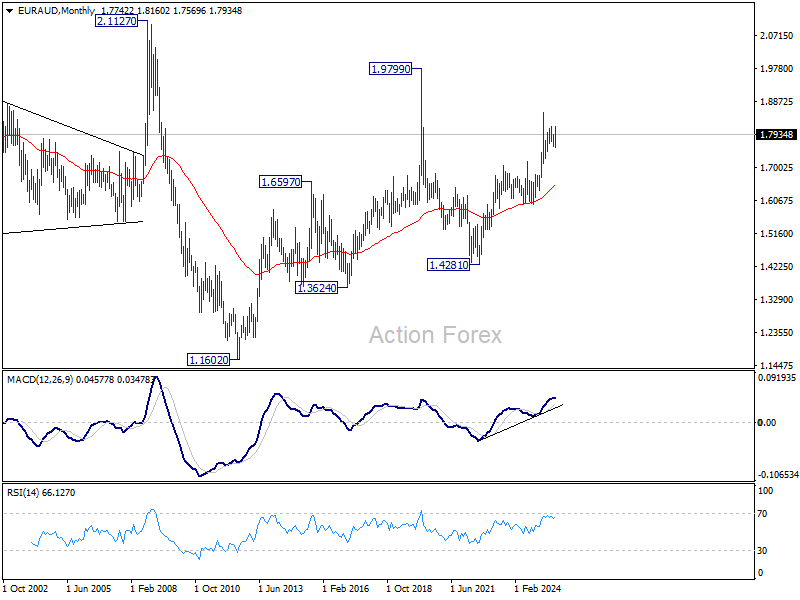
In the longer term picture, rise from 1.4281 is seen as the second leg of the pattern from 1.9799 (2020 high), which is part of the pattern from 2.1127 (2008 high). As long as 55 M EMA (now at 1.6506) holds, this second leg could still extend higher.
EUR/CHF Weekly Outlook
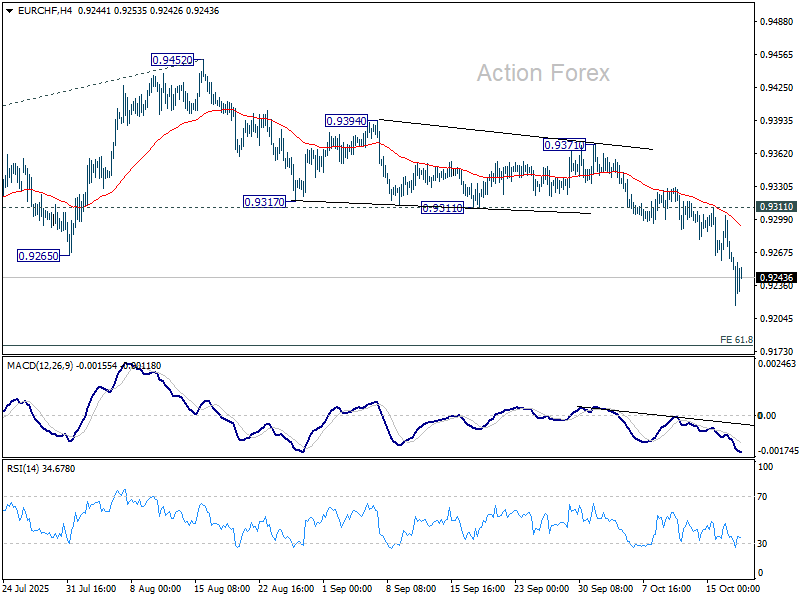
EUR/CHF's decline accelerated lower last week and the development indicates that consolidation pattern from 0.9218 has completed at 0.9452 already. Larger down trend should be ready to resume. Initial bias stays on the downside this week for 61.8% projection of 0.9660 to 0.9218 from 0.9452 at 0.9179. Firm break there will target 100% projection at 0.9010. Near term outlook will now stay bearish as long as 0.9311 support turned resistance holds, in case of recovery.
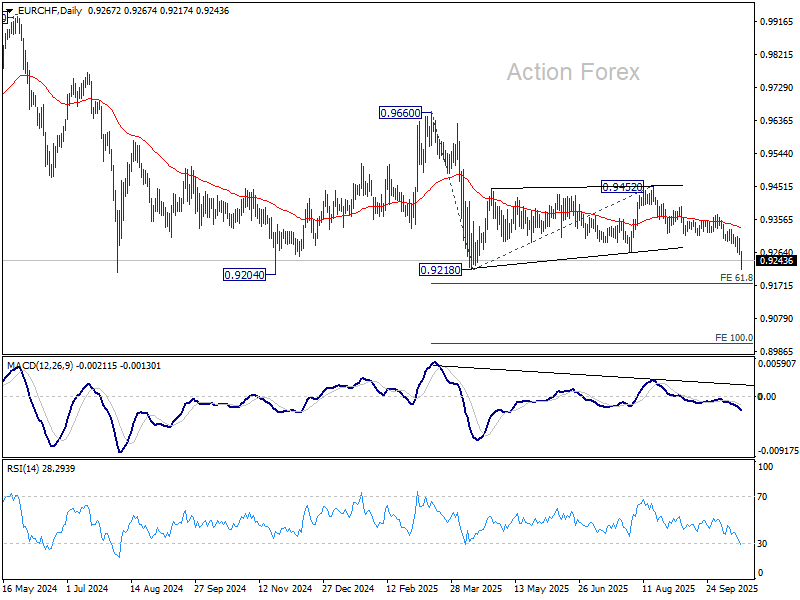
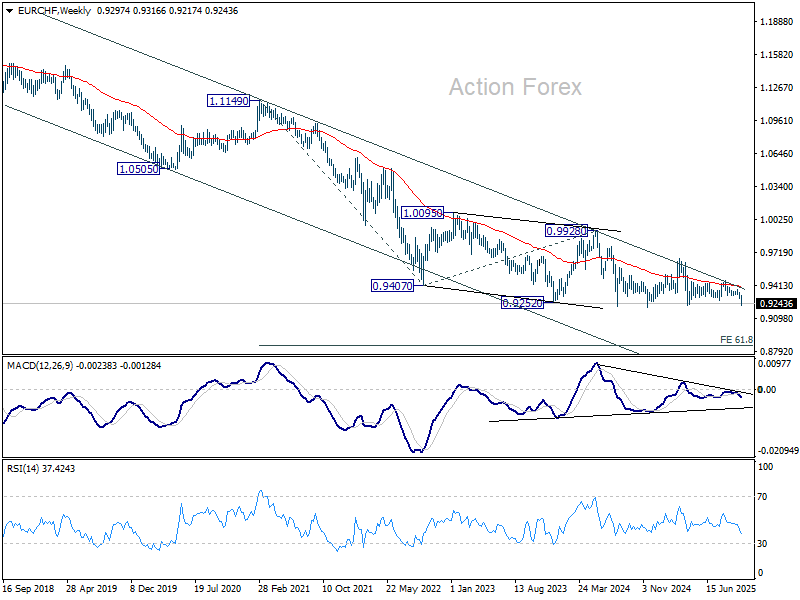
In the bigger picture, outlook remains bearish with EUR/CHF staying well inside long term falling channel after multiple rejection by 55 W EMA (now at 0.9395). Firm break of 0.9204 will resume the whole down trend from 1.2004 (2018 high). Next target is 61.8% projection of 1.1149 to 0.9407 from 0.9928 at 0.8851. Break of 0.9452 resistance is needed to be the first sign of medium term bottoming.
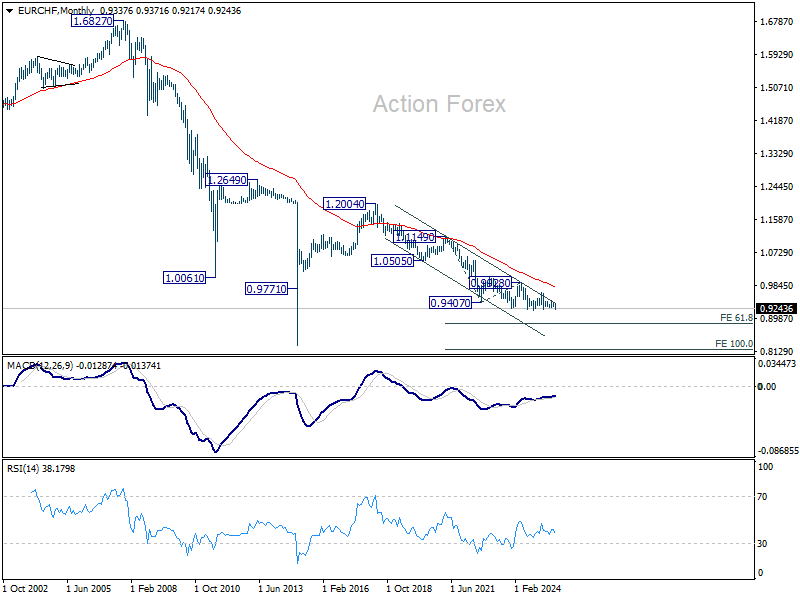
In the long term picture, overall long term down trend is still in progress in EUR/CHF. Outlook will continue to stay bearish as long as 55 M EMA (now at 0.9820) holds.
Markets Weekly Outlook – Tesla, Netflix Earnings, US CPI and China’s Five-Year Plan in Focus as US-China Tensions Simmer
Week in review
Another week has passed by and the US government shutdown continues. Despite this the week was still full of volatility as markets grappled with the ongoing US-China stalemate as well as concerns around the US banking sector later in the week.
As a result safe havens continued to thrive with Gold prices soaring to near $4400/oz before falling around 2.7% on Friday. The drop in Gold came about as President Trump provided a sliver of hope on US-China relations saying "not sustainable" and that he would meet with Xi Jinping in South Korea in a few weeks.
US equities enjoyed a mixed week and struggled on Thursday weighed down by Banking Stocks. US banks borrowed nearly $15 billion from the Federal Reserve's Standing Repo Facility (SRF) on Wednesday and Thursday, the largest borrowing over a two-day period since the Covid-19 pandemic. Market participants were concerned about US credit markets as a result and whether that could affect valuations across markets.
The selloff on Thursday rippled through Asia overnight and weighed on European stocks on Friday wiping out weekly gains.
These concerns came about after major US banks reported stellar earnings earlier in the week.
Despite the mixed week for US and global equity markets, equity funds attracted inflows for a fourth straight week through October 15, as dovish comments from U.S. Federal Reserve Chair Jerome Powell reinforced expectations that the central bank will cut interest rates at its meeting later this month.
Across the globe, investors bought about $2.17 billion worth of stock funds this past week, a figure similar to the week before. This money mainly flowed into U.S. and Asian stock funds, which saw nearly $1 billion in inflows each.
Conversely, European stock funds saw a significant outflow of $1.62 billion, ending a ten-week period of continuous buying. Within the market, interest in funds focused on specific sectors surged by nearly 50%, with the Technology and Healthcare sectors leading all investments..
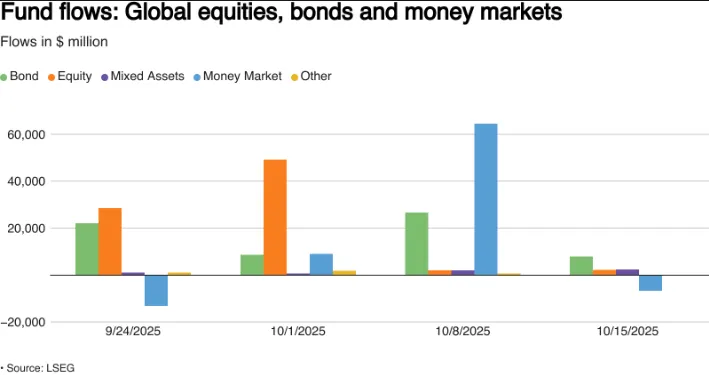
Source: LSEG
Next week the US reporting season heats up and could set the tone for global equity markets. After major banks reported this past week, next week will feature results from several major household names, including Tesla and Netflix which are among the most closely watched reports. We will also get reports from other big names like Procter & Gamble (P&G), Coca-Cola and aerospace giant RTX and tech veteran IBM.
How has the US Dollar Performed?
The U.S. dollar is finishing the week with losses against major global currencies.
The overall dollar index, which tracks the US currency's value, is on track for a 0.44% weekly slide, its largest drop since late July despite a small gain of 0.26% on Friday.
The dollar weakened against the safe-haven Swiss franc, falling 0.1% to its lowest level since mid-September.
Meanwhile, the euro was set for its best weekly gain against the dollar in nine weeks, even though it dipped slightly by 0.22% on Friday.
Finally, the dollar was flat against the Japanese yen, which is also on track to notch a weekly gain, and the British pound (sterling) was down slightly by 0.2% but still poised for a weekly gain.
This week also saw rate cut expectations rise with market participants now pricing in around 51 bps of rate cuts through December 2025, up from around 44 bps earlier in the week.This is based on the LSEG data.
The Week Ahead
Next week will definitely be a busier one as we did have a bit of a data break this week. Obviously the US Government shutdown has hampered US data releases but there was also a lack of high impact data from around the world. .
The week ahead brings a host of high impact data releases from around the globe including inflation data from the US, China and Canada. While we also have a host of Central Bank policymakers speaking.
Let us take a look at some of the key data releases which could shake markets next week.
Asia Pacific Markets
China is facing a pivotal week that will set its economic direction for the next five years, even as new data is expected to confirm a recent slowdown.
From Monday to Wednesday, the Fourth Plenum meetings will be held, with the main goal of discussing China's important 15th Five-Year Plan for the years 2026 to 2030. Key priorities that are expected to be highlighted include boosting consumer spending, driving technological innovation (especially in areas like AI and semiconductors to achieve self-reliance), and generally shifting toward "high-quality development" to secure long-term growth.
Separately, critical economic data is due on Monday:
Loan Prime Rates: The central bank is expected to keep these key interest rates unchanged.
GDP and Property: Official data is likely to show China's third-quarter economic growth slowed substantially to around 4.5% for the year. Key monthly data on retail sales and factory output are also expected to show a deceleration. Additionally, data on property prices is expected to confirm the market is still weak, as the government has not yet announced any major new stimulus to turn the sector around.
With the Bank of Japan's interest rate decision coming up on October 30th, two key pieces of economic data are highly important this week: trade and inflation figures.
Japan's exports are expected to rebound and grow by 4.0% compared to a year ago, mainly because shipments of goods like cars and chip-making machinery are returning to normal following the recent 15% tariff deal with the US At the same time, imports are likely to decrease slightly by 0.5%, largely because global commodity prices are lower. Analysts expect exports to continue normalizing in the coming months due to the September trade agreement.
The overall inflation rate is expected to rise to 2.9% for September, with core prices likely remaining above 3.0%. The main reason inflation has slowed down recently is due to temporary factors, specifically government subsidies for energy and social welfare programs.
Tariffs, Tariffs and More Tariffs
Due to the ongoing US government shutdown, there is a serious lack of clear information on how the economy is actually performing.
The government's statistical agencies are closed, meaning key reports are delayed, and even when the government reopens, it will take weeks to properly collect and process the missing data.
However, one important piece of information, the September inflation report (CPI) has been confirmed for release. This is not for the Federal Reserve's benefit (even though they need it for their October 29th meeting), but because the number is legally required to calculate the Social Security cost-of-living increase for 2026.
Experts still expect the report to show a small rise in overall prices (0.4% for the month) and a modest increase in core prices (0.3%). Even if tariffs start making inflation more obvious, the Fed's biggest concern right now is the weakening job market, meaning a small rise in inflation will not stop them from making a planned quarter-point interest rate cut later this month.
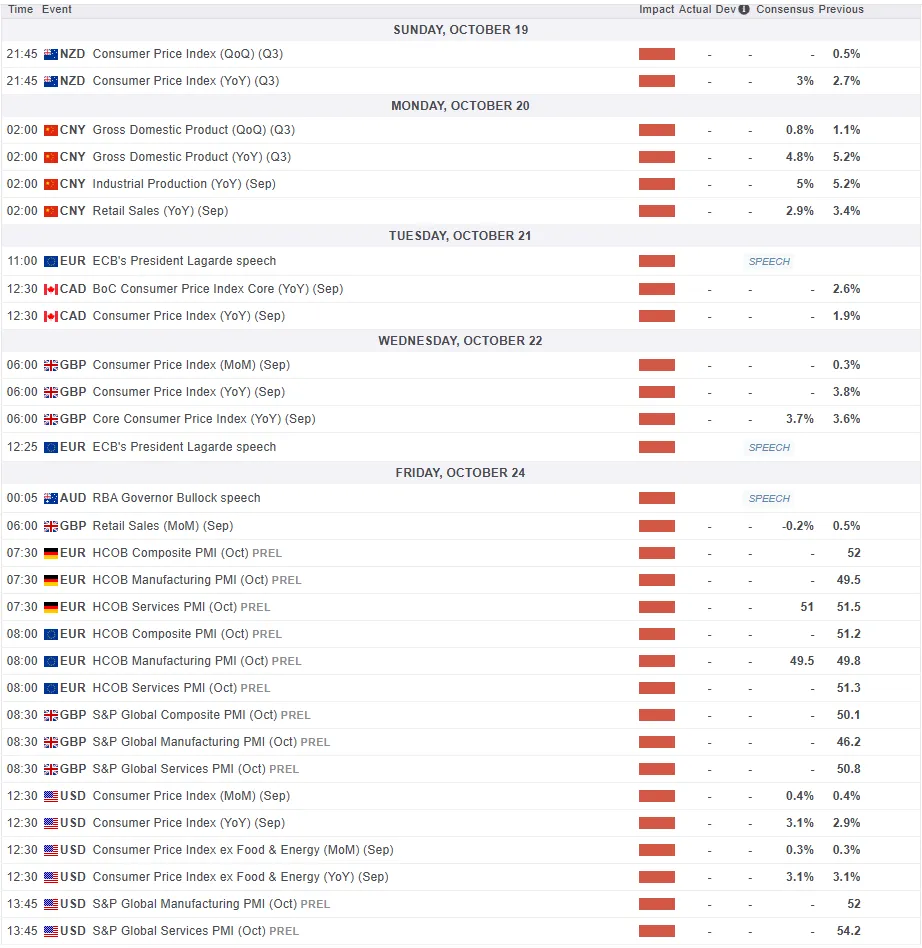
For all market-moving economic releases and events, see the MarketPulse Economic Calendar. (click to enlarge)
Chart of the Week - US Dollar Index
This week's Chart of the week is the US Dollar Index (DXY)
From a technical perspective, the DXY has broken a three-day losing streak finding support at the 100-day MA on Friday.
The daily candle closed as a hammer candle setting up the potential for further upside on Monday.
If this level holds on Monday the DXY could continue its rise in the early part of next week. This will also depend on US-China developments.
CPI data will be due on Friday though and market participants may be slightly hesitant to commit to any major moves ahead of the data release.
This could potentially lead to some choppy price action in the early part of the week, something to consider.
Immediate resistance rests at 99.57 before the psychological 100.00 handle comes into focus.
Looking at support and a break below the 100-day MA could lead to a retest of the 97.70 or 96.90 support levels.
US Dollar Index (DXY) Daily Chart - October 17, 2025
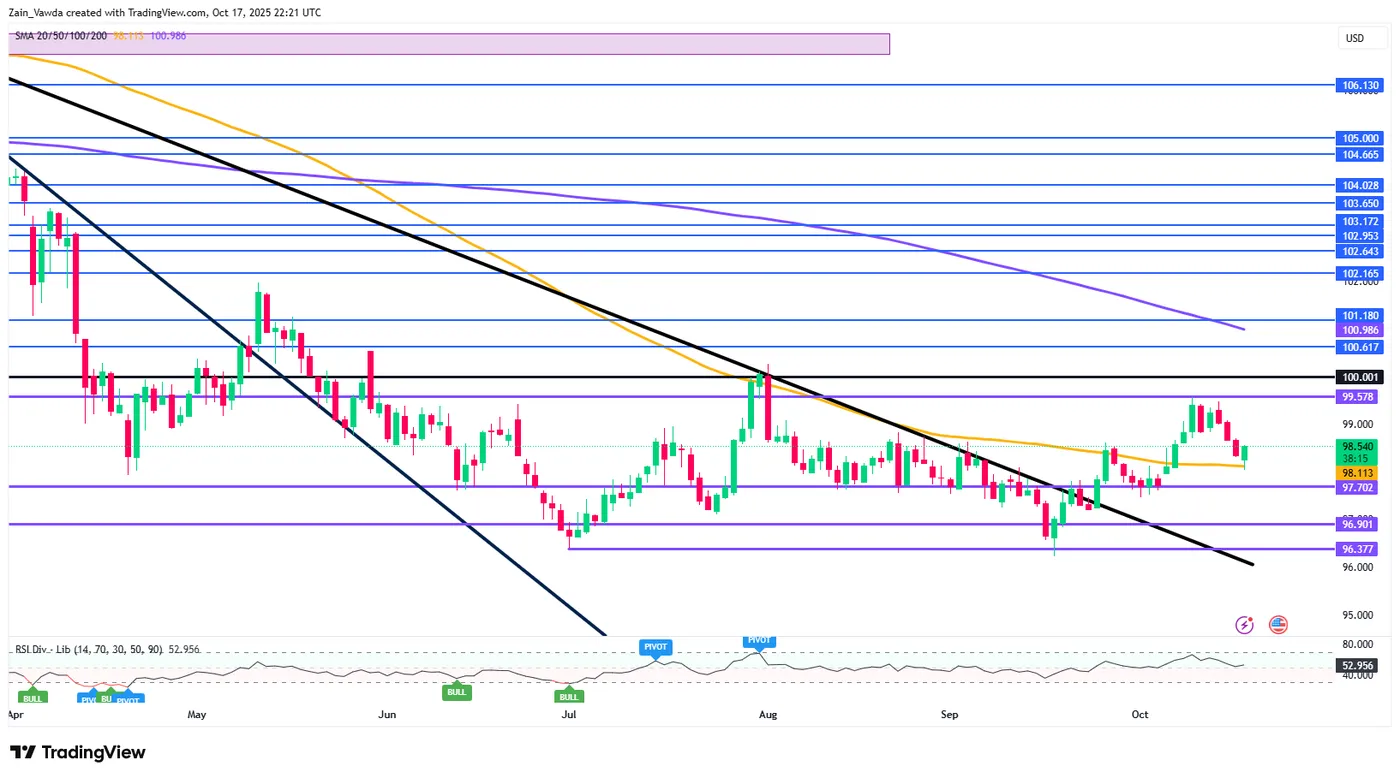
Source:TradingView.Com (click to enlarge)
The Weekly Bottom Line: Reading the Tea Leaves Amidst the Data Fog
Canadian Highlights
- Industries that are highly exposed to the U.S. continue to suffer, with manufacturing and wholesale sales volumes down in August.
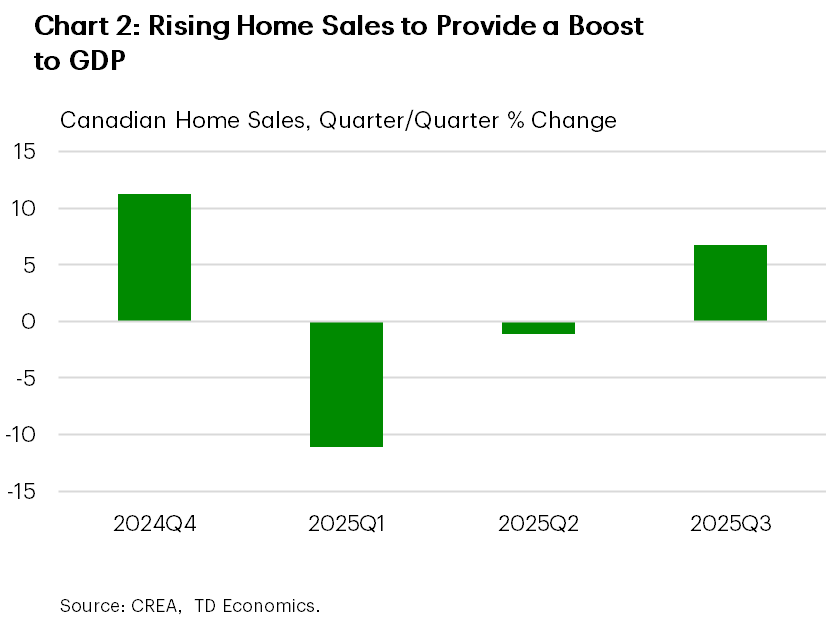
- Housing market developments were mixed in September, with home sales declining but housing starts improving. However, performances for Q3 overall were as expected.
- Next week’s CPI inflation and BoC surveys loom large for the upcoming Bank of Canada interest rate decision.
U.S. Highlights
- Alternative data helped fill the void of official releases due to the ongoing government shutdown. The Cleveland Fed’s Inflation Nowcasting model estimated core inflation remained around 3% (y/y) in September.
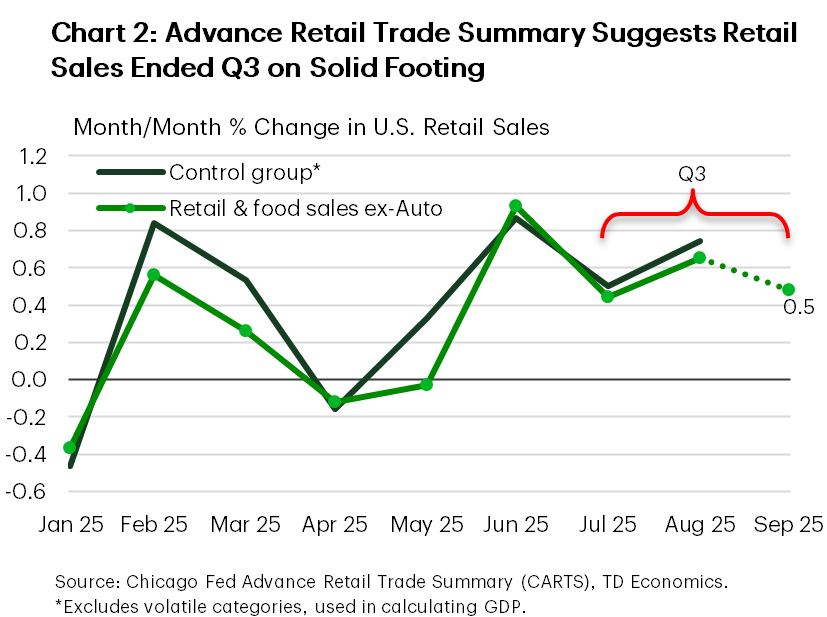
- The Chicago Fed’s Advance Retail Trade Summary indicated retail & food services sales excluding autos were healthy in September.
- Fed Chair Powell signaled that the central bank could soon reach a point where it may stop reducing the size of its balance sheet, also known as quantitative tightening.
Canada – Soft Data, Subdued Economy
If not for equities, one could easily make the case that caution dominated the minds of investors this week. Oil prices continued their slide, with WTI dropping about $2/bbl on concerns of a global supply glut and rising trade tensions between the U.S. and China. This is bad news for Canadian oil exporters, although the upside is that inflation will be pressured lower in October, freeing up Canadians to spend elsewhere. Canadian bond yields were also lower during the week (10-year yield was down about 8 bps as of writing), echoing the trend in their U.S. counterparts and reinforcing the theme of cautiousness. However, stock markets ran somewhat against the grain this week, after a brief trip into the red the week prior. This time, its was mining companies (benefitting from record highs in gold, which itself is a classic sign of cautiousness) that helped the TSX edge higher (as of writing).
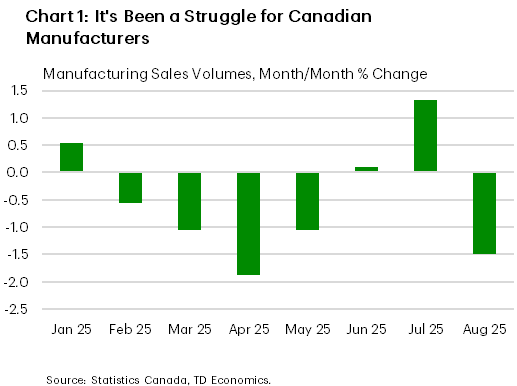
This week offered fresh evidence that industries tied to the U.S. continue to suffer. Canadian manufacturing sales volumes fell 1.5% month-on-month (m/m) in August, erasing gains made the prior two months (Chart 1). Sales were driven lower by tumbling shipments of transportation equipment (cars, aerospace products). Manufacturing was also dealt a fresh blow this week as Stellantis announced that it would be shifting production of the Jeep Compass originally planned for their currently idled plant in Brampton Ontario to the U.S. Meanwhile, wholesalers – also highly exposed to the U.S. market – had a rough August, with wholesale sales volumes down 2.7% m/m.
This week also painted a mixed picture of Canada’s housing markets in September. Home sales declined last month, marking the first drop since April, after the market had bounced back from very early 2025 lows. Housing starts, meanwhile, increased 14% m/m in September after August’s large drop. For the third quarter overall, home sales were up 7% while starts dropped 3%. Both results were generally in line with our latest forecast, where rising sales activity would enable residential investment to make a positive contribution to Q3 GDP growth (Chart 2). However, September’s weak sales performance suggests some softening in momentum heading into Q4. Our current view is for a modest, gradual rise in home sales unfolding through next year, although housing starts are expected to trend lower amid slow population growth.
All in, data this week reinforces that Canada’s economy continues to suffer under the weight of the trade war. It’s not all bad news, as last week’s employment report was solid, but the overall picture is one of an economy that is muddling along at a well-below trend pace. For the Bank of Canada, these data probably didn’t move the dial much in terms of their thinking on rates. But, next week’s BoC Business Outlook Survey and CPI inflation report will be the key final pieces of puzzle before the next interest rate decision on October 29th. The Bank of Canada will be looking for confirmation that the inflation backdrop is benign to support a rate cut, while businesses’ outlook in the face of tariffs will play a key role in their thinking on future demand.
U.S. – Reading the Tea Leaves Amidst the Data Fog
This week’s U.S. economic landscape remained shrouded in fog due to the lack of official data amidst the ongoing government shutdown. If it continues until Monday, it will be the third longest in history. In the official data drought, focus has shifted to alternative indicators, particularly from the Federal Reserve, which is still operating during the shutdown. US-China trade tensions ebbed and flowed, while concerns surrounding regional banks made a comeback, weighing on equity markets. Still, equities managed to eke out some gains, with the S&P 500 up 1% from last Friday’s low. Bond yields declined amid uncertainty and expectations of further monetary easing. Notably, the 10-Year Treasury yield fell below 4% and is now hovering near last year’s level.
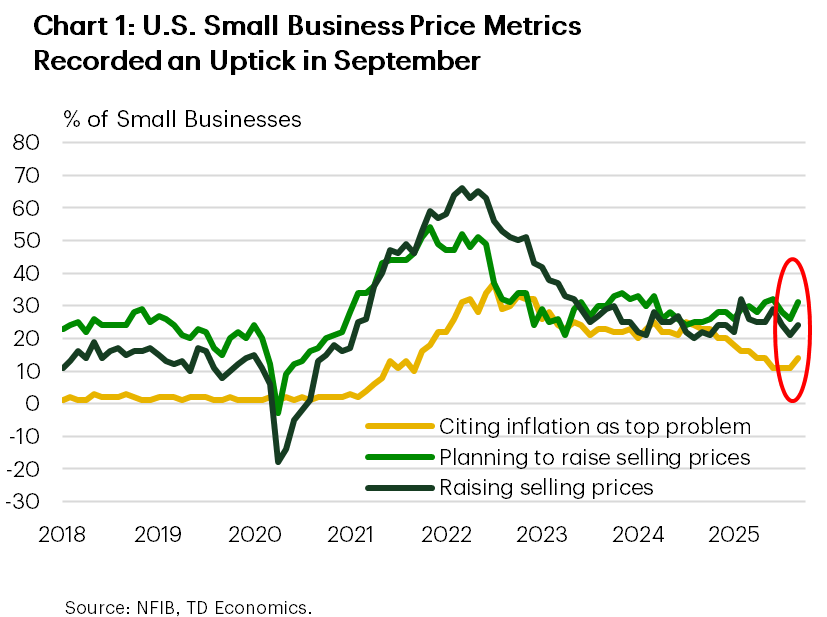
In the absence of the CPI report, alternative inflation indicators are sending conflicting signals. The Cleveland Fed’s Inflation Nowcasting model estimated core inflation at 0.26% month-over-month in September, suggesting year-on-year core inflation remained near 3%. The lack of acceleration would support another Fed rate cut amidst a deteriorating labor market. However, the Fed’s Beige Book reported further price increases, with several districts noting “faster input cost growth due to higher import prices and rising costs for services like insurance, health care, and technology”. The NFIB’s small business survey also showed moderate upticks in its price metrics (Chart 1). The CPI report is set to be released next week, which should help clear some of the fog.
The September retail sales report is also delayed, but the Chicago Fed’s Advance Retail Trade Summary (CARTS), which tracks weekly sales, offers some insight. CARTS indicates that retail & food services sales excluding autos rose by 0.5% in September, suggesting a solid finish to the third quarter (Chart 2). However, given ongoing uncertainty and other consumer challenges, momentum is expected to ease in the fourth quarter. The Beige Book echoed this, noting that overall consumer spending, especially on retail goods, trended down in recent weeks, with auto sales being the main exception.
On the employment front, the Beige Book described labor demand as “subdued” and employment levels as “largely unchanged”. More employers reported lowering headcount through layoffs and attrition, citing weak demand, high uncertainty, and, in some cases, increased investment in AI. Layoffs were mentioned 14 times, up from 6 previously. NFIB employment metrics also pointed to a weak hiring trend among small businesses in September.
Fed Chair Powell reiterated recent messaging and placed more emphasis on labor market risks in a speech this week, supporting additional easing. Powell also signaled the central bank could soon stop reducing the size of its balance sheet. While he provided no set timeline for the end of quantitative tightening (QT), he stated “we may approach that point in the coming months,” noting early signs that liquidity conditions are gradually tightening.
Reading the tea leaves, labor market risks remain the key focus. As such, the Fed is likely to deliver another rate cut at the end of this month. The signal that QT may soon end further reinforces the Fed’s dovish stance.
Weekly Economic & Financial Commentary: Tensions Rising in U.S.-China Trade Relations
Summary
United States: Put on Pause
- As the federal government shutdown approaches its third full week, no end appears to be in sight. While the economic and financial market impact of the shutdown has been muted so far, it is not costless, and there is not much precedent for such a full shutdown lasting longer than a few weeks.
- Next week: Existing Home Sales (Thu.), CPI (Fri.)
International: Soft Signals in a Shifting Landscape
- In a relatively light week for international economic data, UK monthly GDP grew modestly, but last month’s figure was revised into contraction, offsetting recent gains. Wage and labor market data painted a mixed picture of the British economy. Australia’s employment report disappointed, while inflation in India fell below the central bank’s target.
- Next week: China GDP (Mon.), Canada CPI (Tue.), Eurozone PMIs (Fri.)
Topic of the Week: Tensions Rising in U.S.-China Trade Relations
- We unpack the rising tensions brewing in the U.S.-China trade spat this week following export curbs out of China on rare earth minerals and magnets and the U.S. threatening an additional 100% tariff on imports from the country. The 90-day pause on higher reciprocal rates also ends mid-November, though Trump has said these high rates are unsustainable and a fair deal must be met.