Sample Category Title
NZ CPI jumps to 3% in Q3, hits top of RBNZ target band
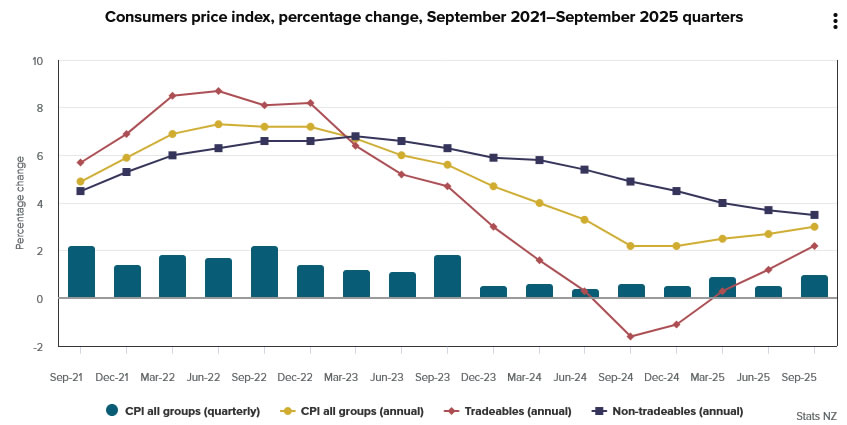
New Zealand’s inflation pulse picked up in the Q3, highlighting lingering price pressures that could restrain the RBNZ from cutting rates too aggressively. Headline CPI rose 1.0% qoq, above forecasts of 0.8% and sharply higher than 0.5% pace in Q2. On an annual basis, inflation climbed from 2.7% yoy to 3.0% yoy, matching expectations but reaching the top of the central bank’s target band and its highest level since mid-2024.
Much of the rebound came from tradeable prices, which rose 2.2% yoy versus 1.2% previously, suggesting imported cost pressures are resurfacing. By contrast, non-tradeable inflation eased slightly from 3.7% yoy to 3.5%, hinting at some moderation in domestic demand.
Even so, the composition of inflation is concerning: housing and utilities accounted for nearly one-third of the total rise in the annual CPI. Electricity prices jumped 11.3%, rents increased 2.6%, and local authority rates surged 8.8%.
With these three categories making up just 17% of the CPI basket, the data underline how sticky living costs have become. For the RBNZ, which only recently delivered an outsized 50bps rate cut to counter slowing growth, this renewed inflation uptick narrows its policy flexibility.
Global Markets Stabilize as U.S.–China Trade Tensions Ease and Gold Reaches Record Highs
After last Friday’s sharp sell-off sparked by renewed U.S.–China trade war fears, markets steadied this week as U.S. equities rebounded. President Trump helped calm investors by emphasizing that he wants to avoid further escalation with China. The reassurance supported a recovery in risk sentiment after the previous week’s turmoil.
In Japan, the USD/JPY and Nikkei 225 both fell as political uncertainty increased. Doubts grew over Sanae Takaichi’s chances of becoming prime minister after the LDP’s coalition partner Komeito withdrew its support, forcing the ruling party to seek a new alliance. The resulting political instability weighed on Japanese assets and strengthened caution among investors.
Gold continued its upward surge on safe-haven demand amid ongoing U.S. uncertainty, while concerns about the U.K. economy deepened after unemployment figures came in worse than expected and reports surfaced that the government may raise taxes. Meanwhile, Federal Reserve Chair Jerome Powell signaled that the central bank remains on track to cut short-term interest rates again later this year, reinforcing expectations of a more accommodative policy stance.
Markets This Week
U.S. Stocks
The Dow spent the week recovering earlier losses, avoiding the market correction that some analysts had predicted the previous week. Strong corporate earnings continue to support sentiment, and further positive results from major U.S. firms this week could help the recovery extend. However, with the 10-day moving average now pointing slightly lower and few key economic releases on the calendar, range trading appears to be the most practical approach in the short term. Resistance is now at 46,500, 47,000, and 48,000, with support at 45,500, 45,000, 44,000, and 43,000.
Japanese Stocks
The Nikkei 225 began the week sharply lower amid renewed concerns over U.S.–China trade tensions and doubts about Sanae Takaichi’s ability to form a government. However, the index gradually recovered as her negotiations with potential coalition partners progressed, restoring investor confidence. This week, the market is likely to continue moving higher and test historic highs, supported by optimism that a Takaichi-led government could mean fewer interest rate hikes ahead. Resistance is at 49,000円 and 50,000円, while support is at 47,000円, 46,000円, and 45,000円.
USD/JPY
The USD/JPY fell for most of the week as the strong rally that followed Sanae Takaichi’s election to lead the LDP faded. However, the pair recovered on Friday after finding solid support near 150. With the 10-day moving average still trending upward, further buying is expected this week as long as the market holds above the 150 support level. Resistance is at 152, 153, and 153.30, while support is at 150, 149, and 148.
Gold
Gold continued to benefit from global uncertainty and steady central bank buying as investors sought to diversify risk and add safe-haven exposure. With prices at record highs, the rally has surprised many analysts, and the upper Bollinger Band now represents the only meaningful resistance. While a profit-taking sell-off is inevitable at some stage, the uptrend is likely to remain intact as long as the market holds above the 10-day moving average. Resistance is now at $4,300, $4,400, and $4,500, while support stands at $4,200, $4,100, and $4,000.
Crude Oil
WTI crude remained under pressure last week as persistent fears of oversupply continued to drive speculative selling. Growing concerns about a potential slowdown in the U.S. economy further weighed on sentiment. Continued weakness appears likely, with the market targeting a break below the $60 level. Traders should look to sell into strength near the downward-sloping 10-day moving average. Resistance is now at $65, $66.50, $70, and $75, with support at $60 and $55.
Bitcoin
Bitcoin’s liquidation continued aggressively last week after hitting record highs earlier this month. The renewed trade tensions between the U.S. and China triggered the initial wave of selling, and the resulting downward momentum has fueled further declines. The market now looks firmly bearish, targeting a test — and potential break — below key support at $100,000. Selling remains the preferred strategy as long as prices stay below the $110,000 resistance level. Resistance is at $110,000, $120,000, and $125,000, while support stands at $100,000, $95,000, and $90,000.
This Week’s Focus
- Monday: China GDP, U.S. Business Inventories and Industrial Production
- Tuesday: E.U. ECB President Lagarde Speaks
- Wednesday: Japan Trade Balance, U.K. CPI
- Thursday: U.S. Initial Jobless Claims and Existing Home Sales
- Friday: Japan National CPI and au Jibun Bank Services PMI, U.K. Retail Sales, E.U. HCOB Eurozone Manufacturing, U.K. S&P Global Composite PMI, U.S. Core CPI, S&P Global Manufacturing PMI, Michigan Consumer Sentiment and New Home Sales
With a relatively light schedule of economic releases, this week’s focus will shift to U.S. and Japanese politics to see whether markets can resume the recent equity uptrend and if gold can extend its rally. Bitcoin, which has fallen close to key support around $100,000, will also be watched closely for signs of further selling. While few major data points are due, sentiment could still be influenced by political developments and expectations for the Federal Reserve’s next policy move.
NZ Consumers Price Index, September Quarter 2025 – Hard on the Outside, But a Soft Centre
Consumer prices rose 1.0% in the September quarter. That saw annual inflation rising to 3.0%, from 2.7% in the year to June. The result was in line with our forecast and close to the RBNZ’s forecast.
Consumers Price Index, September quarter 2025 – key stats
Headline inflation
- Quarterly change: +1.0% (prev: +0.5%)
- Westpac forecast: +1.0%, RBNZ (Aug MPS): +0.9%
- Market median: +0.9%, range +0.8% to. +1.1%
- Annual change: +3.0% (prev: +2.7%)
- Westpac forecast: +3.0%, RBNZ (Aug MPS): +3.0%, Market: +3.0%
Non-tradables
- Quarterly change: +1.1% (prev: +0.7%)
- Westpac forecast: +1.2%, RBNZ (Aug MPS): +1.0%
- Annual change: +3.5% (prev: +3.7%)
Tradables
- Quarterly change: +0.8% (prev: +0.3%)
- Westpac forecast: +0.8%, RBNZ (Aug MPS): +0.8%
- Annual change: +2.2% (prev: +1.2%)
Consumer prices rose 1.0% in the September quarter. That saw the annual inflation rate rising to 3.0%, up from 2.7% in the year to June.
The September quarter result was in line with our forecast.
Today’s result was slightly above the RBNZ’s August MPS forecast for a 0.9% rise. However, much of the recent pickup in inflation is likely to be temporary (for instance, the recent rise in food price inflation). Consequently, the result is unlikely to be a major concern for the RBNZ.
What contributed to inflation in the September quarter?
Underpinning September’s rise in consumer prices were large increases in two specific areas:
- Food prices (19% of the CPI) were the largest upside contributors to quarterly inflation, with prices up 1.8% over the quarter. As well as the usual seasonal increase in vegetable prices, recent months have also seen large increases in meat prices.
- The September quarter also saw an 8% increase in local council rates. That’s a bit lower than the past two years, but still a large rise.
On the downside, there was continued softness in the two big housing categories – housing rents and the cost of purchasing a newly built home, which together account for around 20% of the CPI.
- Housing rents were up just 0.3% in the September quarter. In annual terms, rental inflation has slowed to 2.6%, the lowest it’s been since 2019. That comes against a backdrop of low population growth and increases in supply. There’s been particular softness in Wellington.
- The cost of purchasing a newly built home was up 0.1% in the September quarter, and is up just 0.8% over the past year. That’s the smallest annual increase since 2009. This softness reflects the stark downturn in home building over the past year and related softness in existing home prices.
More generally, the September quarter saw muted price rises in a range of discretionary spending areas including clothing and household durables, consistent with the continued softness in retail spending.
Annual and core inflation
Annual inflation rose to 3.0% in the September quarter. That’s up from 2.7% in the year to June and at the top of the RBNZ’s target band.
In terms of the big CPI groups, the domestically oriented non-tradables group rose 1.1% over the quarter. That saw annual non-tradables inflation slowing to 3.5%, down from 3.7% last quarter and the lowest level since 2021.
Non-tradables inflation has been gradually cooling over the past couple of years, reflecting the softness in economic activity, and related muted growth in wages and service sector prices. However, domestic inflation is still lingering above historic averages due to the continued large increases in administered prices, like council rates. Excluding central and local government charges, non-tradables prices rose 2.6% over the past year.
On the imported front, tradables prices rose by 0.8% for the September quarter. That saw annual tradables inflation rising to 2.2%. That’s a stark change from the past year when tradable prices had been flat or falling, with much of that turnaround due to the recent rise in food prices.
Looking ahead, tradables inflation is likely to drop back from its current highs as food price inflation eases. Even so, tradables inflation isn’t likely to be as low as it was in recent years. That’s important as it will limit the downside for overall inflation over 2026.
While increases in the prices of volatile items like food have pushed inflation higher in recent months, the longer-term trend in prices remains contained. That was reflected in the various measures of core inflation, which smooth through the quarter-to-quarter swings in prices and instead track the underlying trend in inflation.
Most measures of core inflation have drifted back towards or inside the RBNZ’s 1% to 3% target band in recent months. However, they are generally flattening off at levels above 2%, rather than at low levels.
In terms of specifics:
- Inflation excluding food, fuel and energy costs eased to 2.5% from 2.7% previously.
- Inflation in the 30% trimmed mean eased to 2.2% from 2.4% previously.
- Weighted median inflation held steady at 2.2%.
Outlook
While overall inflation has picked up, this rise is concentrated in less cyclical areas and much of that rise is likely to be temporary.
We continue to expect that inflation will drop back to levels comfortably inside the RBNZ target band next year.
For the RBNZ, prices in discretionary spending areas or areas that are responsive to interest rates remains low. There was little in today’s release that would prompt them to change their projection for a moderation in inflation over the year ahead.
WTI Crude Oil Wave Analysis
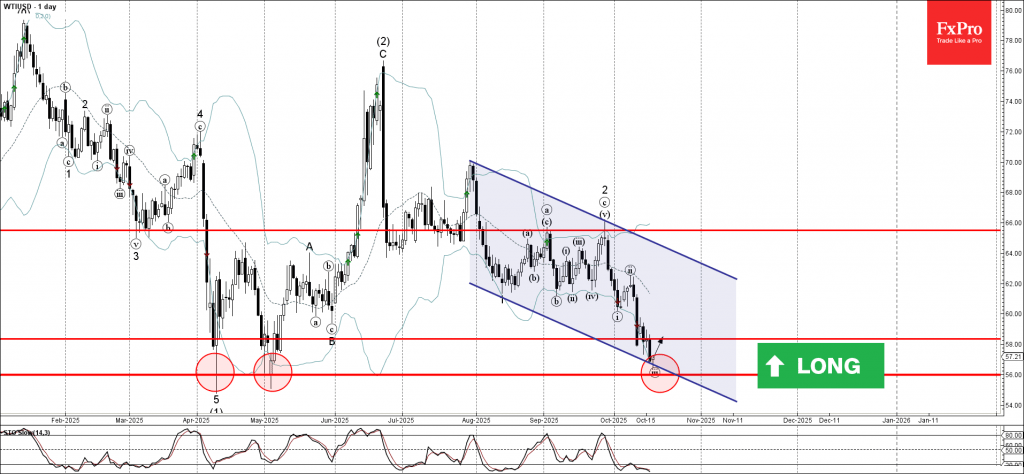
WTI crude oil: ⬆️ Buy
- WTI crude oil reversed from strong support level 56.00
- Likely to rise to resistance level 58.00
WTI crude oil recently reversed from the support area between the strong support level 56.00 (which reversed the price in April and May, as can be seen below) and the lower daily Bollinger Band.
This support area was further strengthened by the support trendline of the daily down channel from August.
Given the strength of the support level 56.00 and the oversold daily Stochastic, WTI crude oil can be expected to rise to the next resistance level 58.00.
Swiss Franc Rally Signals Deepening Market Unease
Global markets ended the week with an uneasy calm, masking what appears to be growing stress beneath the surface. Wall Street showed resilience — the major indexes finished higher after mid-week volatility sparked by renewed concerns over regional bank stability. Yet in Europe, sentiment was more fragile, as bank-led declines weighed on both the FTSE 100 and DAX, revealing how quickly confidence can fray.
The contrast highlights a fragile equilibrium between calmness and fear. Investors were torn between the optimism on Fed easing and mounting macro risks — from U.S.–China trade frictions and the prolonged government shutdown to signs of creeping credit stress at smaller U.S. lenders. The fact that Gold pushed to fresh record highs and Swiss Franc surged to the top of the performance board speaks volumes about the underlying bid for safety. Meanwhile, the sharp fall in U.S. 10-year yields through the 4% mark reinforced the notion that capital is seeking shelter rather than return.
Overall, the global setup looks increasingly fragile. While the surface tone remains calm, the cross-currents beneath — spanning banks, trade, and policy uncertainty — suggest that volatility could intensify with little warning.
Regional Bank Troubles Rekindle Credit Market Anxiety
Concerns over U.S. regional banks erupted again last week, unnerving markets already on edge from trade tensions and fiscal paralysis in Washington. The spark came from reports that Zions Bancorporation and Western Alliance had disclosed a series of bad loans and potential fraud-related losses, reigniting long-dormant fears about the quality of regional lenders’ balance sheets. The headlines quickly triggered a sector-wide selloff, spreading unease far beyond the institutions directly involved.
The scale of the reaction underscored just how fragile market confidence has become. The shadow of the 2023 mini banking crisis still looms large — the sudden collapse of Silicon Valley Bank and its peers remains a reference point whenever credit stress reappears. The psychological scars have yet to heal.
Adding to the nervousness is a growing perception that credit standards may have loosened too much during the last phase of the U.S. rate cycle. With the Fed now easing policy and funding costs declining, some investors worry that banks could again be tempted to stretch risk tolerance in commercial and real-estate lending. Any new evidence of weakness could easily reignite fears of a wider solvency problem.
For now, the problems appear localized. Still, markets are clearly pricing in the possibility that hidden losses on loan books. The very fact that relatively small lenders can shake the entire financial complex reflects a deeper unease about transparency and trust.
The episode also reinforces why safe-haven demand surged across assets. Gold’s record-breaking rally above 4300, the Franc’s powerful appreciation, and a sharp drop in U.S. 10-year yields all signal that investors are quietly shifting toward capital preservation.
DOW Holds Ground, But Momentum Clearly Fading
DOW managed to hold its ground through another volatile week, displaying resilience that contrasts with the unease seen elsewhere in global markets. Buyers repeatedly stepped in near 55 D EMA (now at 45,591.87), preventing deeper losses and maintaining a choppy sideways pattern. Yet, despite this apparent stability, the index is showing clear signs of fatigue after its record-setting.
Technically, loss of momentum is unmistakable with bearish divergence in D MACD. Additionally, DOW’s inability to make a clean break through 61.8% projection of 28,660.94 to 45,073.63 from 36,611.87 at 46,753.38 suggests that the rally may be reaching exhaustion.
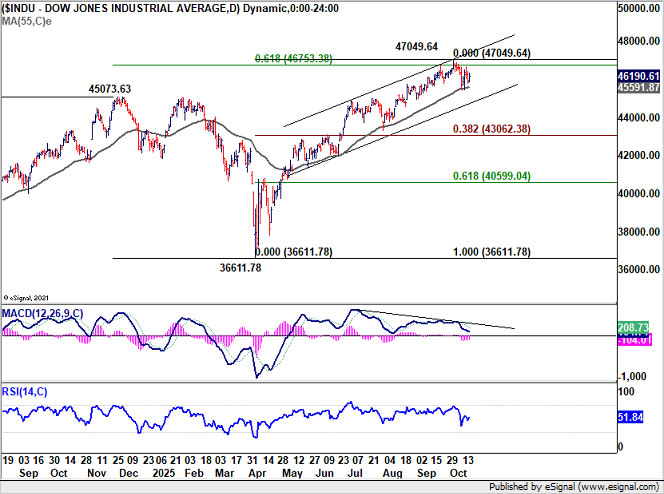
For now, 55 Day EMA is the key short-term pivot. Firm break below this level would confirm rejection from the 46,753.38 projection barrier and shift near-term risk to the downside. That would open the way for deeper correction toward near term rising channel support (near 44,000). Further break of the channel support will pave the way back to 38.2% retracement of 36611.78 to 47049.64 at 43062.38.
Bond Market Sends Warning Signal as 10-Year Yield Breaks 4% Again
U.S. 10-year Treasury yield has breached the 4% psychological level again last week. The recent down trend could partly be attributed to expectations of Fed easing. Yet, the trigger of the current downleg is clearly the worries over regional banking exposures.
Technically, break of 3.992 support confirmed resumption of the decline from 4.629. Next target is 61.8% projection of 4.493 to 3.992 from 4.200 at 3.891.
If the 3.891 floor fails to hold, the next destination would be 3.700, a dual Fibonacci projections zone with 100% projection at 3.699 and 100% projection of 4.809 to 3.886 from 4.629 at 3.705.
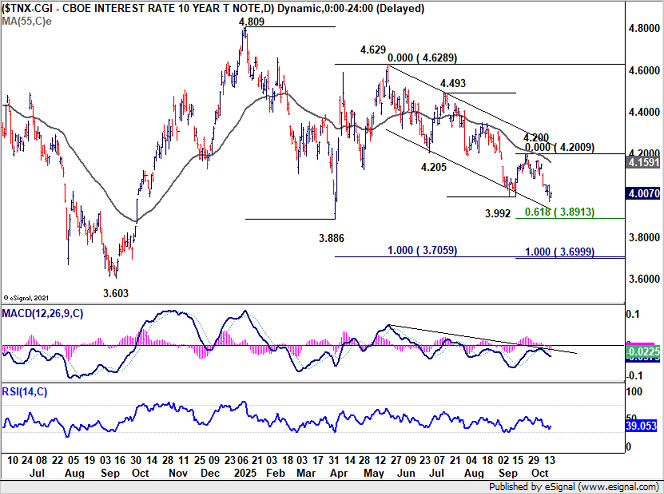
So, if 10-year yield stabilizes above 3.9%, it could mark a temporary reprieve as short-term panic unwinds. However, decisive break below that zone would risk turning this into a broader confidence event, one that could spill over into other assets.
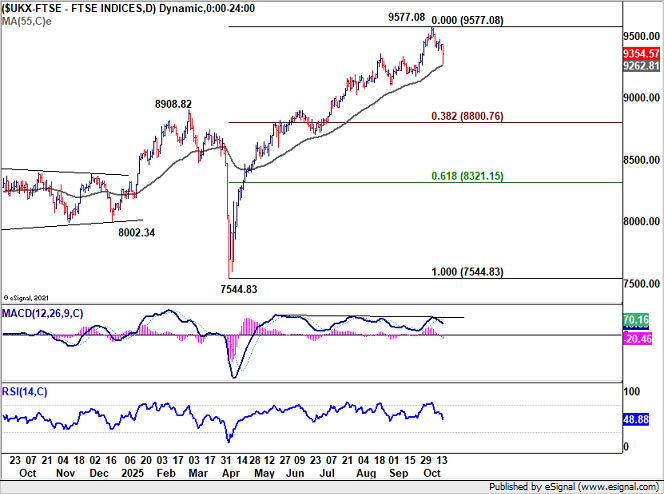
FTSE Suffers Sharp Pullback, DAX Outlook Even Worse
Friday's selloff in FTSE was clearly worse than DOW even though it managed to close paring much of the earlier declines. Near term focus would be on whether 55 D EMA (now at 9262.81) could hold. Sustained break there will argue that fall from 9577.08 is already correcting the whole rise from 7544.83. In this case, deeper decline would be seen towards 38.2% retracement of 7544.83 to 9577.08 at 8800.76.
Strong bounce from current level would keep near term outlook bullish for another rise through 9577.08 high. But considering mild bearish divergence condition in D MACD, upside potential could be relatively limited in this case.
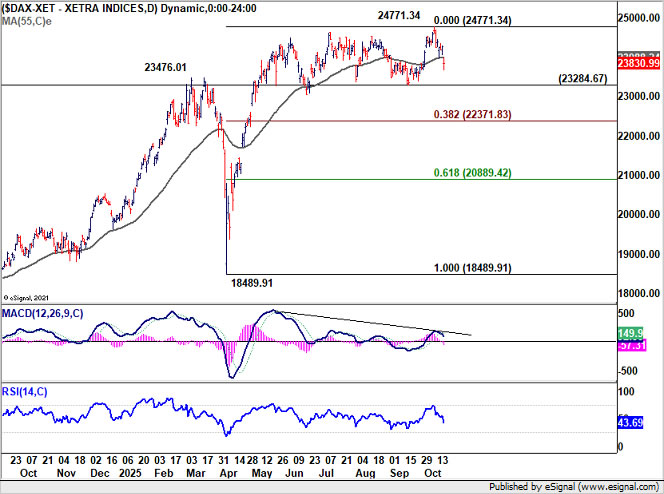
German DAX has come under even heavier pressure than its UK counterpart. Clear bearish divergence condition in D MACD and the close below 55 D EMA (now at 23988.24), suggests that decline is probably imminent.
Fall from 24771.34 might be correcting the whole rise from 18489.91. Firm break of 23284.67 support should confirm this bearish case, and target 38.2% retracement of 18489.91 to 24771.34.
Franc Surges as Safe-Haven Flows Intensify
Swiss Franc has reasserted itself as the market’s preferred refuge, surging across the board as investors rushed into safety . The move was most pronounced in European crosses, where technical breaks confirmed that the Franc’s strength is far from over.
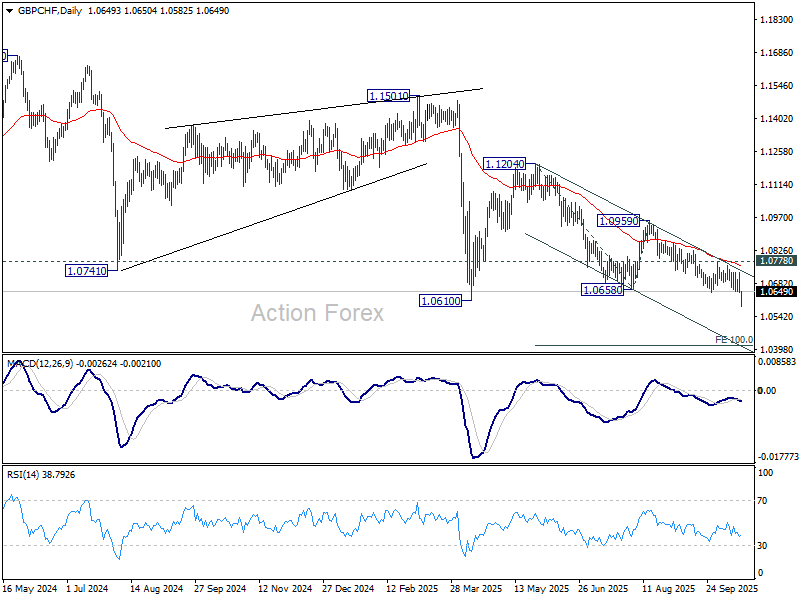
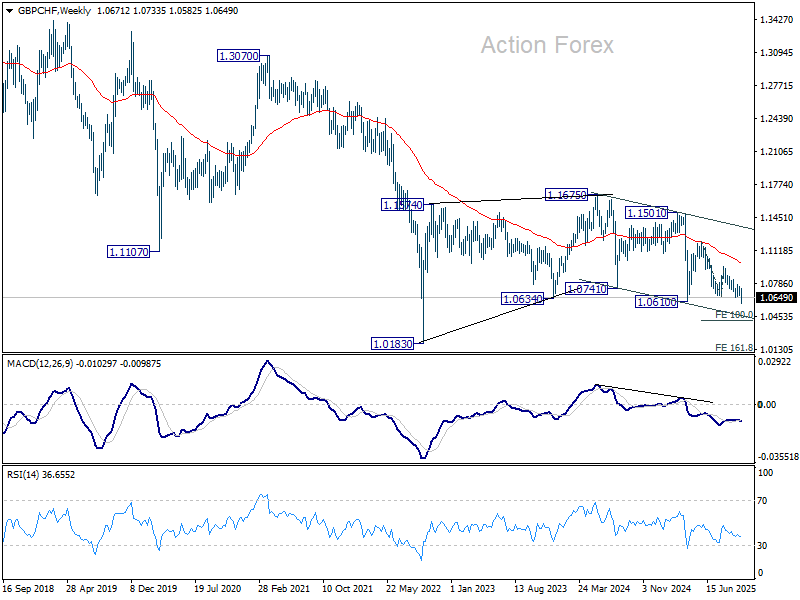
In GBP/CHF, the collapse through 1.0610/58 cemented the cross's bearish structure, confirming resumption of the downtrend from 1.1675. As long as 1.0778 resistance caps recovery attempts, outlook remains firmly bearish. Next target is 100% projection of 1.1204 to 1.0658 from 1.0959 at 1.0413. Break beneath that could accelerate losses toward 1.0183, a level last seen during the 2022 risk-off wave.
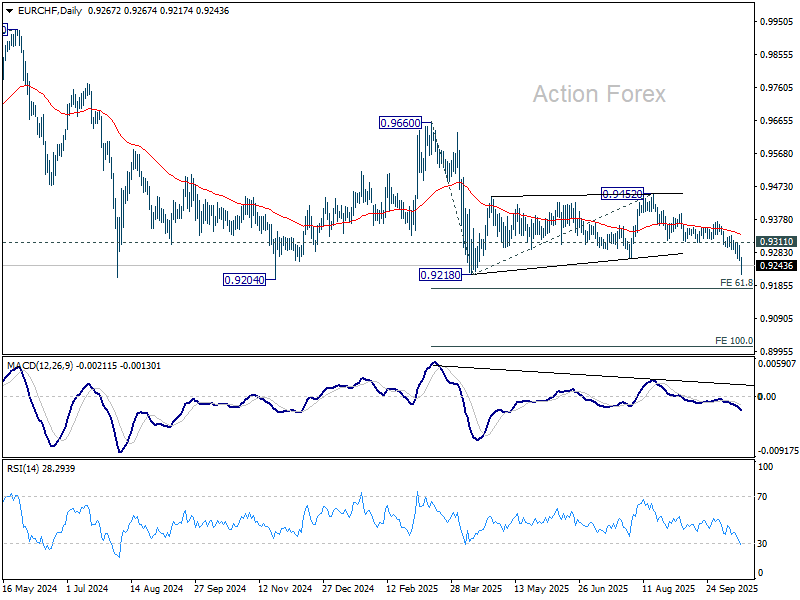
EUR/CHF is still holding above 0.9204 low, but the late selloff still suggests that larger down trend is resuming. Further decline is expected as long as 0.9311 support turned resistance holds, even in case of recovery. Next target is 61.8% projection of 0.9660 to 0.9218 from 0.9452 at 0.9179. Firm break there will target 100% projection at 0.9010.
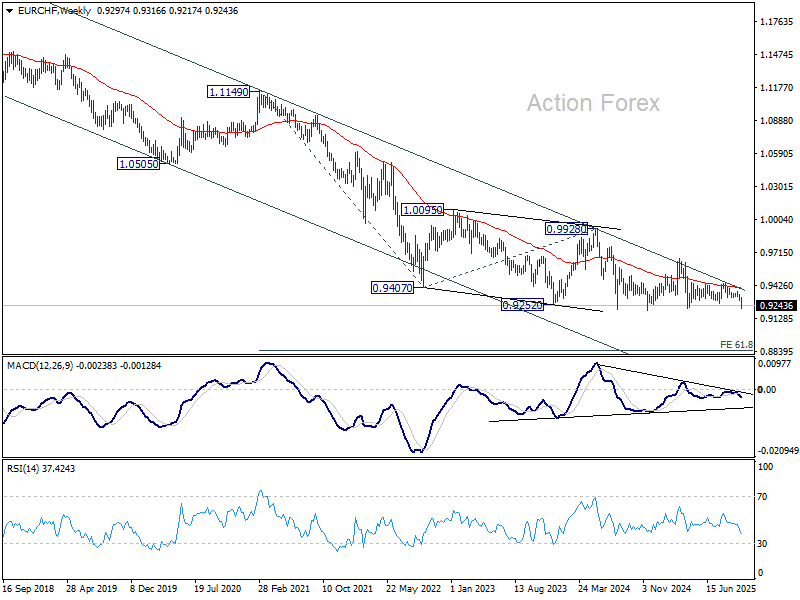
The depth and speech of the decline in GBP/CHF and EUR/CHF could depend on how FTSE and DAX flare next.
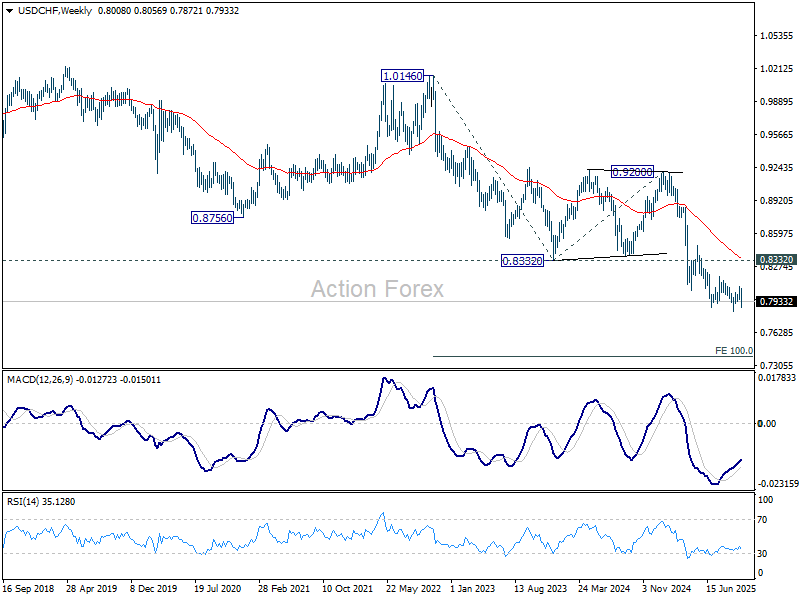
For USD/CHF, the near term picture is less clear. Rebound from 0.7828 has completed well ahead of 0.8170 resistance, and that keeps overall outlook bearish. However, the corrective pattern from 0.7828 could still extend with another rising leg.

Whether USD/CHF is ready to break through 0.7828 might hinge on the next move in US 10-year yield, if it could quickly stabilize back above 4.000 mark, or dive through 3.9000 towards 3.7000. But in either case, USD/CHF should target 100% projection of 1.0146 (2022 high) to 0.8332 from 0.9200 at 0.7382 in the medium term. It's just a matter of time.
Dollar Index: Another bounce still possible as correction extends
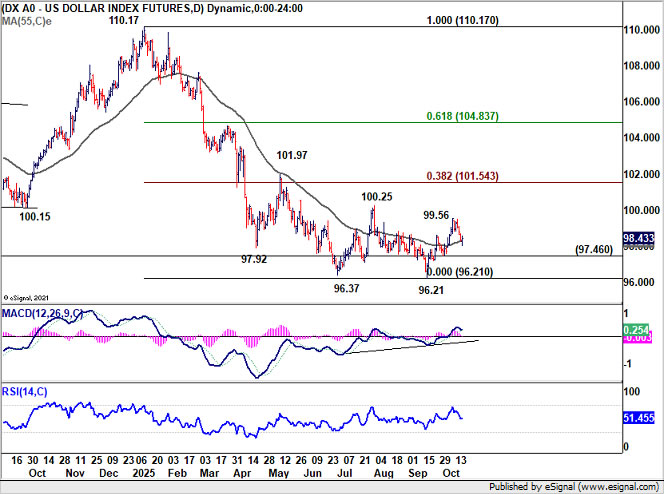
As for Dollar Index, rebound from 96.21 has clearly lost momentum after hitting 99.56. still, with 97.46 support intact, further rise will remain in favor. Break of 99.56 will target 100.25 and possibly above.
However, such rebound is tentatively seen as a corrective move only. Hence, strong resistance is expected from 38.2% retracement of 110.17 to 96.21 at 101.54 to limit upside.
Meanwhile, firm break of 97.46 support will argue that the rebound has completed and bring retest of 96.21 low.
AUD/USD Weekly Report
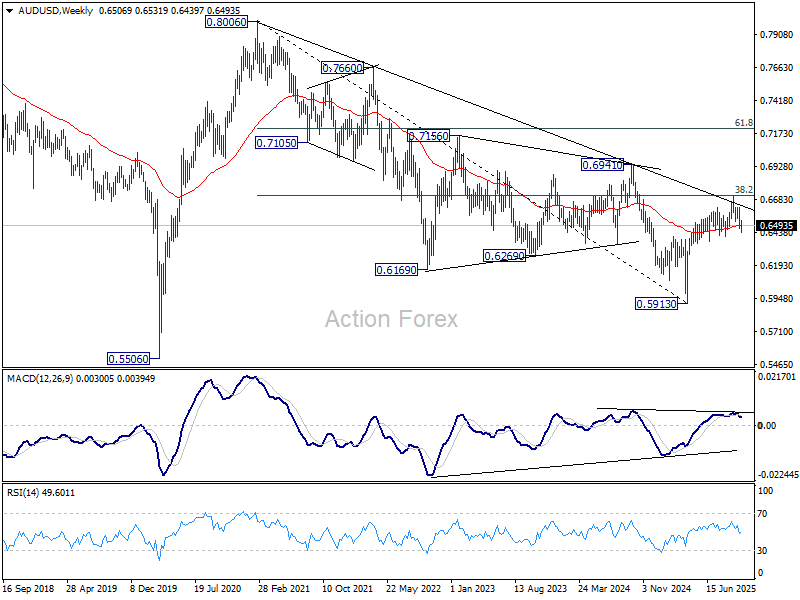
AUD/USD's fall from 0.6706 extended lower to 0.6439 last week but turned sideway. Initial bias stays neutral this week first. Further decline is in favor as long as 55 D EMA (now at 0.6545) holds. Below 0.6439 will target 0.6413 cluster support (38.2% retracement of 0.5913 to 0.6706 at 0.6403. Decisive break there will indicate bearish reversal after rejection by 0.6713 fibonacci level. Nevertheless, sustained trading above 55 D EMA will keep the rise from 0.5913 intact, and bring retest of 0.6706 high.
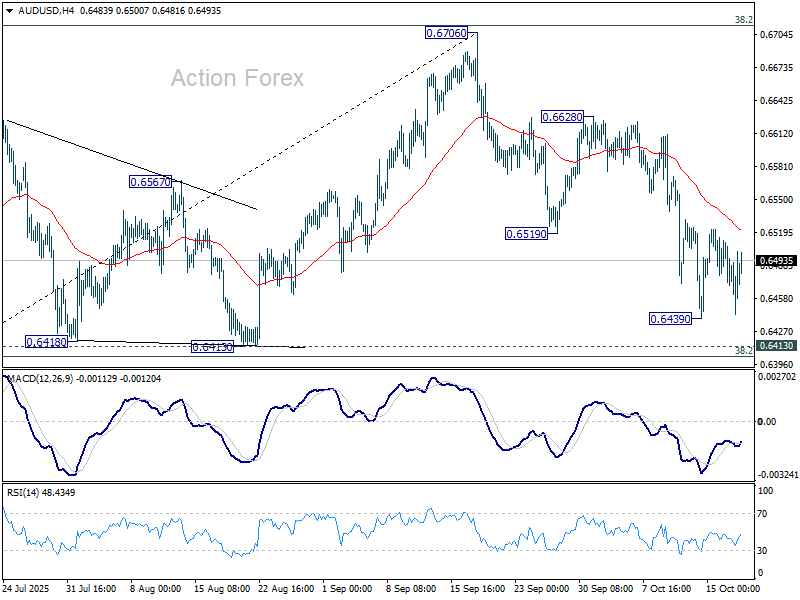
In the bigger picture, there is no clear sign that down trend from 0.8006 (2021 high) has completed. Rebound from 0.5913 is seen as a corrective move. Outlook will remain bearish as long as 38.2% retracement of 0.8006 to 0.5913 at 0.6713 holds. Nevertheless, considering bullish convergence condition in W MACD, sustained break of 0.6713 will be a strong sign of bullish trend reversal, and pave the way to 0.6941 structural resistance for confirmation.
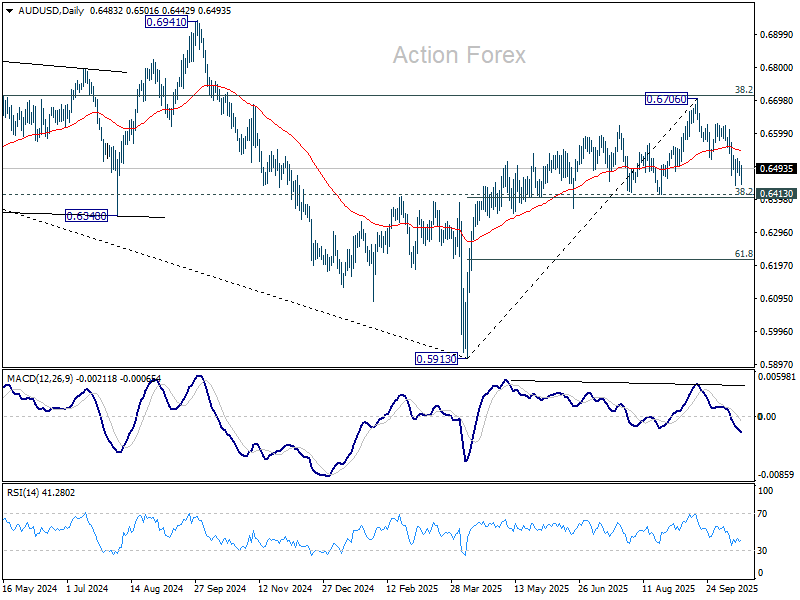
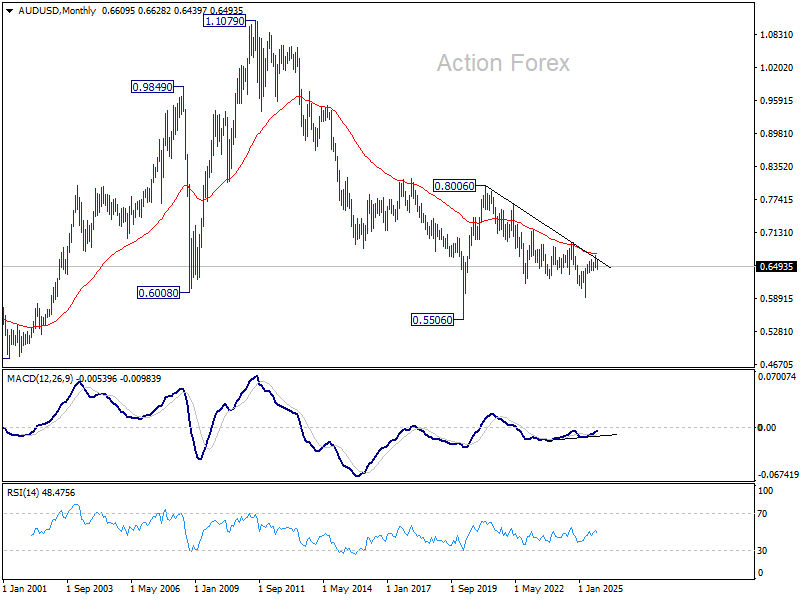
In the long term picture, fall from 0.8006 is seen as the second leg of the corrective pattern from 0.5506 long term bottom (2020 low). Hence, in case of deeper decline, strong support should emerge above 0.5506 to contain downside to bring reversal. On the upside, firm break of 0.6941 will argue that the third leg has already started back to 0.8006.
EUR/USD Weekly Outlook
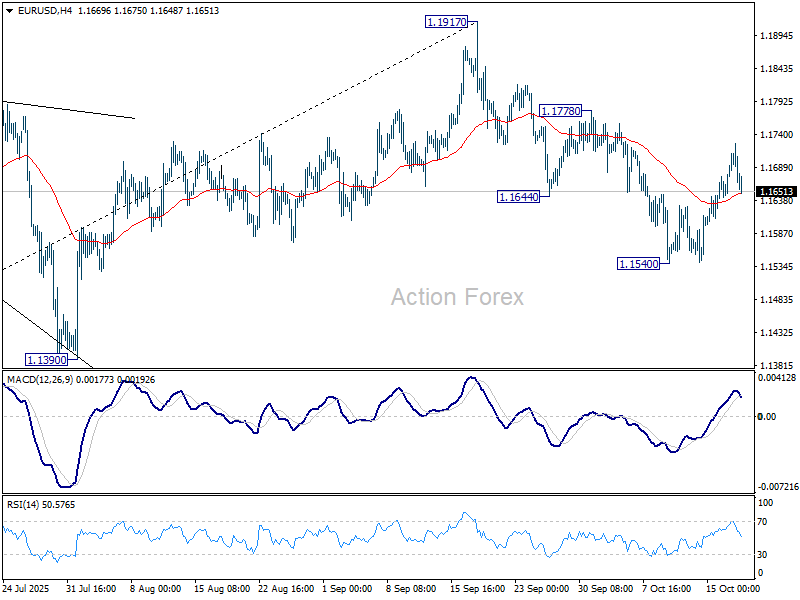
EUR/USD's rebound from 1.1540 extended higher last week but upside is capped well below 1.1778 resistance. Initial bias remains neutral this week and further fall is expected. Break of 1.1540 will resume the decline from 1.1917 and target 1.1390 support, or even further to 38.2% retracement of 1.0176 to 1.1917 at 1.1252. On the upside, through, break of 1.1778 will target a retest on 1.1917 high instead.
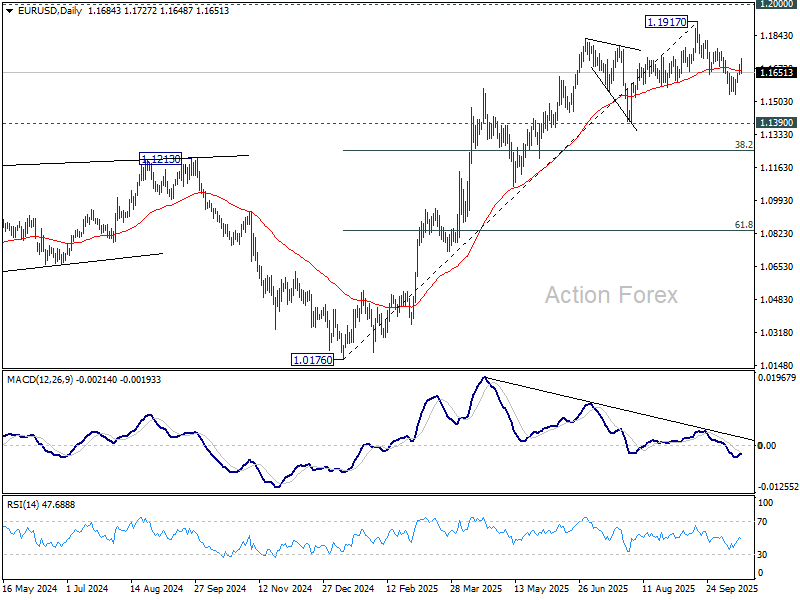
In the bigger picture, considering bearish divergence condition in D MACD, a medium term top is likely in place at 1.1917, just ahead of 1.2 key psychological level. As long as 55 W EMA (now at 1.1276) holds, the up trend from 0.9534 (2022 low) is still expected to continue. Decisive break of 1.2000 will carry larger bullish implications. However, sustained trading below 55 W EMA will argue that rise from 0.9534 has completed as a three wave corrective bounce, and keep outlook bearish.
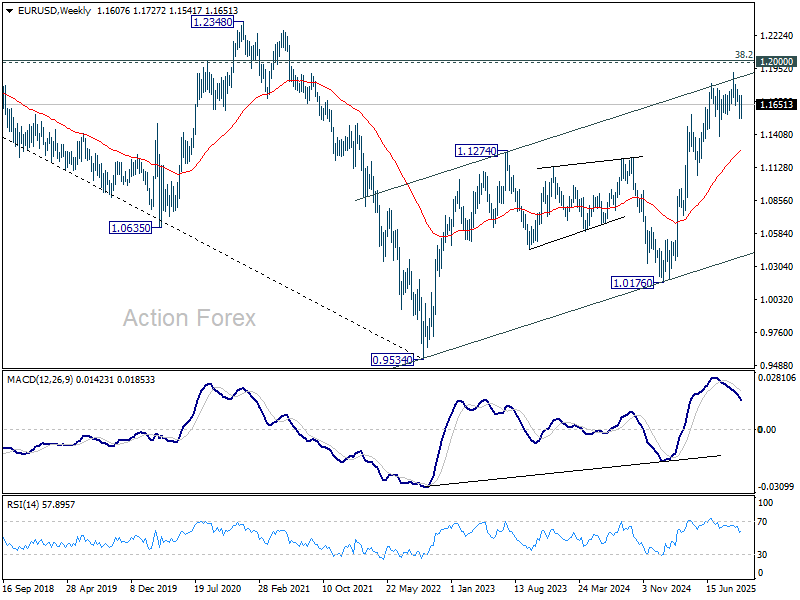
In the long term picture, 38.2% retracement of 1.6039 to 0.9534 at 1.2019, which is close to 1.2000 psychological level is the key for the outlook. Rejection by this level will keep the multi decade down trend from 1.6039 (2008 high) intact, and keep outlook neutral at best. However, decisive break of 1.2000/19, will suggest long term bullish trend reversal, and target 61.8% retracement at 1.3554.
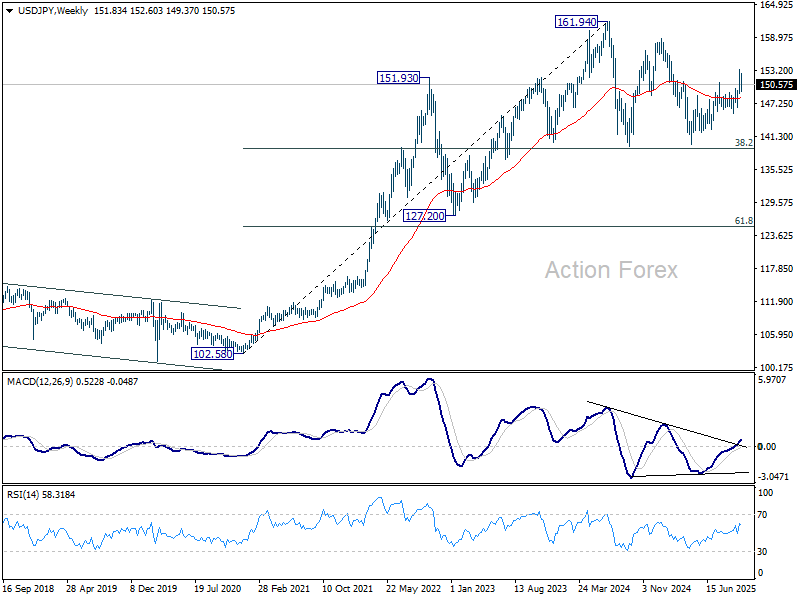
USD/JPY Weekly Outlook
USD/JPY's extended pullback last weeks indicates short term topping at 153.26. Initial bias remains mildly on the downside for 55 D EMA (now at 148.64). Firm break there will target 145.47 support. On the upside, above 151.38 minor resistance will bring stronger rebound back to retest 153.26.
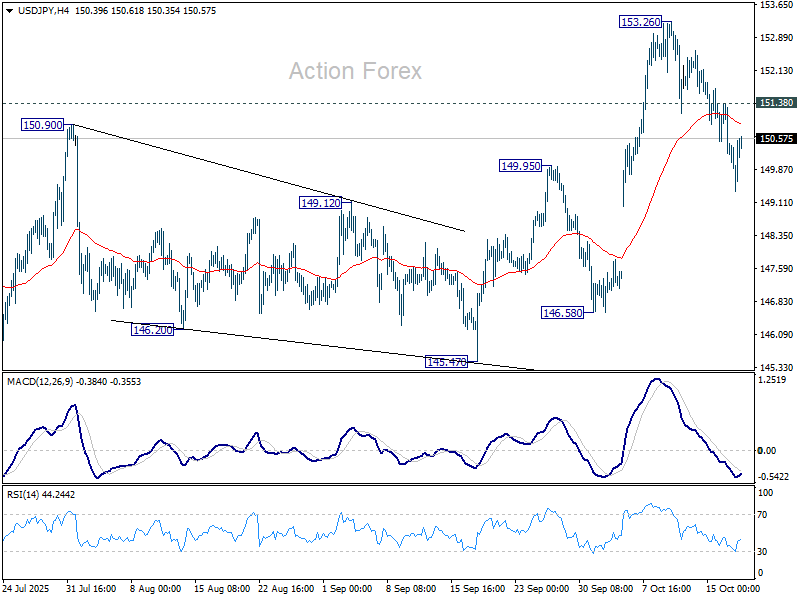
In the bigger picture, current development suggests that corrective pattern from 161.94 (2024 high) has completed with three waves at 139.87. Larger up trend from 102.58 (2021 low) could be ready to resume through 161.94 high. On the downside, break of 145.47 support will dampen this bullish view and extend the corrective pattern with another falling leg.
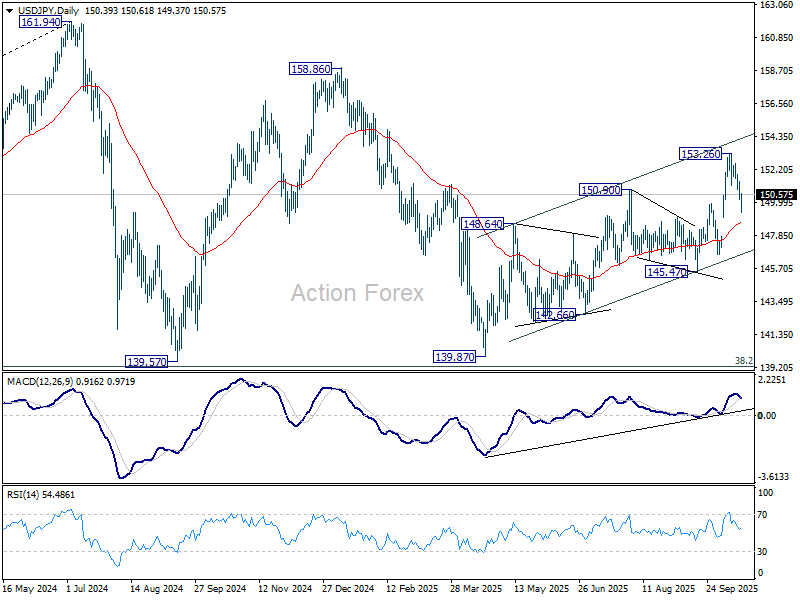
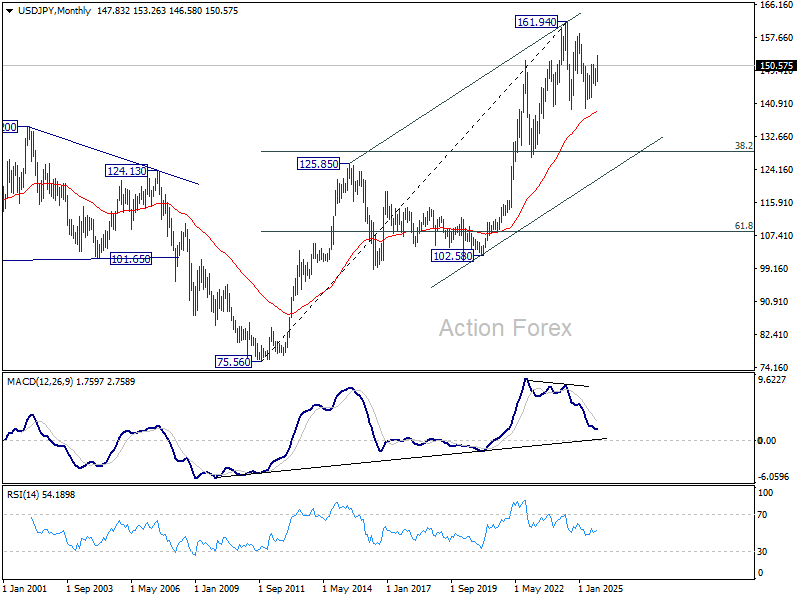
In the long term picture, there is no sign that up trend from 75.56 (2011 low) has completed. But then, firm break of 161.94 is needed to confirm resumption. Otherwise, more medium term range trading could still be seen.
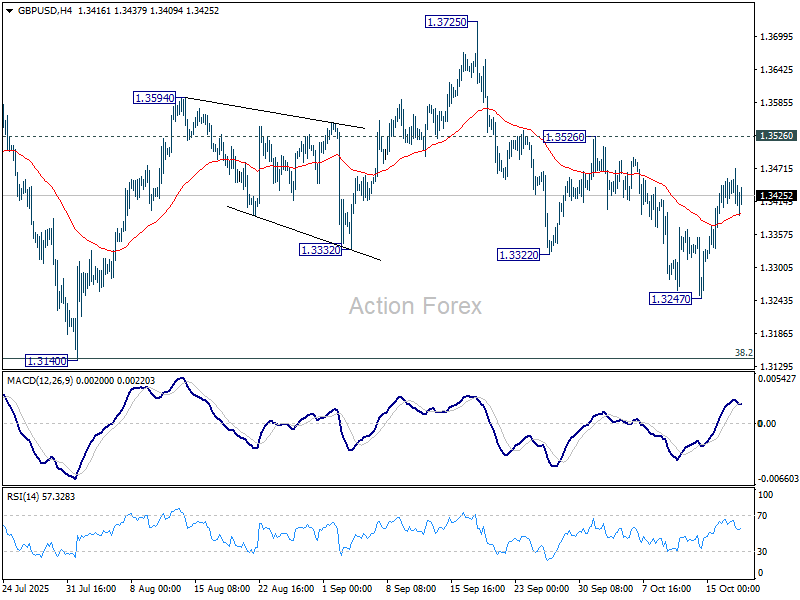
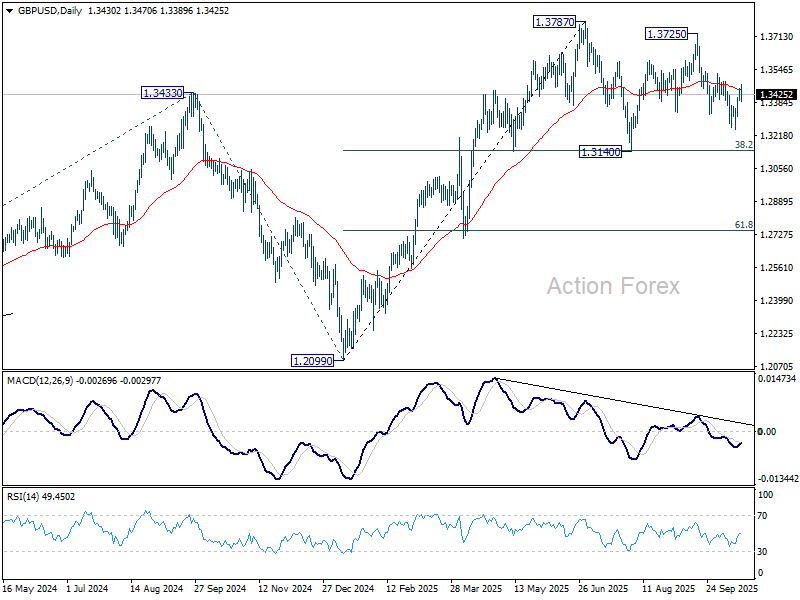
GBP/USD Weekly Outlook
GBP/USD rebounded after edging lower to 1.3247 last week. But upside is limited well below 1.3526 resistance so far. Initial bias remains neutral this week first. On the downside, break of 1.3247 will target 1.3140 cluster (38.2% retracement of 1.2099 to 1.3787 at 1.3142). Strong support is expected there to contain downside to complete the corrective pattern from 1.3787. On the upside, break of 1.3526 will target 1.3725/87 resistance zone.
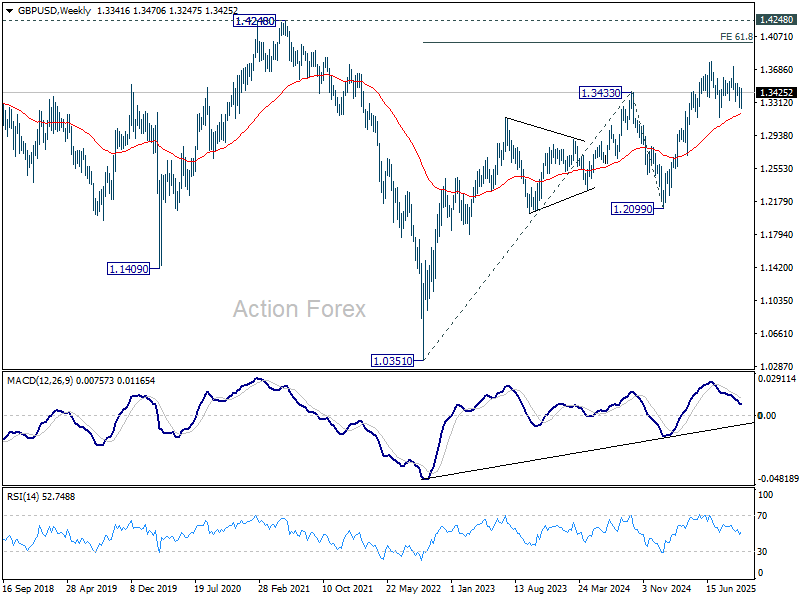
In the bigger picture, rise from 1.0351 (2022 low) is still seen as a corrective move. Further rally could be seen to 61.8% projection of 1.0351 to 1.3433 (2024 high) from 1.2099 (2025 low) at 1.4004. But strong resistance could emerge from 1.4248 (2021 high) to limit upside. Sustained break of 55 W EMA (now at 1.3173) will argue that a medium term top has already formed and bring deeper fall back to 1.2099.
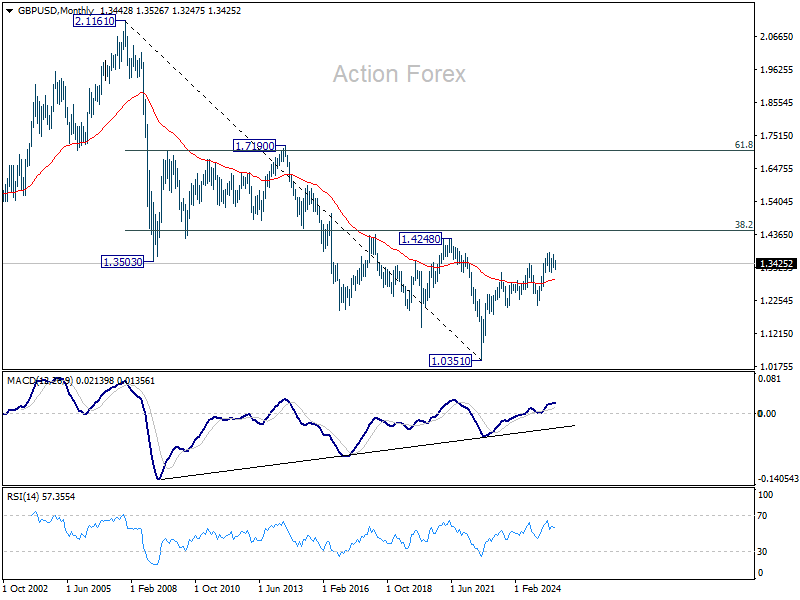
In the long term picture, as long as 1.4248/4480 resistance holds (38.2% retracement of 2.1161 to 1.0351 at 1.4480), the long term outlook will remain bearish. That is, price actions from 1.3051 are seen as a corrective pattern to down trend from 2.1161 (2007 high) only. Nevertheless, decisive break of 1.4248/4480 will be a strong sign of long term bullish reversal.
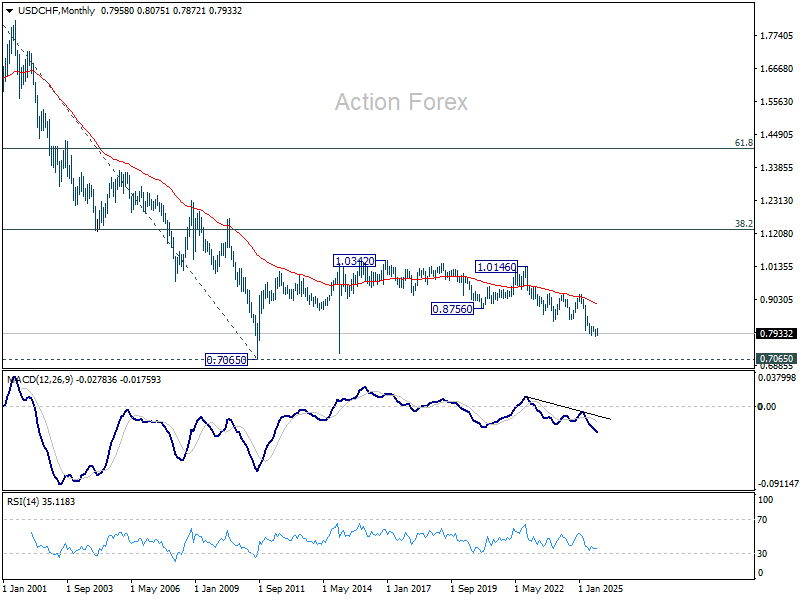
USD/CHF Weekly Outlook
USD/CHF's steep decline last week suggests that corrective rebound from 0.7828 has already completed at 0.8075. But as a temporary low was formed at 0.7872, initial bias is turned neutral this week first. On the downside, below 0.7872 will bring retest of 0.7828. Firm break there will resume larger down trend. However, break of 0.7984 will suggest that corrective pattern from 0.7828 is extending with another rising leg, and target 0.8075 again.
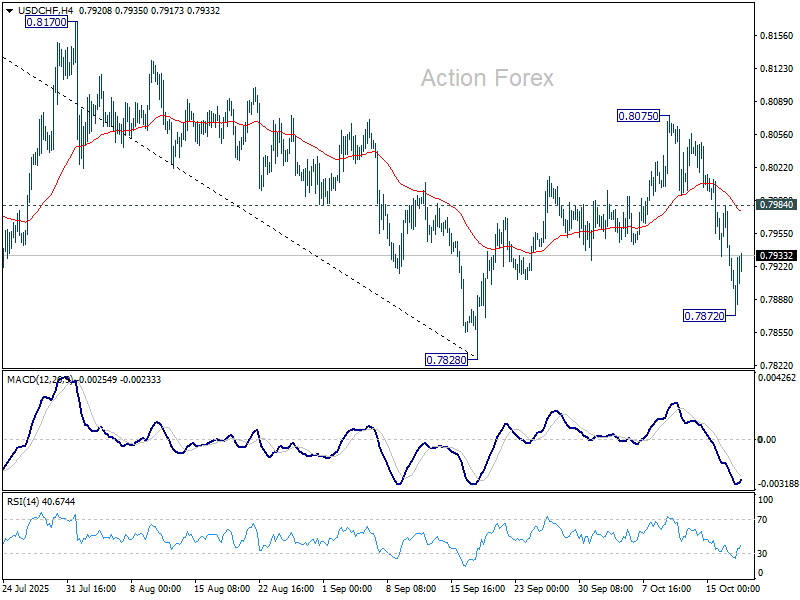
In the bigger picture, long term down trend from 1.0342 (2017 high) is still in progress. Next target is 100% projection of 1.0146 (2022 high) to 0.8332 from 0.9200 at 0.7382. In any case, outlook will stay bearish as long as 0.8332 support turned resistance holds (2023 low).
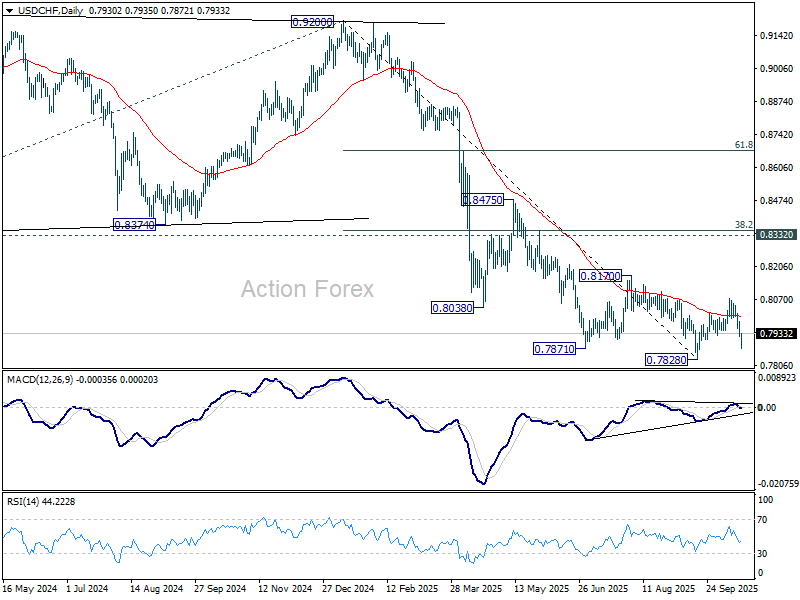
In the long term picture, price action from 0.7065 (2011 low) are seen as a corrective pattern to the multi-decade down trend from 1.8305 (2000 high). It's uncertain if the fall from 1.0342 is the second leg of the pattern, or resumption of the downtrend. But in either case, outlook will stay bearish as long as 0.8756 support turned resistance holds (2021 low). Retest of 0.7065 should be seen next.