
Sample Category Title
EUR/USD Mid-Day Outlook
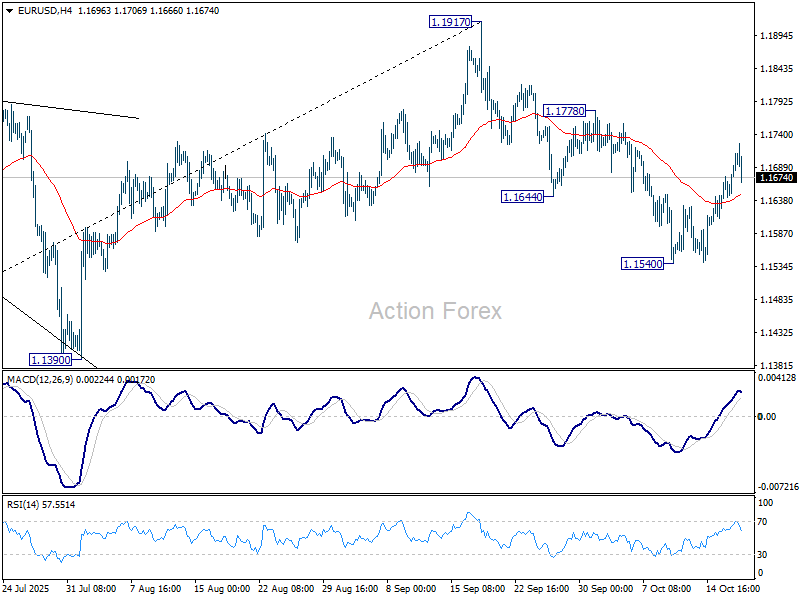
Daily Pivots: (S1) 1.1655; (P) 1.1675; (R1) 1.1706; More…
EUR//USD retreated well ahead of 1.1778 resistance and intraday bias stays neutral. Further decline is still expected with 1.1778 resistance intact. On the downside, break of 1.1540 will resume the fall from 1.1917 to 1.1390 , or further to 38.2% retracement of 1.0176 to 1.1917 at 1.1252. However, firm break of 1.1778 will suggest that pullback from 1.1917 has completed, and bring retest of this high.
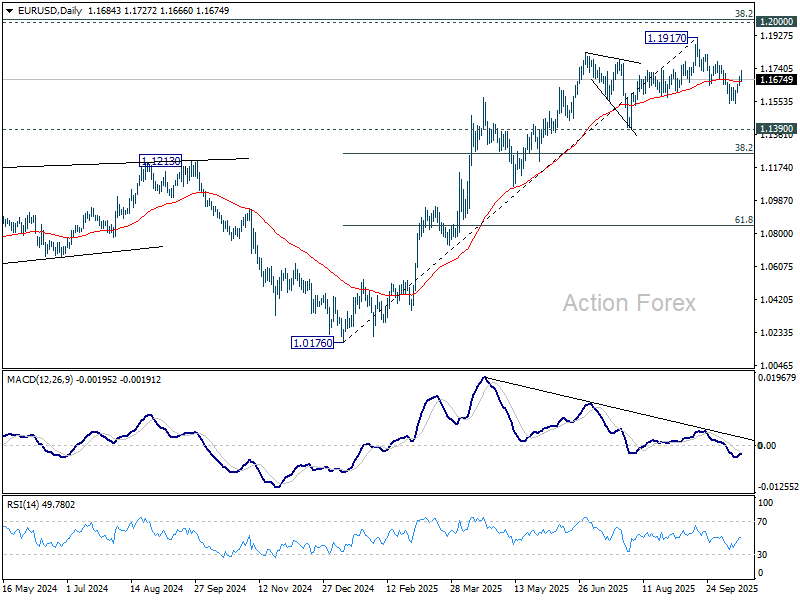
In the bigger picture, considering bearish divergence condition in D MACD, a medium term top is likely in place at 1.1917, just ahead of 1.2 key psychological level. As long as 55 W EMA (now at 1.1274) holds, the up trend from 0.9534 (2022 low) is still extended to continue. Decisive break of 1.2000 will carry larger bullish implications. However, sustained trading below 55 W EMA will argue that rise from 0.9534 has completed as a three wave corrective bounce, and keep outlook bearish.
Wall Street Finds Footing After Bank Rout, but Conviction Still Lacking
As markets enter into U.S. session, sentiment showed signs of stabilization, as investors cautiously stepped back into equities after a sharp selloff in regional banks yesterday. Concerns over credit quality and loan losses had triggered a steep decline in financial stocks, but bargain-hunting helped bank shares rebound, lifting broader index futures in premarket trading. The recovery suggests investors see the recent slump as overdone for the immediate term.
Still, sentiment remains cautious and directionless, with traders reluctant to take bold positions amid a backdrop of multiple macro headwinds — including the U.S. government shutdown, trade friction with China, and geopolitical uncertainty. The market’s current tone suggests consolidation rather than conviction, as participants wait for clearer signals on both policy and economic momentum before re-engaging.
In the currency markets, performance remains consistent with a cautious, risk-off tone. The Swiss Franc continues to lead the week as the strongest major currency, followed by Sterling and Yen, while Loonie lags behind. Dollar and Kiwi are also under pressure, with Aussie and Euro trading mid-range.
In Europe, at the time of writing, FTSE is down -0.96%. DAX is down -1.42%. CAC is up 0.02%. UK 10-year yield is up 0.044 at 4.546. Germany 10-year yield is up 0.013 at 2.588. Earlier in Asia, Nikkei fell -1.44%. Hong Kong HSI fell -2.48%. China Shanghai SSE fell -1.95%. Singapore Strait Times fell -0.63%. Japan 10-year JGB yield fell -0.026 to 1.631.
BoE's Pill: Risk of self-sustaining inflation calls for more cautious pace in cuts
BoE Chief Economist Huw Pill said today that the UK’s inflation remains far stickier than expected, reinforcing the case for a slower pace of monetary easing.
In a speech, Pill noted the “lack of progress” in reducing inflation as “disappointing”. He cautioned that the persistence of above-target inflation, combined with heightened sensitivity among firms and households to price developments, risks creating "self-sustaining inflation dynamics". The prominence of food prices, which directly affect household perceptions of inflation, could further embed inflation expectations if not carefully managed.
This, he argued, calls for a "more cautious pace in withdrawing monetary policy restriction so as to ensure continuation in disinflation towards the 2% target." While Pill reiterated that future rate cuts remain likely over the next year if the outlook evolves as expected, he stressed the importance "to guard against the risk of cutting rates either too far or too fast."
Eurozone CPI finalized at 2.2%, driven by services and food prices
Eurozone inflation edged higher in September, with headline CPI finalized at 2.2% yoy, up from 2.0% in August. The core measure, which excludes energy, food, alcohol & tobacco, also firmed to 2.4% yoy from 2.3%.
The main driver of the increase came from services, which contributed +1.49 percentage points to the annual rate, followed by food, alcohol, and tobacco (+0.58 pp), and non-energy industrial goods (+0.20 pp). Energy continued to be a drag, subtracting -0.03 pp.
Across the broader European Union, annual inflation was finalized at 2.6% yoy, up from 2.4% in August, with wide divergence among member states. Cyprus (0.0%), France (1.1%), and Italy and Greece (1.8%) recorded the lowest rates, while Romania (8.6%), Estonia (5.3%), and Croatia and Slovakia (4.6%) posted the highest. Inflation fell in 8 countries, was stable in 4, and rose in 15.
Ueda signals watchful patience as BoJ weighs October policy options
BoJ Governor Kazuo Ueda reiterated overnight that the central bank will consider rate hikes "if our confidence in hitting the outlook increases”. He added that he intends to continue gathering informations before making any decisions at the October 29–30 policy meeting.
Ueda observed that G20 members regard the world economy as broadly stable but facing persistent risks, from trade disputes to geopolitical frictions. "Many institutions and observers still factor them into their outlooks, or at least treat them as downside risks when assessing the global and U.S. economies,” he said.
BoJ’s Uchida: Further hikes if outlook holds
BoJ Deputy Governor Shinichi Uchida said in a speech on today that the central bank remains prepared to raise interest rates further if its current projections for growth and inflation are realized. He emphasized that the BoJ will “judge without any pre-conception” while monitoring both domestic and global conditions.
Uchida highlighted rising uncertainty surrounding overseas economies, particularly due to shifting trade policies that could influence Japan’s external demand and price trends. “It’s necessary to closely monitor how these developments may affect financial and foreign exchange markets, as well as Japan’s economy and prices,” he said.
EUR/USD Mid-Day Outlook
Daily Pivots: (S1) 1.1655; (P) 1.1675; (R1) 1.1706; More…
EUR//USD retreated well ahead of 1.1778 resistance and intraday bias stays neutral. Further decline is still expected with 1.1778 resistance intact. On the downside, break of 1.1540 will resume the fall from 1.1917 to 1.1390 , or further to 38.2% retracement of 1.0176 to 1.1917 at 1.1252. However, firm break of 1.1778 will suggest that pullback from 1.1917 has completed, and bring retest of this high.
In the bigger picture, considering bearish divergence condition in D MACD, a medium term top is likely in place at 1.1917, just ahead of 1.2 key psychological level. As long as 55 W EMA (now at 1.1274) holds, the up trend from 0.9534 (2022 low) is still extended to continue. Decisive break of 1.2000 will carry larger bullish implications. However, sustained trading below 55 W EMA will argue that rise from 0.9534 has completed as a three wave corrective bounce, and keep outlook bearish.
BoE’s Pill: Risk of self-sustaining inflation calls for more cautious pace in cuts
BoE Chief Economist Huw Pill said today that the UK’s inflation remains far stickier than expected, reinforcing the case for a slower pace of monetary easing.
In a speech, Pill noted the “lack of progress” in reducing inflation as “disappointing”. He cautioned that the persistence of above-target inflation, combined with heightened sensitivity among firms and households to price developments, risks creating "self-sustaining inflation dynamics". The prominence of food prices, which directly affect household perceptions of inflation, could further embed inflation expectations if not carefully managed.
This, he argued, calls for a "more cautious pace in withdrawing monetary policy restriction so as to ensure continuation in disinflation towards the 2% target." While Pill reiterated that future rate cuts remain likely over the next year if the outlook evolves as expected, he stressed the importance "to guard against the risk of cutting rates either too far or too fast."
XAU/USD: Gold Continues to Hit New Record High in Each Session
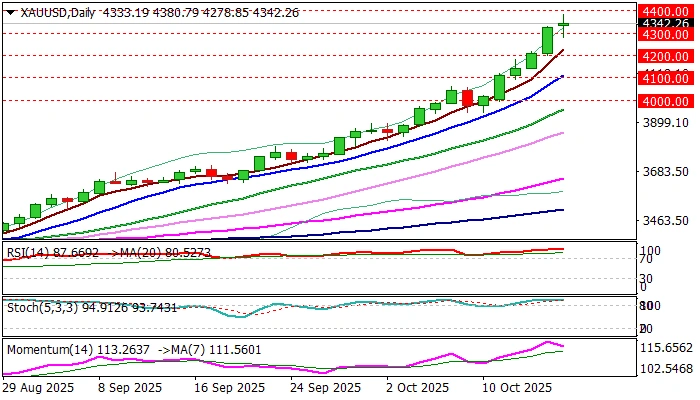
Gold continues to hit new record high on daily basis and rose to $4380 in early Friday trading, after the metal rallied 2.8% on Thursday and closed above $4300, recording new fastest move between two round-figure levels of just one day.
The yellow metal remains in strong uptrend which accelerates and steepens in growing euphoria over historical rally into safety.
Gold is also on track for weekly gain of over 8%, which marks the best week since September 2008, as the price was up almost $400 during the past five days and has advanced around 66% from the beginning of the year.
Growing trade tensions between the US and China, which threaten of uncontrollable escalation, tough rhetorics of Moscow, Washington and NATO over the war in Ukraine, fragile peace in the Middle East, clouded political and economic situation in a number of developed countries and strong demand for physical gold from central banks continue to fuel gold’s rally, with the newest signs of weakness in US regional banks, adding to the cocktail of key factors that continue to lift metal’s price.
Bulls remained resilient despite strongly overbought daily and weekly studies, but some price adjustment is likely to be seen soon, as 14-d momentum turned south and strongly overbought \RSI turned sideways, generating initial signal.
However, potential consolidation or correction is likely to be limited and probably mark positioning for fresh push higher, if current strongly supportive environment persists.
Broken $4300 level, although being cracked, marks initial support, with deeper pullback to ideally hold above $4200 (psychological / Thursday’s low) and not exceed rising daily Tenkan-sen ($4160) to keep bulls in play for probe through $4400 and possible attack at $4500, which now marks key barrier.
Res: 4380; 4400; 4422; 4500.
Sup: 4300; 4278; 4200; 4160.
USD/JPY: US-Japan Yield Spread Breakdown Signals Further Yen Strength Ahead in the Near Term
Key takeaways
- USD/JPY reversed from its recent high of 153.28, falling 2.2% as bullish U.S. dollar momentum faded.
- Political uncertainty in Japan weakened the “Takaichi Trade,” reducing bets on extended monetary easing.
- The 10-year U.S.-Japan sovereign yield spread broke below key 2.47% support, signalling further downside pressure.
- Technical indicators point to a short-term bearish setup, with support at 149.05–148.55 and resistance at 151.70.
Since our prior report, the USD/JPY has witnessed a minor “momentum crush” as bullish sentiment of the US dollar took a backseat, where the USD/JPY did a residual push up to print an intraday high of 153.28 on 10 October 2025, before it tumbled by 2.2% to hit an intraday low of 149.90 at the time of writing.
In addition, the “Takaichi Trade” of shorting the yen in anticipation of a revival of easy monetary policy in Japan has lost traction as Sanae Takaichi, the newly elected leader of the LDP ruling party, may not receive enough parliamentary votes to become Japan’s next prime minister after the LDP’s long-term coalition partner, Komeito withdrew its 26-year partnership with the LDP.
Let’s now look at several macro and technical factors that suggest further potential downside in the USD/JPY, at least in the near term.
10-year US Treasury/JGB yield spread has (finally) broken below a major support level of 2.47%
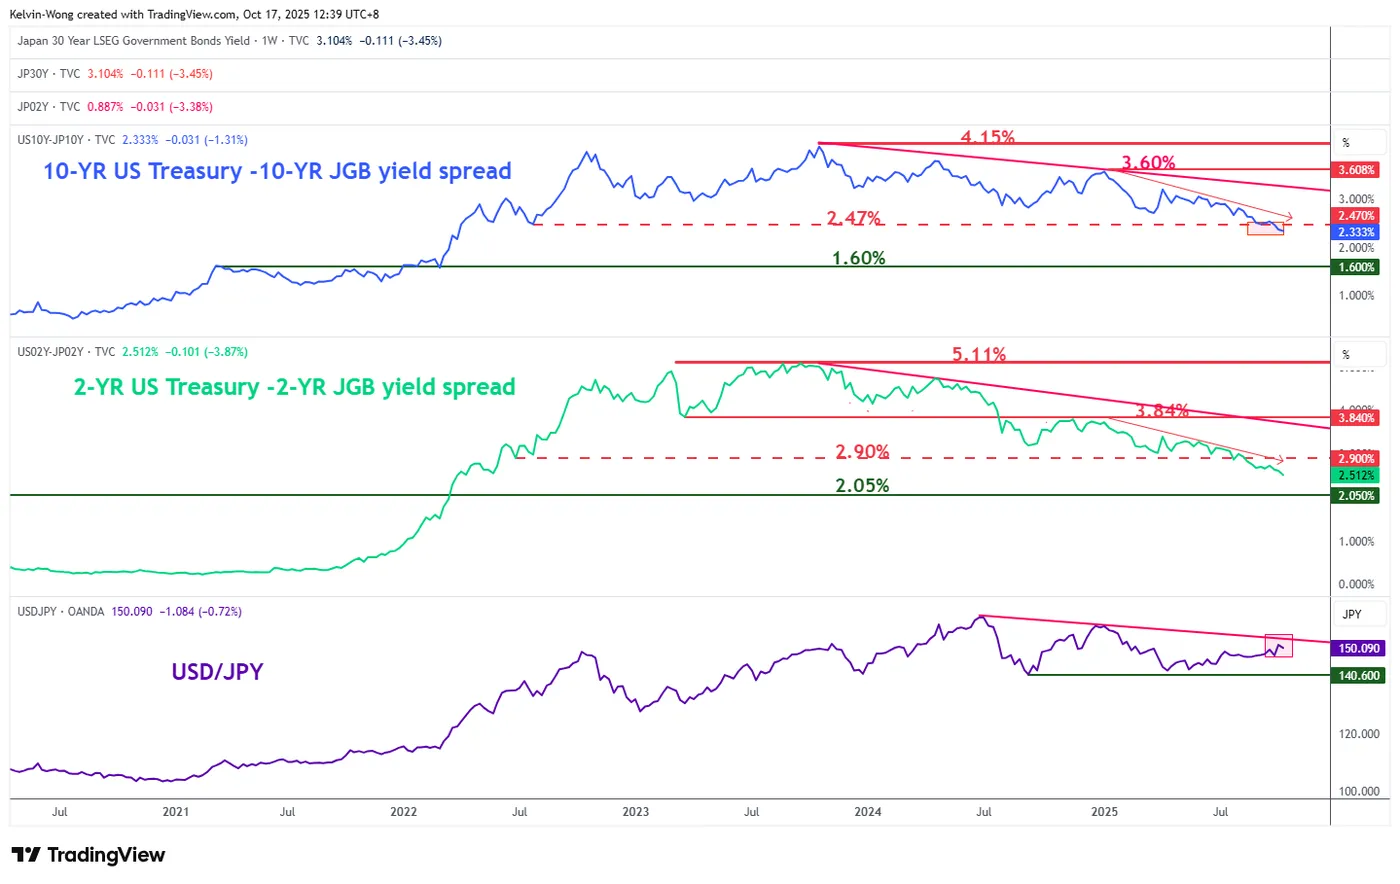
Fig. 1: Yield spreads of US Treasury/JGB with major trend of USD/JPY as of 17 Oct 2025 (Source: TradingView)
The 10-year yield differential between the US Treasury note and JGB has broken below the 2.47% major support with a daily close below it since 8 October 2025 (see Fig. 1)
A move away further down from 2.47% is likely to cement a further narrowing of the 10-year US-Japan sovereign bond yield differential, and a similar movement occurred during late December 2024 to mid-April 2025 that triggered a medium-term decline of 10% on the USD/JPY.
Implied volatility from JPY options has started to tick higher
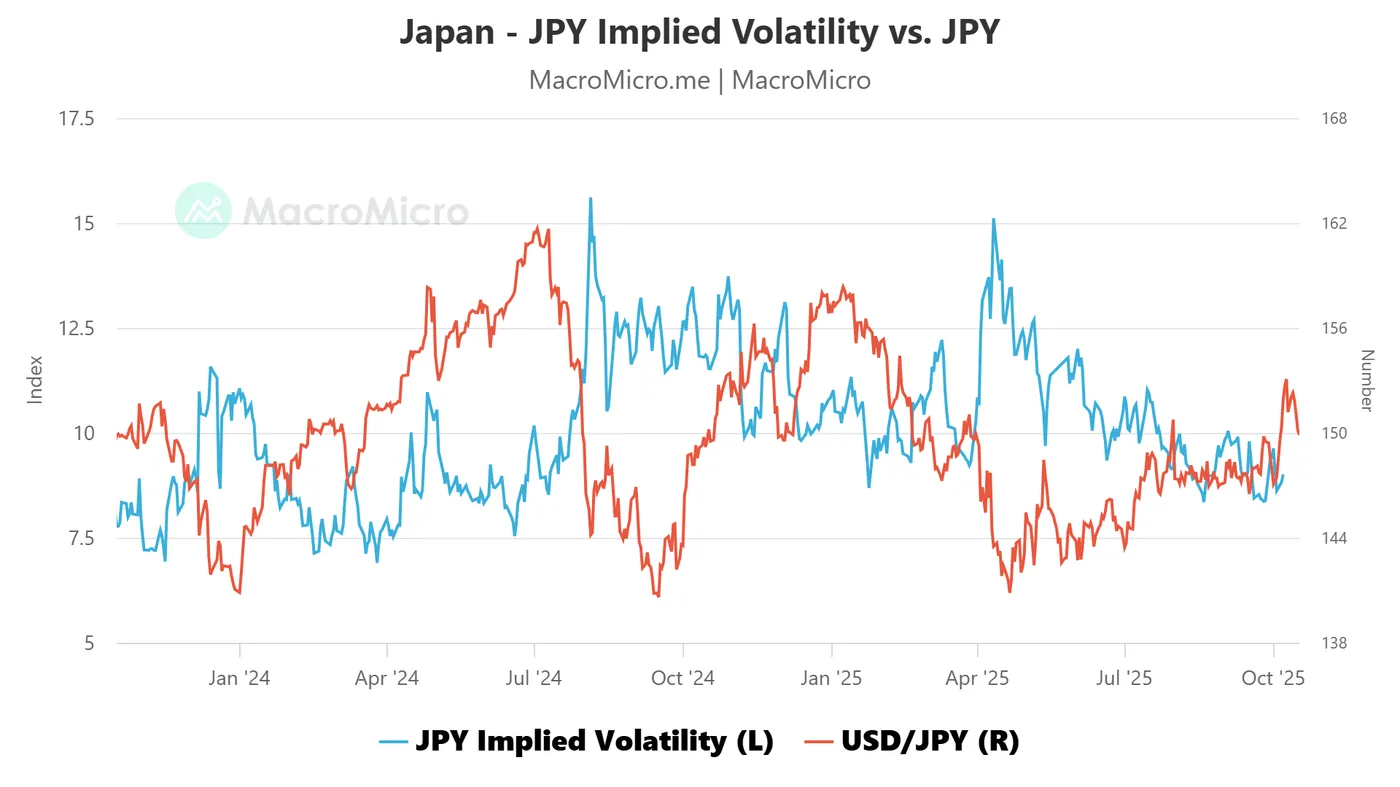
Fig. 2: JPY implied volatility as of 7 Oct 2025 (Source: MacroMicro)
The implied volatility of JPY measured via FX options has started to increase from a relatively low level of 8.39 printed on 26 September 2025 (almost a 9-month low) to 9.01 on 7 October 2025 (see Fig. 2)
Prior similar observations seen from 24 January 2025 to 7 February 2025, where the implied volatility of JPY jumped from 8.69 to 10.59, which thereafter led to a fall of 10% on the USD/JPY.
Failure bullish breakout on the USD/JPY
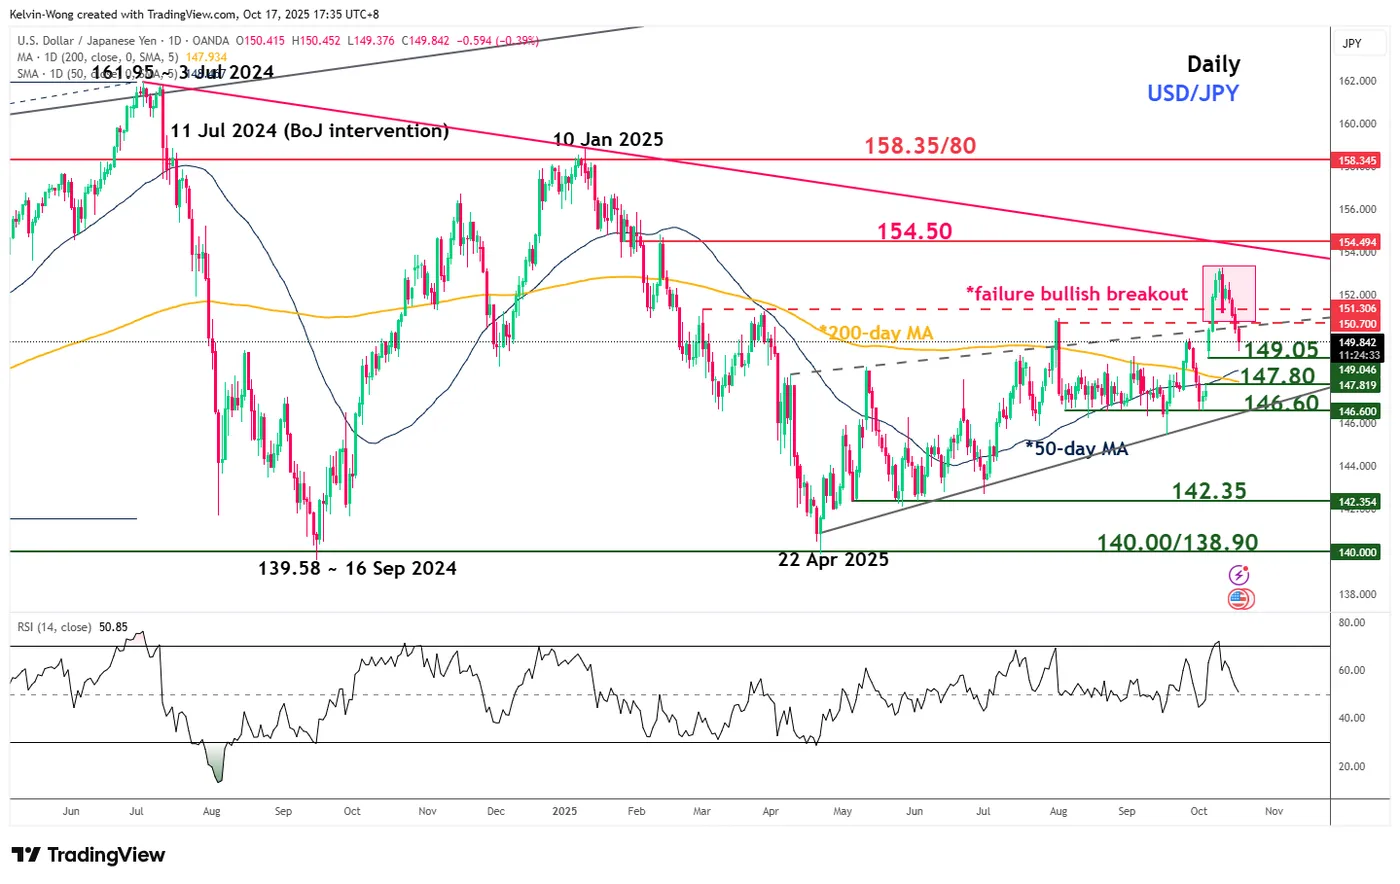
Fig. 3: USD/JPY medium-term trend as of 17 October 2025 (Source: TradingView)
The recent bullish breakout of the USD/JPY above its “Ascending Wedge” range resistance on 7 October 2025 is considered a “failure bullish breakout” as its latest price actions of the USD/JPY have reintegrated back below the aforementioned range resistance at 150.50.
These observations suggest that the USD/JPY is likely to revert to its medium-term sideways motion, with the key range support to watch at 146.60 (see Fig. 3).
We will now examine its latest short-term (1 to 3 days) trajectory and key technical levels to watch on USD/JPY
Preferred trend bias (1-3 days) – Vulnerable for a bearish break below 20-day MA
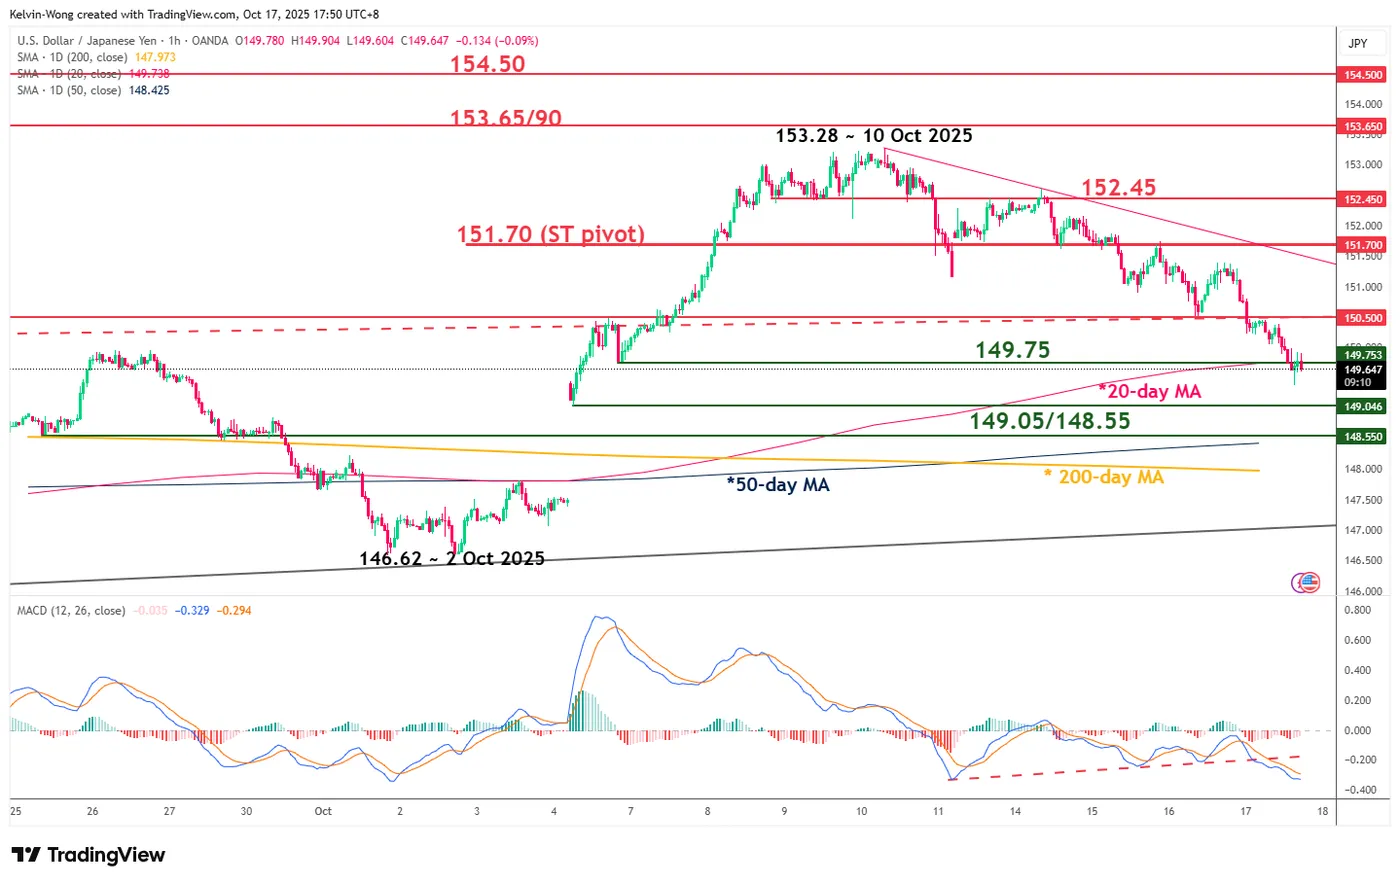
Fig. 4: USD/JPY minor trend as of 17 October 2025 (Source: TradingView)
Bearish bias in any bounces below 151.70 key short-term pivotal resistance, and a break below 149.75 exposes the next intermediate support zone at 149.05/148.55 in the first step (see Fig. 4).
Key elements
- The hourly MACD trend indicator of the USD/JPY has broken below a key ascending trendline support that has occurred below the centreline, which suggests a potential buildup of a bearish momentum condition.
- These observations indicate that the 20-day moving average, which is acting as a near-term support at 149.75, is likely to be broken down.
- The intermediate support zone of 149.05/148.55 is defined by the gap support formed on 6 October 2025 and the 50-day moving average.
Alternative trend bias (1 to 3 days)
A clearance above 151.70 key short-term resistance invalidates the bearish scenario for a squeeze up towards the next intermediate resistance at 152.45.
US: Lack of Labor Market Data Due to Government Shutdown – Investors Seek Alternative Indicators
- Investors rely on private data (ADP, ISM, Conference Board), but correlations with official figures are weak.
- Alternative indicators suggest slower hiring, not a collapse.
- The Fed is likely to stay cautious with future rate cuts.
The third week of the partial shutdown of the U.S. federal government is increasingly disrupting access to official economic data. The suspension of key reports makes it more difficult for the Federal Reserve to assess the economic situation as it prepares for the upcoming FOMC meeting scheduled for October 28–29. In this environment, investors and analysts are attempting to replace government statistics with private-sector indicators — though their reliability remains limited.
Limited Access to Data and the Fed’s Policy Challenges
Due to the ongoing stalemate in Congress, many federal agencies, including statistical offices, have been closed since October 1. This has resulted in the suspension of several crucial releases, including employment reports. The Bureau of Labor Statistics (BLS) plans to publish consumer inflation data on October 24, albeit with a one-week delay. For the Federal Reserve, this situation represents a significant obstacle to evaluating the state of the economy — especially the labor market, which currently shows signs of fragility.
Private Data Sources – Limited Informational Value
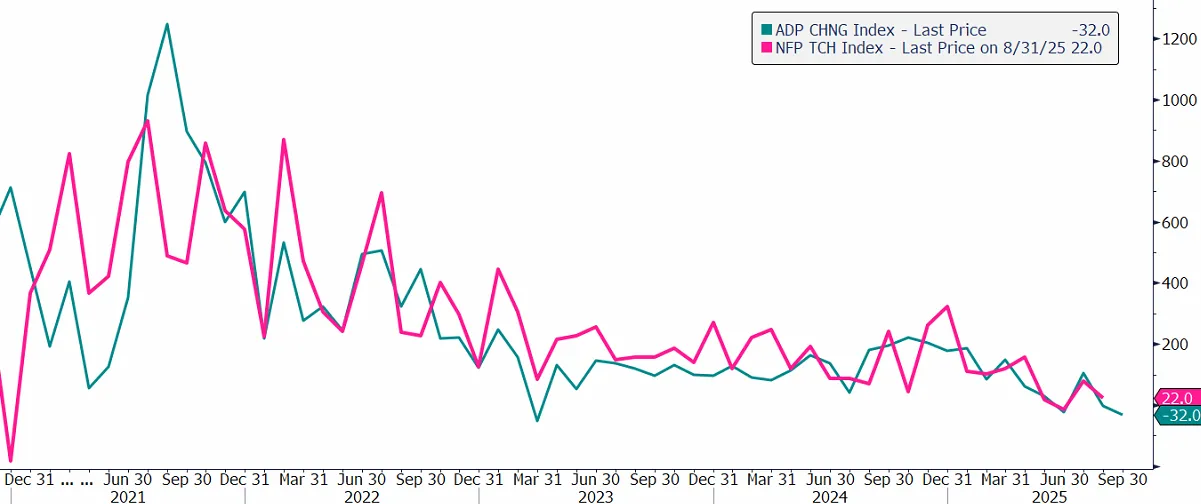
ADP: The ADP report, based on payroll data from 26 million private-sector employees, showed that U.S. private employers cut 32,000 jobs in September, marking the latest sign that the labor market is entering a significant slowdown. By sector, the largest losses were recorded in service-providing industries, including leisure and hospitality as well as business services, where employment fell by 28,000 positions. Moreover, the real-time correlation between ADP data and official BLS figures remains very weak at 0.12, indicating no statistically meaningful relationship. As a result, the ADP report provides limited insight into what the official employment report might have shown had the government not been shut down.
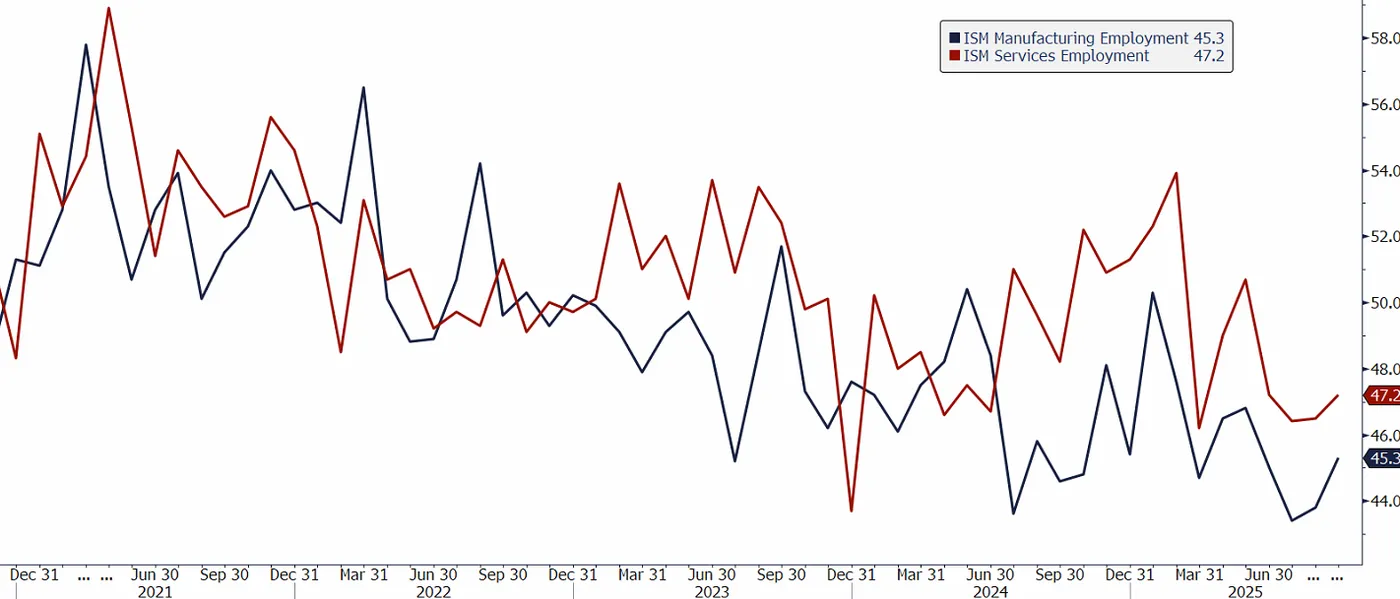
ISM Indices: The Institute for Supply Management’s manufacturing and services surveys suggest a slowdown in hiring, with both employment components remaining below the neutral 50-point threshold. In September, the employment subindex for the services sector stood at 47.2 points, while the manufacturing employment subindex came in at 45.3 points — both signaling contraction in hiring activity. While the manufacturing employment index shows a moderate correlation (0.6) with employment dynamics, its volatility and discrepancies with actual data limit its predictive reliability.
Sentiment Indicators and Predictive Models
Conference Board: The gap between the share of respondents who believe that “jobs are plentiful” and those who say they are “hard to get” (known as the labor market differential) is highly correlated with the unemployment rate. This metric has recently declined, signaling a deterioration in consumer sentiment and suggesting possible softening in the labor market over the coming months.
Chicago Fed: The Federal Reserve Bank of Chicago continues to publish its own unemployment rate estimates based on models incorporating both public and private data. According to the latest (not yet officially released) estimates, the unemployment rate stood at 4.34 percent in September — only slightly higher than August’s 4.32 percent. However, the historical accuracy of this model has been limited.
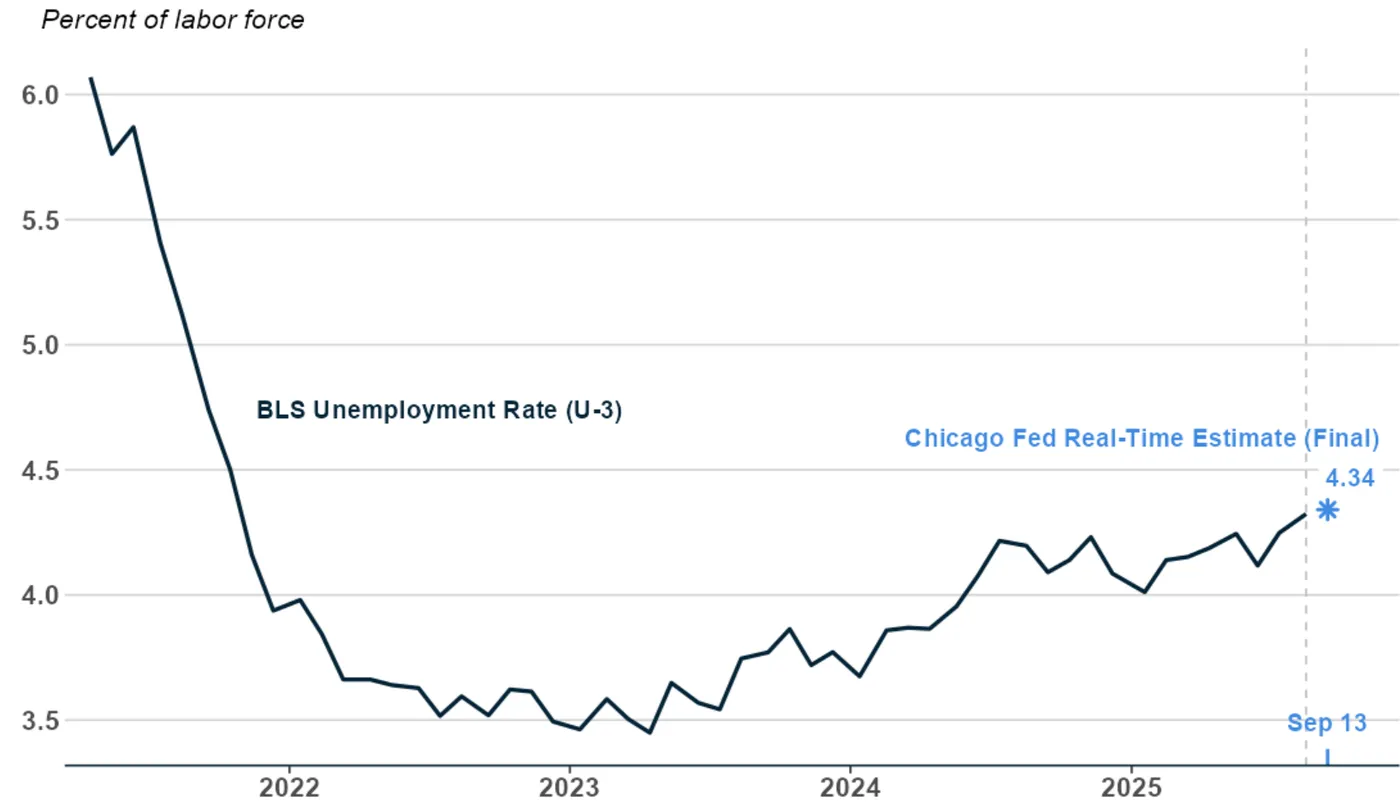
Chicago Fed Real-Time Unemployment Rate (September 2025), source: chicagofed.org
The Labor Market Is Slowing, Not Collapsing
While alternative indicators provide some insight into current economic conditions, they cannot fully replace official data, which remain methodologically consistent and historically comparable. The available private data suggest a moderation in hiring momentum rather than a sharp downturn. The U.S. labor market thus appears to be entering a phase of gradual cooling rather than contraction — a scenario that may encourage the Federal Reserve to proceed cautiously with further interest rate cuts in the months ahead.
Eurozone CPI finalized at 2.2%, driven by services and food prices
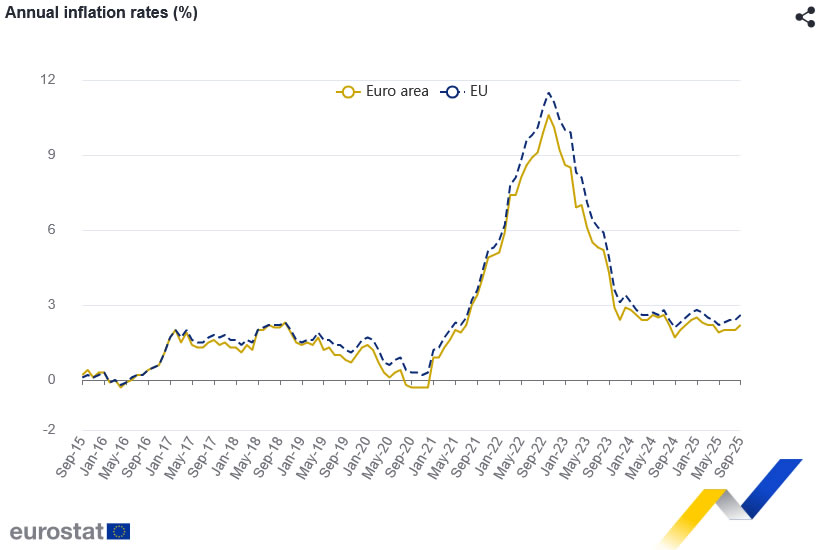
Eurozone inflation edged higher in September, with headline CPI finalized at 2.2% yoy, up from 2.0% in August. The core measure, which excludes energy, food, alcohol & tobacco, also firmed to 2.4% yoy from 2.3%.
The main driver of the increase came from services, which contributed +1.49 percentage points to the annual rate, followed by food, alcohol, and tobacco (+0.58 pp), and non-energy industrial goods (+0.20 pp). Energy continued to be a drag, subtracting -0.03 pp.
Across the broader European Union, annual inflation was finalized at 2.6% yoy, up from 2.4% in August, with wide divergence among member states. Cyprus (0.0%), France (1.1%), and Italy and Greece (1.8%) recorded the lowest rates, while Romania (8.6%), Estonia (5.3%), and Croatia and Slovakia (4.6%) posted the highest. Inflation fell in 8 countries, was stable in 4, and rose in 15.
BoJ’s Uchida: Further hikes if outlook holds
BoJ Deputy Governor Shinichi Uchida said in a speech on today that the central bank remains prepared to raise interest rates further if its current projections for growth and inflation are realized. He emphasized that the BoJ will “judge without any pre-conception” while monitoring both domestic and global conditions.
Uchida highlighted rising uncertainty surrounding overseas economies, particularly due to shifting trade policies that could influence Japan’s external demand and price trends. “It’s necessary to closely monitor how these developments may affect financial and foreign exchange markets, as well as Japan’s economy and prices,” he said.
Yen Nears End of Corrective Phase
Market sentiment remains highly sensitive to rhetoric from the Federal Reserve and statements from the White House. This is particularly true given the protracted government shutdown and the resurgence of trade disputes with several Asian partners.
While heightened geopolitical tensions in the region are bolstering demand for the yen as a safe-haven asset, the broader monetary policy divergence between the Fed and the Bank of Japan continues to favour the US dollar.
The greenback remains under pressure due to ongoing uncertainty from the shutdown and escalating "Trump trade wars." These factors are amplifying market volatility, prompting traders to lock in positions ahead of key inflation data and scheduled speeches from Fed officials.
Conversely, the Japanese yen is attracting moderate support from falling US Treasury yields and growing demand for safe-haven assets.
Technical Analysis: USD/JPY
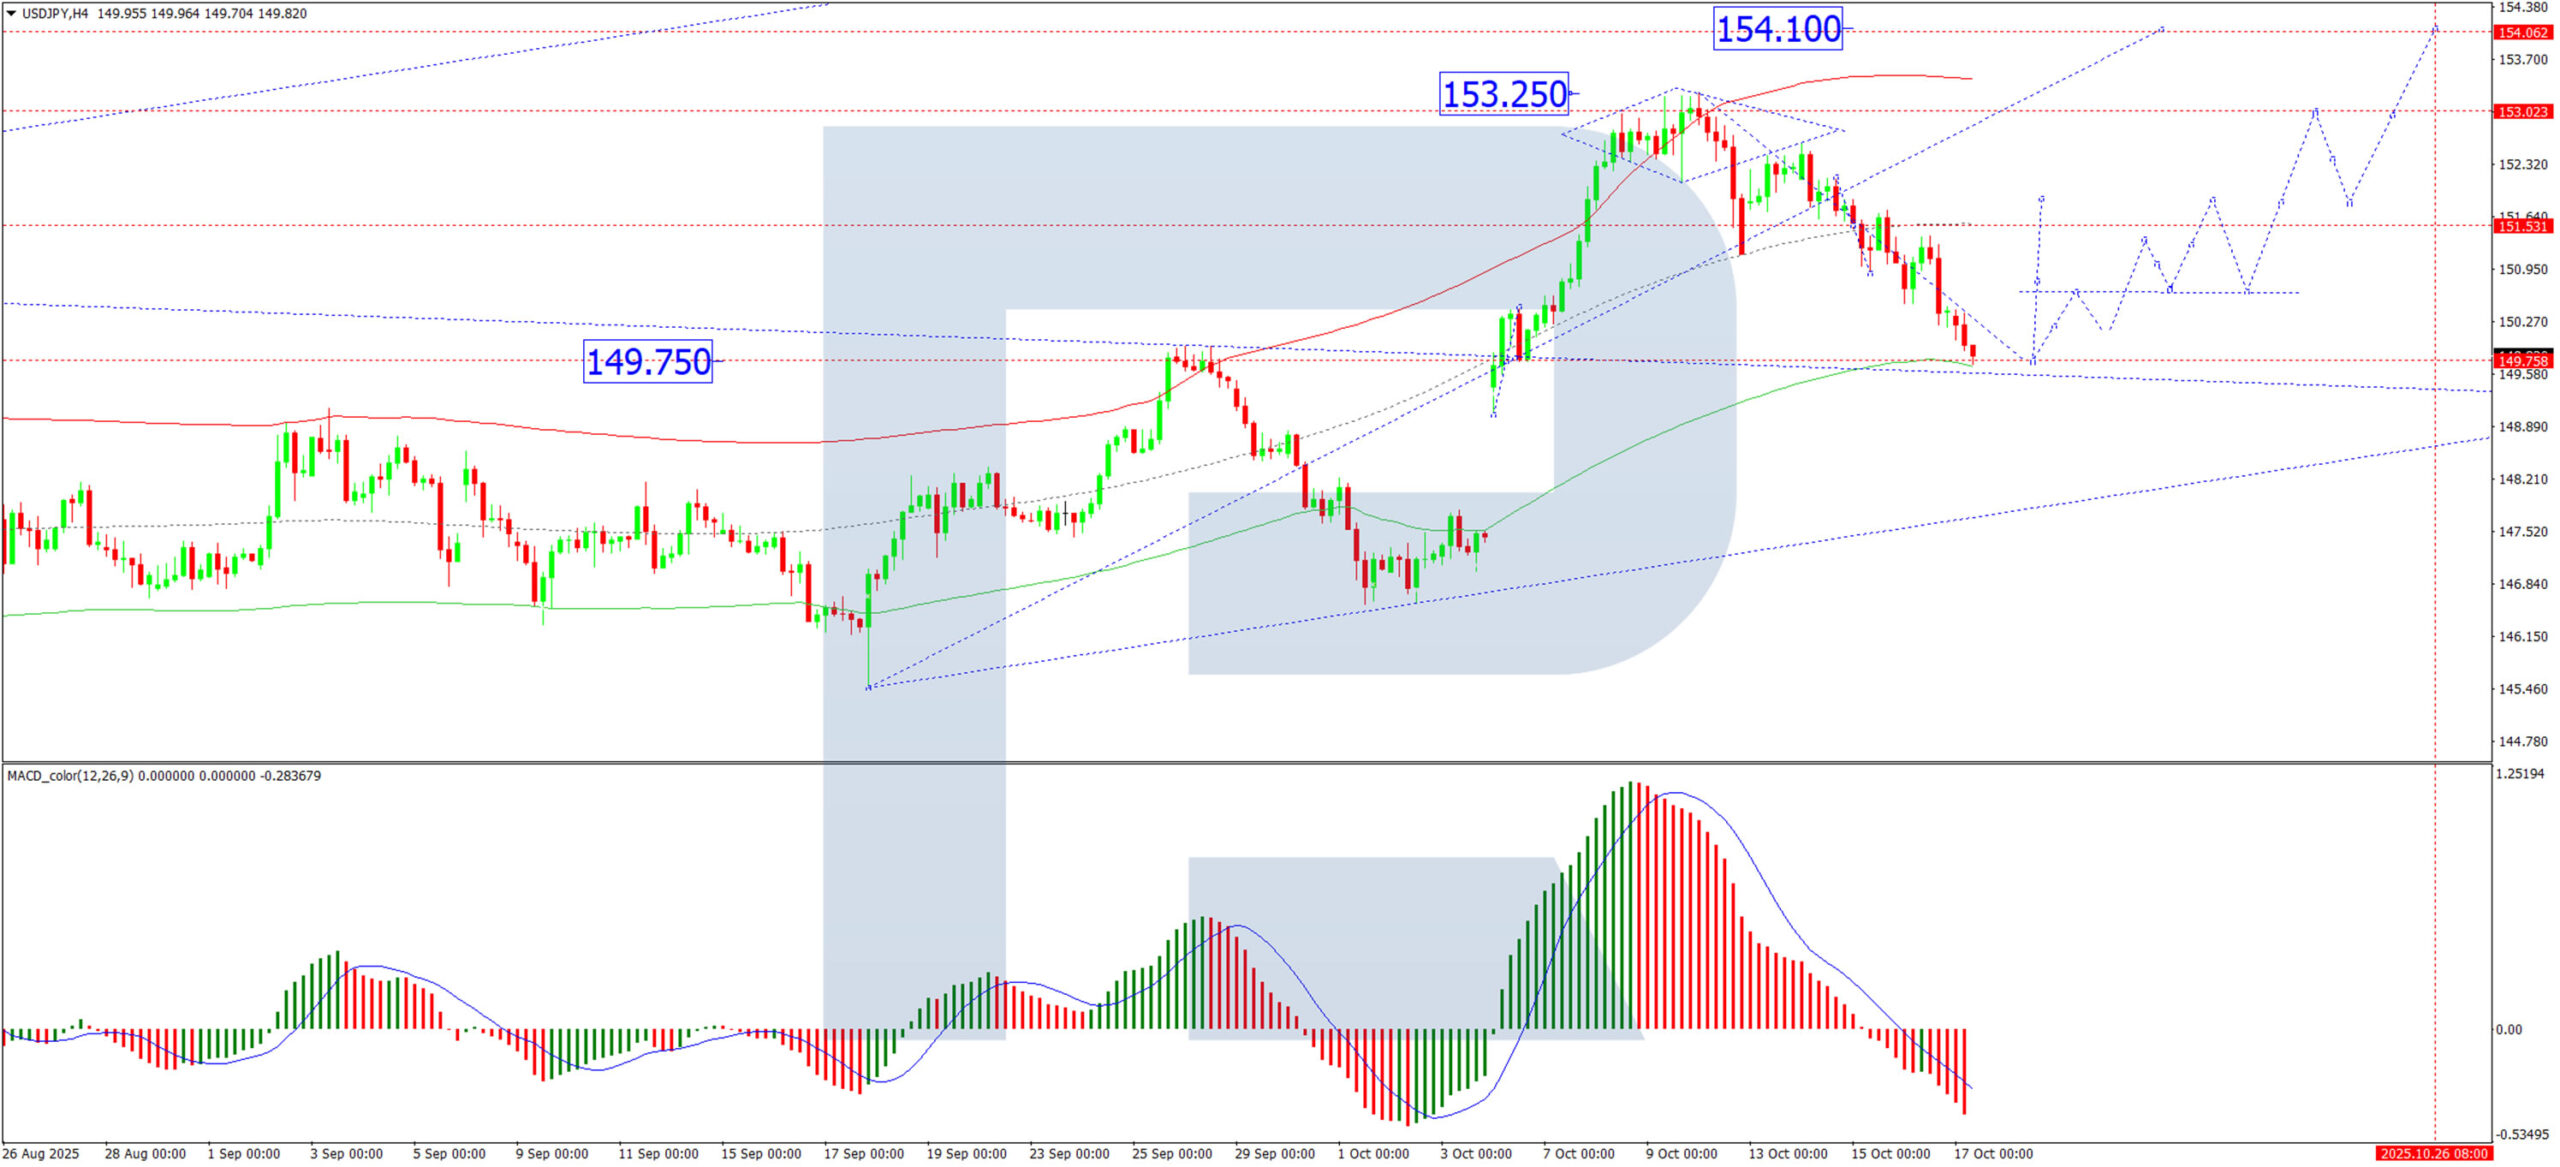
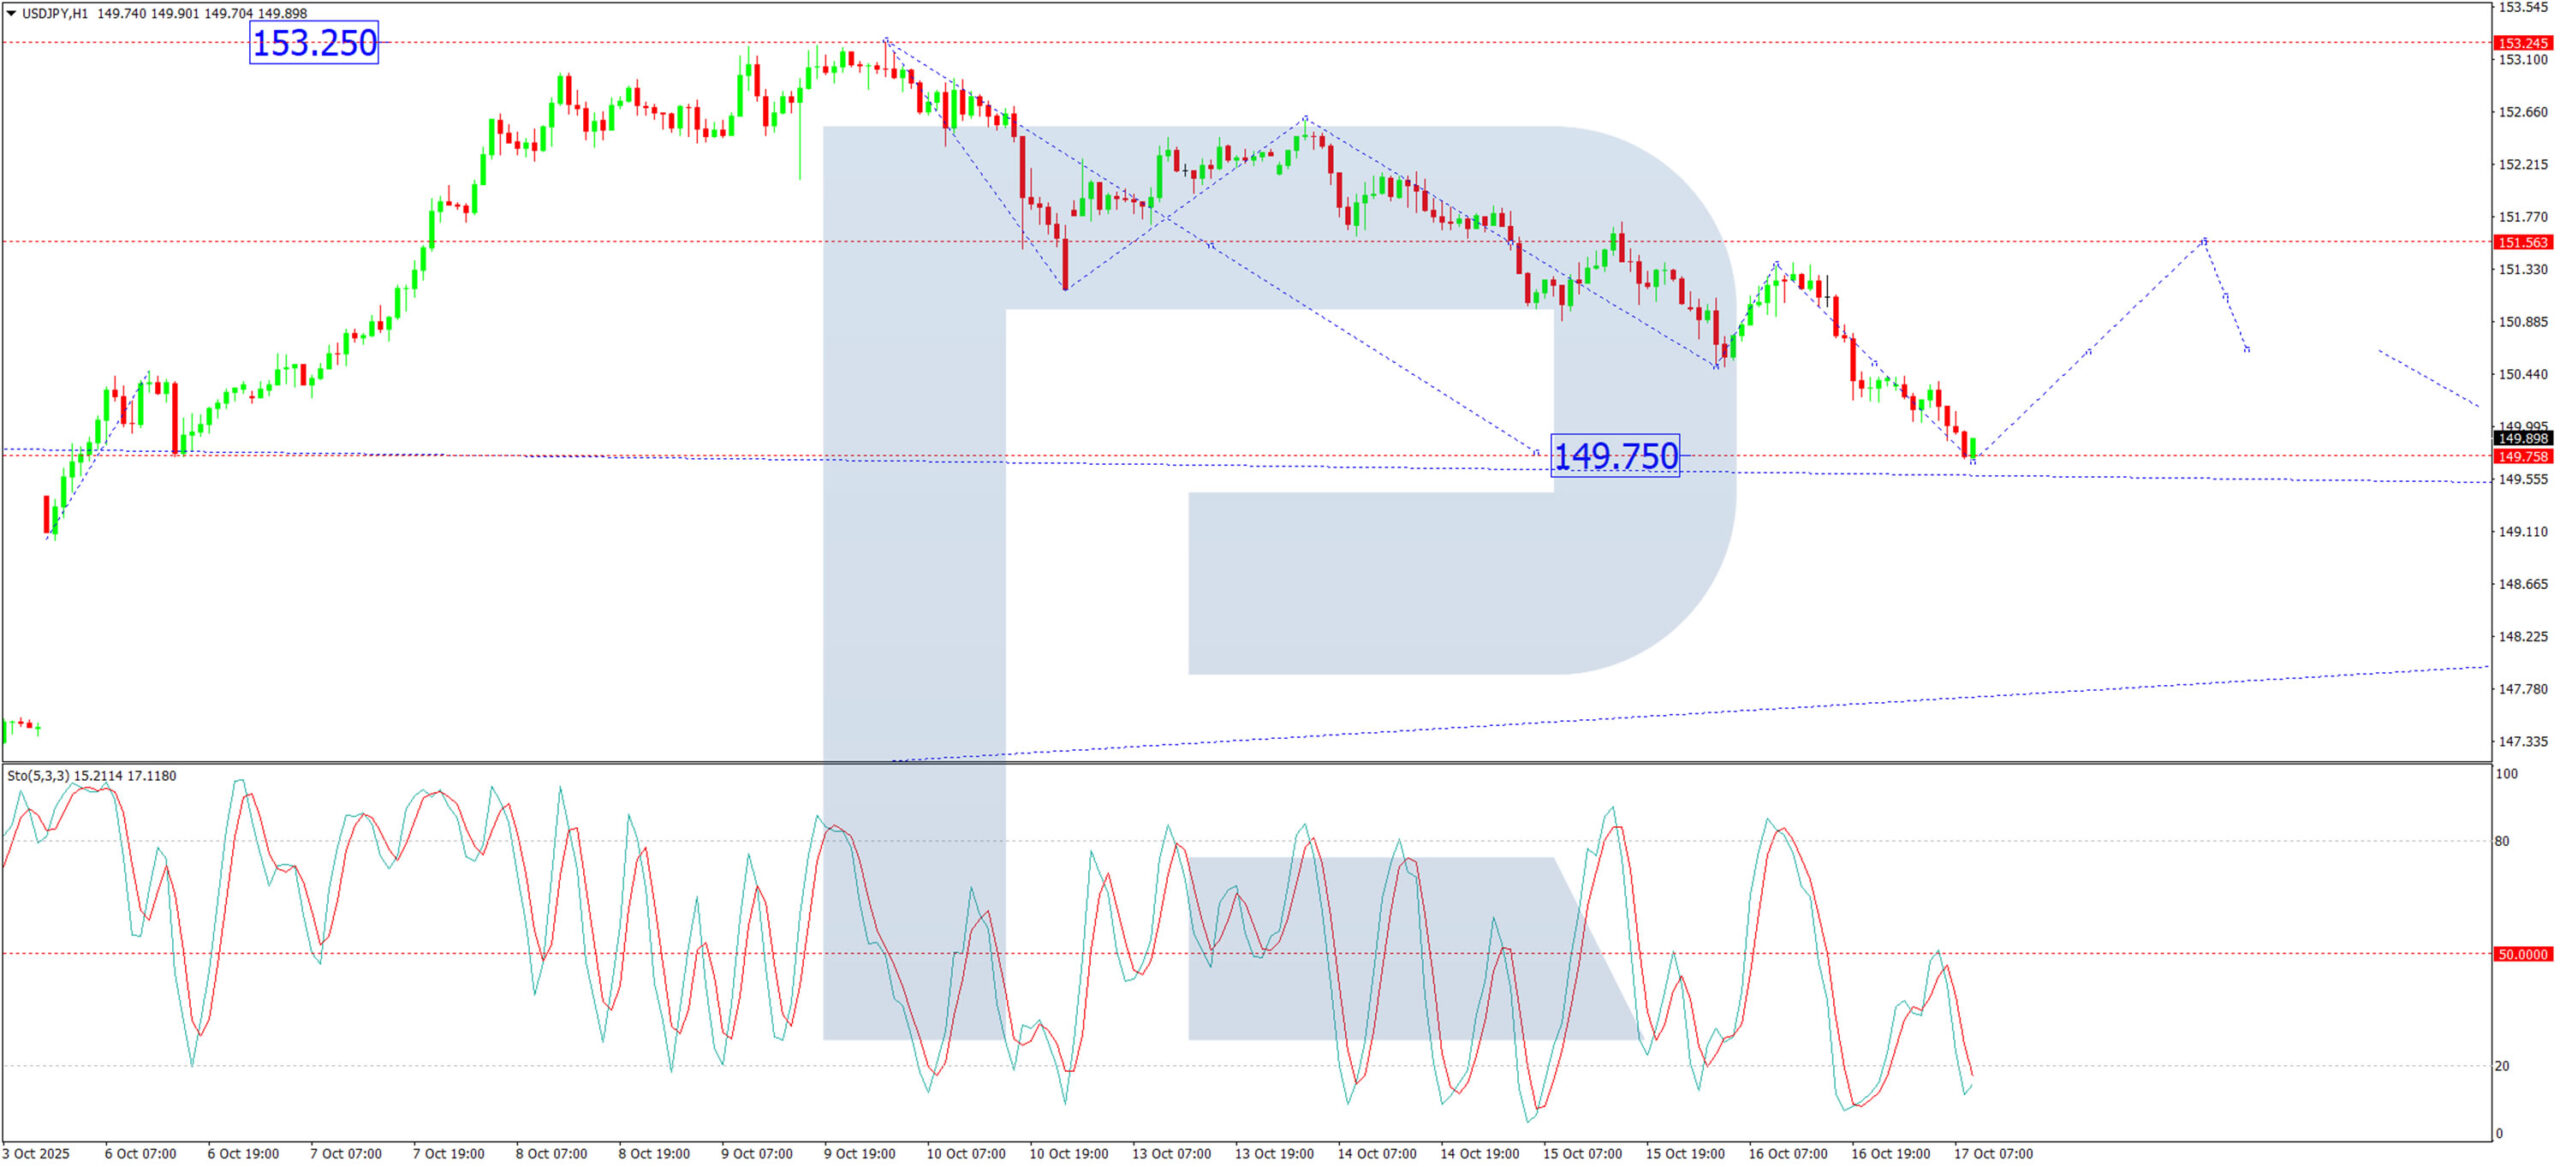
H4 Chart:
The USD/JPY pair has completed a corrective decline, finding a base at 149.75. We anticipate this correction is now concluding, paving the way for a growth wave with an initial target of 151.55 (testing it from below). Following this, a pullback towards 150.60 is plausible, potentially forming a local consolidation range. An upward breakout from this range would signal a continuation of the bullish momentum towards 154.10, which serves as the next local target. This outlook is technically confirmed by the MACD indicator, whose signal line is at lows below zero and appears to be reversing upwards, suggesting a new growth impulse is likely forming.
H1 Chart:
The market concluded its downward wave at 149.75 and is currently consolidating at the range's lower boundary. We expect an initial growth wave to 151.55, to be followed by a potential correction to 150.60. The bullish scenario is further supported by the Stochastic oscillator; its signal lines are deep in the oversold territory (below 20) and are poised to rise towards 80, indicating significant recovery potential in the coming hours.
Conclusion
The technical picture suggests the yen's correction is finalising. While safe-haven flows provide underlying support, the dominant driver remains the significant monetary policy divergence, which is expected to ultimately favour the dollar. The immediate trajectory will be guided by the market's reaction to upcoming US data and Fed commentary.
EUR/CAD Hits 16-Year High
Charts show that the euro strengthened against the Canadian dollar on Thursday, with the pair climbing above 1.6460 for the first time since spring 2009, when the world was still reeling from the global financial crisis.
The current weakness of the Canadian dollar is being influenced by several factors:
→ Trade relations with the United States – according to media reports, some Canadian industries such as steel and automotive manufacturing are facing competitive disadvantages under the current agreement.
→ Oil prices have fallen to a five-month low, partly due to expectations surrounding a potential meeting between the US and Russian presidents. As we noted on 13 October, the XTI/USD exchange rate could drift towards $55 per barrel.
Meanwhile, the euro has benefited from the softening of the US dollar. Notably, the DXY index has turned lower from a key resistance level — the upper boundary of the channel identified in our 9 October analysis.
However, an examination of the EUR/CAD chart suggests that the current upward momentum may be losing steam.
Technical Analysis of the EUR/CAD Chart
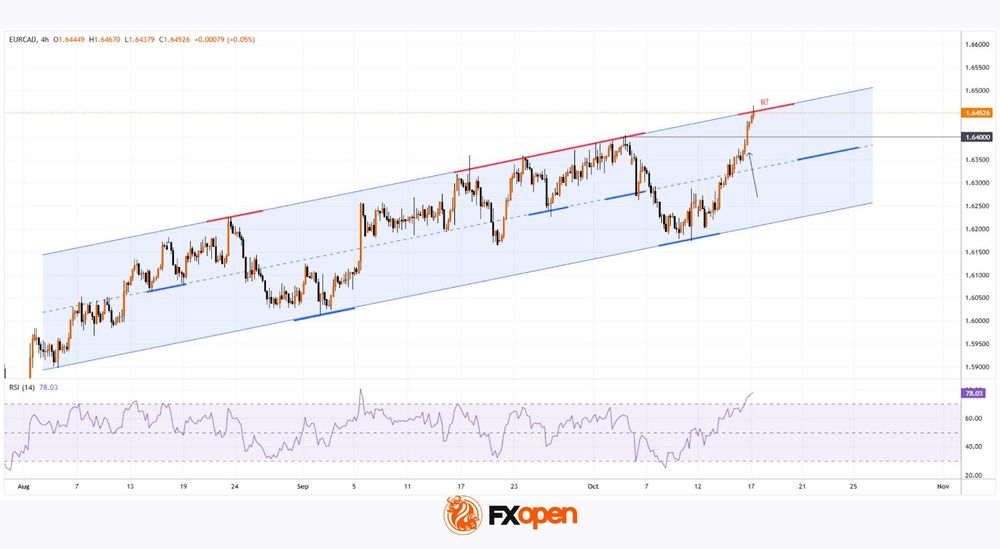
Price movements — with key turning points shown in bold — outline a rising channel that has remained relevant since August.
The bearish case rests on the following factors:
→ The pair has reached the upper boundary of the channel, which has repeatedly acted as strong resistance and may do so again.
→ The sharp mid-October rally pushed the RSI indicator into extreme overbought territory.
On the other hand, price action continues to reflect strong demand, as seen in the clean breakout above the previous peak near 1.6400, which occurred on a wide bullish candle with minimal pullback.
In these conditions, it is reasonable to assume that:
→ After a 1.6% rise in seven days, some long holders may start taking profits, leading to consolidation near the upper boundary of the channel;
→ If a correction from the upper channel line develops, it is likely to be shallow, as bullish activity could re-emerge around the median line, reinforced by the former resistance at 1.6400.
Trade over 50 forex markets 24 hours a day with FXOpen. Take advantage of low commissions, deep liquidity, and spreads from 0.0 pips. Open your FXOpen account now or learn more about trading forex with FXOpen.
This article represents the opinion of the Companies operating under the FXOpen brand only. It is not to be construed as an offer, solicitation, or recommendation with respect to products and services provided by the Companies operating under the FXOpen brand, nor is it to be considered financial advice.