Sample Category Title
Agents of Secular Stagnation
History suggests that waves of technological innovation take time to show up in productivity, with users not producers reaping the spoils. Productivity pessimism in Australia should not last forever.
- Like the computer revolution before it, the AI revolution is likely to boost productivity and potential output growth, but this could take a while.
- Assuming potential output growth remains as weak in coming years as it was in the ‘secular stagnation’ era of the first couple of decades this century is justifiable in the short run. Over time, though, some pick-up should be expected, unless one is willing to make some strong assumptions about Australia’s economic performance and AI adoption.
- Potential output growth and other latent quantities are hard to estimate and even harder to detect changes in real time. Focusing on prices rather than extracting trends from quantities may be more fruitful. The risk is that productivity pessimism breeds policy error.
We are frequently asked how Australia might boost its productivity growth and so its living standards. We are also frequently asked our view of the implications of genAI and large language models. These questions are mostly about the medium term but the underlying beliefs also have implications for macroeconomic policymaking in the short term.
A little historical background is in order here. Australia, and most of the rest of the Western world, experienced a boom in productivity growth in the late 1990s associated with the adoption of computers and the internet. That episode held two lessons. First, it took time for a new wave of technology to be fully adopted and embedded in business models and processes. That is why it initially seemed that the computer revolution had not boosted productivity – recall leading US economist Bob Solow’s 1987 quip that “You can see the computer age everywhere but in the productivity statistics”. Second, most of the gains went to the users, not the producers of the new technologies. Indeed, productivity growth was higher in Australia than in the US over the late 1990s, as the then RBA Governor Ian Macfarlane pointed out at the time.
As that wave of technological innovation crested and matured, productivity growth slowed globally. The gains from adoption had been reaped. Moreover, the new technologies introduced in the first couple of decades of this century – specifically social media – were seemingly more likely to distract us than make us more productive. They are also more prone to the network effects that direct the gains to the platform operator rather than the users, limiting the boost to productivity.
Even when the earlier generation of innovations that culminated in what we now know as AI were introduced – machine learning models and data science techniques – the productivity gains were hard to see. Part of the issue is that that generation of technologies was essentially an exercise in combining people with PhDs in physics or maths with computers to generate a machine-learning model to replace, say, an insurance adjuster with a high-school or undergraduate education. A technology that requires rarer skills than the ones it seeks to replace is rarely successful in gaining broad adoption.
It was therefore perhaps not surprising that measured productivity growth slowed around the world starting from the early 2000s. The economics profession was worried about the possibility of ‘secular stagnation’, and some believed that “diminishing returns in the digital revolution” were causing the slowdown in productivity growth, at least in the US. (There were other, demand-side, causes proposed as well. But the lack of technological innovation did seem to be a large part of the story.)
Roll forward to the last couple of years and we are now starting to see the next generation of machine learning applications – LLMs and other approaches based on transformer architectures. These are more accessible to end-users than their predecessors and hold out more of an opportunity to remodel business models and processes to take advantage of this. For this reason, most observers, including the IMF, expect at least some productivity boost from this new technology wave. Like the previous technology wave from PCs and the internet, this boost could take a while to come through. It might not be as slow as that previous wave, though, given that internet distribution itself speeds adoption.
The RBA’s revised assumptions about trend growth in labour productivity, and so potential output growth, released in their August Statement on Monetary Policy and elaborated on in a recent speech by its chief economist, need to be seen in that context. Effectively, what the RBA has done is use a 20-year average of productivity growth as the trend to which actual labour productivity growth is assumed to converge over the next two years. A 20-year horizon for this average cuts out all of the 1990s productivity boom from the calculation: it is a pure ‘secular stagnation’ era average.
And that might well be the right assumption for the next couple of years. If it takes a few years for AI to boost productivity across the economy, then this will not be clearly evident until the period beyond the RBA’s current forecast horizon. But for it to still be the trend rate of labour productivity growth much beyond that, one must believe one of two things. Either one must believe that AI will do nothing to boost overall productivity growth – in which case, sell your Nvidia stock now! (This is of course not investment advice, simply the logical implication of that belief.) Or, one must believe that AI will boost productivity growth elsewhere, but for some reason not in Australia. This seems like a stretch, or at least an argument that needs to be justified explicitly.
The RBA has assured the public that it does not assume that the slower productivity growth assumption applying to the next two years will remain the case over subsequent years, and that it will update its view as the data evolve. Observers are entitled to ask how the RBA proposes to do this, noting the backward-looking nature of many of its models for estimating these ‘star’ variables, and whether it will be nimble enough in updating its view. We recall the decline in estimated rates of feasible unemployment (the NAIRU) over the 2010s in a range of advanced economies and reflect that these are hard calls to make in real time.
An implication of the RBA’s view on growth in productivity, and so potential output, is that for the time being at least, signs of stronger GDP growth will by default be interpreted as demand outstripping supply, and so a reason to keep policy a bit tight. Such an interpretation will be vulnerable to any pick-up in productivity stemming from AI or other technological or structural shifts. It will also be vulnerable to the RBA’s apparent assumption that the five-decade upward trend in labour force participation – and so labour supply – is at an end. As Westpac Economics colleague Ryan Wells and I noted last month, we think the trend still has some way to run in Australia.
Given the difficulties of assessing things like potential output growth, a more robust way to judge whether output is running faster than capacity is to watch inflation. Likewise, a pick-up in wages growth is likely to be more of a sign of a tight labour market than whether the rate of wages growth exceeds some rule of thumb based on an assumed rate of trend productivity growth. Without these price-based signals, it is hard for policymakers to be confident that a shift in a quantity-based measure like output is a sign of a shift around trend, or a shift in the trend.
Indeed, while we wouldn’t want to make too much of one month’s figures, this week’s labour market data was entirely consistent with our medium-term view that there is a bit more trend growth in labour supply available than some observers assume. As has so often been the case over the past couple of years, it will again all come down to the quarterly underlying inflation print later this month. And while that print will be a high one, this might not continue in following quarters. The RBA’s guiding assumptions make it more prone to productivity pessimism and structural hawkishness that could be repeatedly corrected by lower-than-expected inflation outcomes. It’s a heck of a way to manage the economy.
Cliff Notes: Partial Data Challenges
Key insights from the week that was.
In Australia, the September Labour Force Survey was one of two key data releases in the run-up to the RBA’s November decision. The release points to a bit more labour market slack building during the month. Employment printed in line with Westpac’s forecast (+15k), extending an easing in the growth pace amid an underlying slowdown in ‘care economy’ jobs. However, this gain only partially made use of the increase in the size of the labour force as the participation rate lifted back up to its year-average of 67.0%. The unemployment rate consequently jumped from 4.3% to 4.5%, the highest rate since just after the ‘delta’ outbreak of 2021.
Compared to the RBA’s August forecasts, employment is already on a weaker footing, and the unemployment rate now looks likely to overshoot their projections. This lends weight to our view that there is still a good chance the RBA will cut rates in November – a view supported by the swift reaction in market pricing, the chance of a 25bp November cut lifting from 40% to 78%. That said, the Q3 CPI (due October 29) will be the ultimate determinant of the November decision.
In the meantime, the latest NAB business survey points to an ongoing recovery in economic growth – business conditions holding steady in September around the long-term average, allowing confidence to start moving up from ‘neutral’ to ‘cautiously optimistic’. Our latest Market Outlook delves into our updated economic growth forecasts and the tension with a softening labour market – ‘jobless growth’ being a key risk as aggregate activity becomes less reliant on the job-intensive care economy.
In the US, with almost all official data indefinitely delayed due to the government shutdown, the Fed’s Beige Book was the key release. Contacts across the districts reported that overall economic activity was perceived to have "changed little on balance since the previous report" but that "consumer spending, particularly on retail goods, inched down in recent weeks". "The outlook for future economic growth varied by District and sector. Sentiment reportedly improved in a few Districts, with some contacts expecting an uptick in demand over the next 6 to 12 months. However, many others continued to expect elevated uncertainty to weigh down activity."
On the labour market, "Employment levels were [viewed as] largely stable in recent weeks", though in "most" districts, more employers "reported lowering head counts through layoffs and attrition, with contacts citing weaker demand, elevated economic uncertainty, and, in some cases, increased investment in artificial intelligence technologies".
Regarding inflation: contacts observed the impact of tariffs on input costs alongside a rise in services like “insurance, health care, and technology solutions”; that said, the degree to which these costs were passed onto consumers differed by district and product sold. The latest threat from President Trump of a further 100% tariff on Chinese goods from 1 November and the introduction of additional US port fees for China-linked ships (and we might add China’s in kind retaliation against US-linked ships) highlights that tariff uncertainties are likely to linger for US inflation for an extended period – a reality the FOMC will need to factor in.
For China meanwhile, as the press headlines repeated US / China trade relations fact and rumour, data remained consistent with existing trends, consumer prices falling 0.3%yr and producer prices down 2.3%yr in September. In recent months, price momentum has struggled to pick up despite authorities’ “anti-involution” policies – aimed at curbing overproduction. This development not surprising; it will take time for the policies and associated rhetoric to impact the economy. At the consumer level, if inflation is to return sustainably to 2-3%yr, there is also need for fiscal support targeting household demand. Detail on the next wave of support and its likely timing should come next week as China’s next Five-Year plan to 2030 is released. Looking further ahead, key themes and forecasts for China, the rest of Asia, Europe and the US can be found in our October Market Outlook.
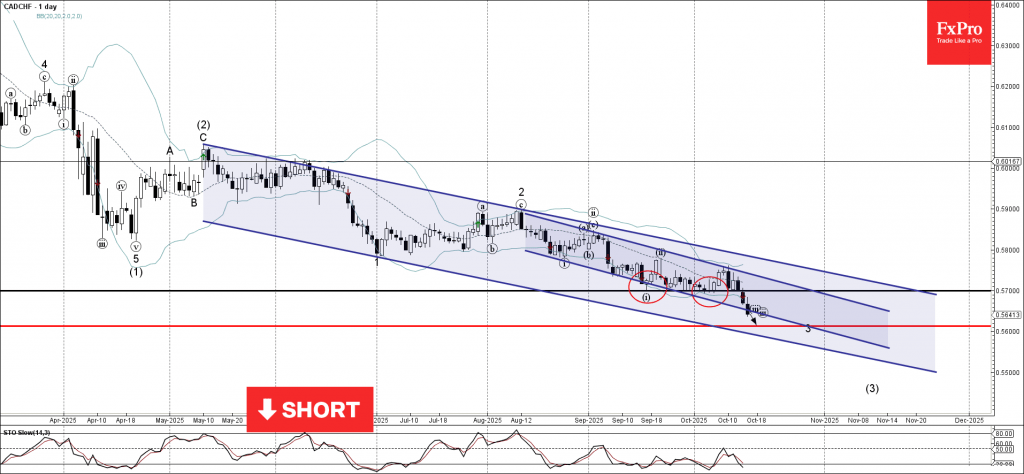
CADCHF Wave Analysis
CADCHF: ⬇️ Sell
- CADCHF broke support level 0.5700
- Likely to fall to support level 0.5600
CADCHF currency pair recently broke below the pivotal support level 0.5700 (which has been reversing the pair from the middle of September).
The breakout of the support level 0.5700 accelerated the active downward impulse wave iii of the impulse of the intermediate impulse wave (3) from May.
Given the clear daily downtrend, CADCHF currency pair can be expected to fall to the next strong support level 0.5600 (target for the completion of the active impulse wave 3).
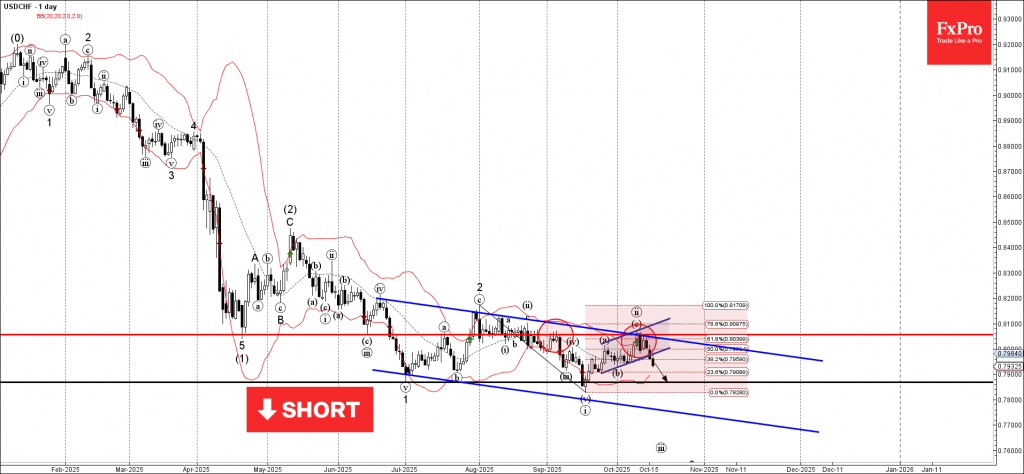
USDCHF Wave Analysis
USDCHF: ⬇️ Sell
- USDCHF reversed from resistance zone
- Likely to fall to support level 0.7865
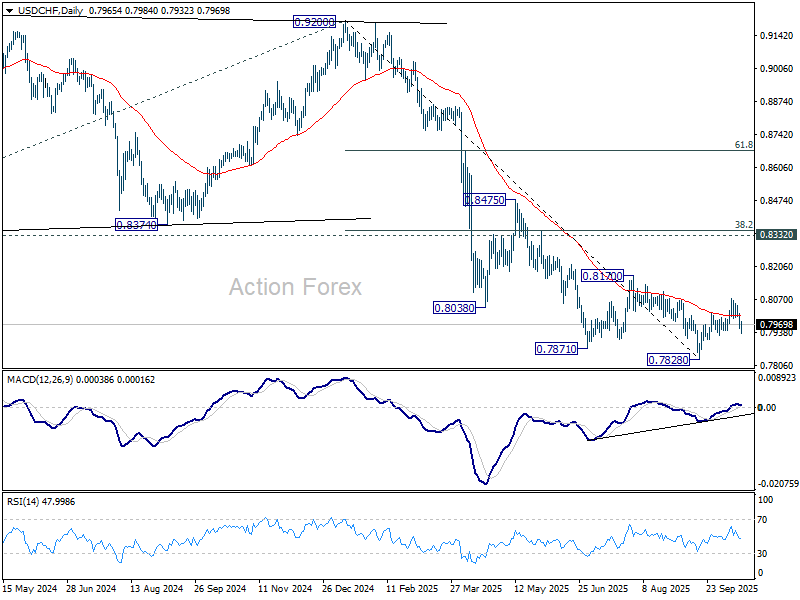
USDCHF currency pair recently reversed from the resistance zone between the pivotal resistance level 0.8055 (which has been reversing the price from August) and the upper daily Bollinger Band.
This resistance zone was further strengthened by the resistance trendline of the daily down channel from June and by the 61.8% Fibonacci correction of the downward impulse from July.
Given the clear daily downtrend, USDCHF currency pair can be expected to fall to the next support level 0.7865 (which reversed the price in June and September).
Sunset Market Commentary
Markets
The interesting market moves took place in the US money market corner. The SOFR fixing on Wednesday (applicable for today) shot up to 4.29% compared to the 4.19% the day before. This overnight interbank rate in normal conditions fluctuates neatly within the Fed’s policy target range of currently 4-4.25%. The overshoot is suggestive of funding pressures building. It could be a temporary deviation with markets struggling to digest this week’s UST coupons settling and (net) TBill supply but it bears following up to check whether structural issues are playing as well. In a broader perspective, the SOFR rate has been grinding higher since October 8’s low of 4.12%. and may have been one of the reasons why Fed chair Powell earlier this week announced that the central bank plans to end quantitative tightening in the coming months. Commercial bank reserves held with the Fed have recently dropped below the $3tn mark in a sign of liquidity being sucked out of the financial system. In 2019, when the Fed was doing QT on autopilot it caused a sudden liquidity crunch which the central bank is keen to avoid this time around. The SOFR back then surged to above 5% compared to the Fed’s 2-2.25% policy rate. Fed’s Waller said the amount of reserves then dropped below 8% of GDP and has suggested to keep it at around 10-11% instead – which is more or less where we are today.
Other markets are little changed. Both Treasury and Bund yields trade within wafer thin trading ranges of 1 to 3 bps. France’s OAT-swapspread holds steady after narrowing sharply yesterday in anticipation of Lecornu surviving today’s two censure motions. The one tabled by the far-left failed with 271 lawmakers backing it vs 289 needed to pass. For all but seven members of the Socialist Party, Lecornu’s costly concessions such as suspending the pension reform, sufficed. The motion tabled by Le Pen only got 144 votes in favour. A series of central bank policymakers hit the wires. Fed’s Waller called for a cautious removal of monetary restriction in 25 bps steps. Miran begged to differ and favours a 50 bps move, adding that he thinks 25 bps will be the outcome nonetheless. ECB’s Wunsch said the probability for another rate cut has come down and said services inflation still needs monitoring. Mann from the BoE voiced similar concerns, saying that the “domestic component” is the dominant inflation feature. Gilts slightly outperform nonetheless. Industrial output data from the UK this morning beat expectations at the margin but was offset by a minor miss in stalling service sector activity. The pound doesn’t care much though and is even one of the better performers today. EUR/GBP eases to 0.867 & cable (GBP/USD) tops the 1.34(5) barrier. Stock markets grind higher in Europe (EuroStoxx50 +0.5%) and the US (+0.2-0.7%), with decent to strong earnings so far supporting the equity market.
News & Views
Czech producer prices fell by 0.4% M/M in September whereas consensus only expected a 0.1% slowdown. Producer price deflation accelerated on an annual level from -0.8% Y/Y to -1% Y/Y with prices now dropping Y/Y for an 8th consecutive month. Details showed monthly price declines for agricultural producers (-1.9% M/M; +7.1% Y/Y) and industrial producers (-0.4% M/M). The latter are also down Y/Y (-1%). Construction work prices rose by 0.7% M/M and 3% Y/Y. Domestic service producer prices in the business sphere proved most sticky, adding 1.4% M/M to be up 4.5% Y/Y. EUR/CZK is going nowhere at 24.29. Recent political elections didn’t really cause a setback for CZK which remains firmly supported by CNB’s anti-inflationary rhetoric and steady rate path ahead.
German Chancellor Merz addressed national parliament today, previewing next week’s EU Summit. He backed progress on a European Capital Union saying that European firms need a sufficiently broad and deep European capital market so they can finance themselves better and faster. One way of doing so is creating a pan-European stock exchange to help firm deal with competition from the US and Asia. Earlier, Merz already gave up long-standing reluctance to transfer financial supervision to the European Securities and Markets Authority. Apart from the economic and financial strategy, EU leaders will also focus on migration, security & energy and the implementation of an AI act.
Silver (XAG/USD) Technical Outlook: Silver Price Consolidates Ahead of Next Move. Where to Next?
Silver prices continue to soar to unprecedented highs with questions being asked about the reason for the rally.
Well in all honesty there have been a host of reasons cited as a driving force, all of them may be true to some degree. The most popular ones which have been discussed at length include rate cut expectations from the Federal Reserve, the ongoing supply/demand deficit in physical silver, and of course the price of silver being cheap in comparison to Gold.
One of the reasons which has really come to the fore recently is the shortage of physical silver which has led to a big premium for physical silver as well. Recent, widely reported incidents have exposed some key factors regarding silver, particularly due to physical shortages that have made the metal difficult to acquire. This is becoming a global problem.
This shortage is especially felt in India, the world's biggest consumer, which has seen its imports drop by a significant 42% this year, even as demand from both investors and industrial users (like those making solar panels and electronics) has surged.
The problem is amplified globally because most silver is produced as a side product of mining other metals, making it hard to quickly increase supply when demand spikes.
As a result, dealers everywhere are struggling to find the metal, and this scarcity is driving up prices in the supply chain. This physical shortage is not limited to India; countries including China, Turkey, and Australia are also currently facing a scarcity of silver.
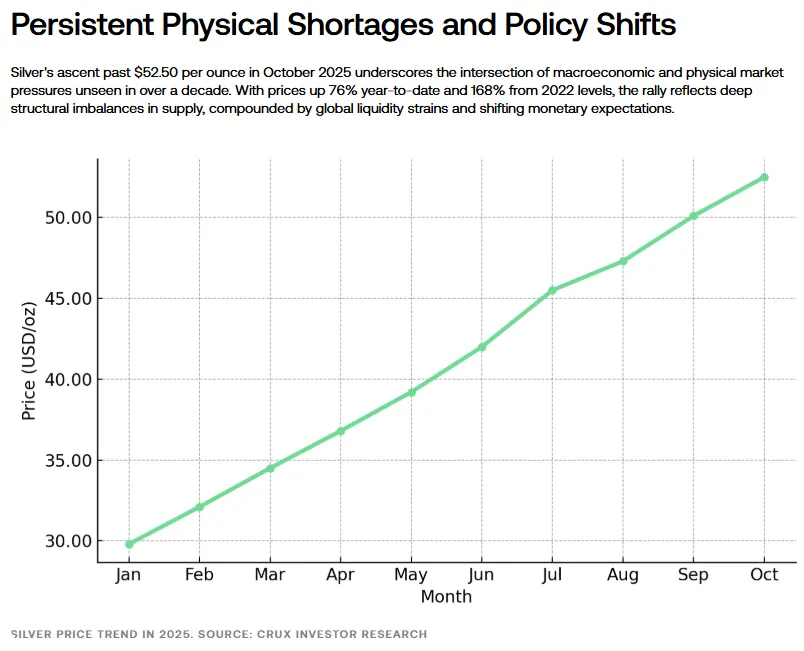
Source: Crux Investor
As the physical silver shortage continues, the amount of money held in silver Exchange Traded Funds (ETFs) and futures contracts has surged. Large investment funds are now viewing silver as a "higher beta" version of an inflation hedge, meaning it's more volatile than gold, but offers the chance for much larger gains when the market moves up.
This structural shift is driven by the fact that silver offers dual benefits that gold does not.:
- Monetary Asset: Like gold, it protects against the long-term devaluation of traditional paper money (monetary debasement).
- Industrial Asset: It acts as a powerful bet on industrial growth and the global "energy transition" theme, as silver is a crucial, irreplaceable material used in fast-growing sectors like solar panels, electric vehicles, and high-tech electronics.
This unique combination makes silver attractive to both traditional commodity investors looking for a hedge and other market participants focused on clean energy trends.
Either way, right now these factors have created the perfect cocktail for Silver prices.
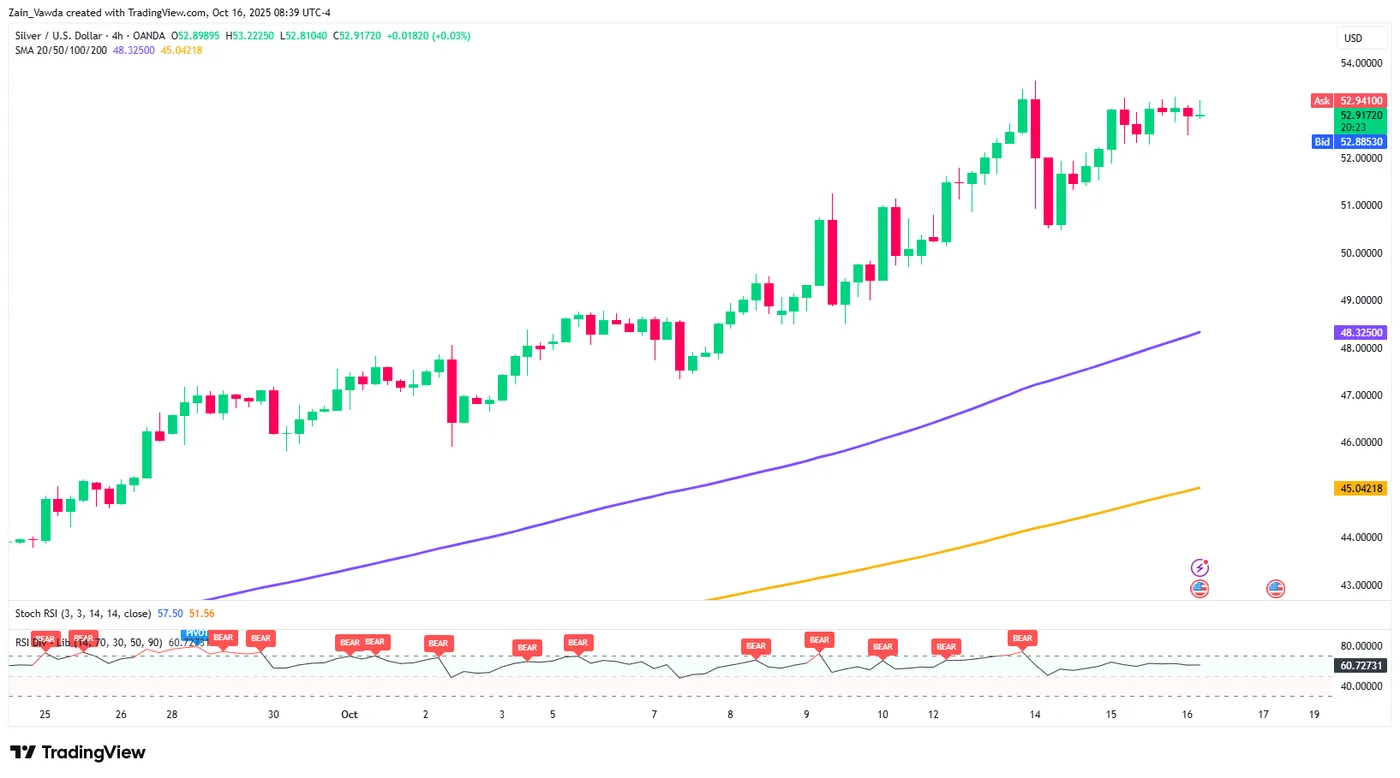
Technical Analysis - Silver (XAG/USD)
From a technical standpoint, Silver has settled into a period of consolidation since the early hours of Wednesday morning.
Price is just shy of the recent high print around the 53.62/oz handle with the period-14 RSI above the 50 level. This is a nod to how strong the bullish momentum behind the Silver move is.
Similar to Gold, picking a top at this stage appears counterproductive. However, for day traders opportunities may yet present itself.
Silver (XAG/USD) H4 Chart, October 16, 2025
Source: TradingView.com (click to enlarge)
Dropping down to a H1 chart and price has been consolidating in the red/pink block since yesterday.
A candle close outside this block could lead to a move in that direction.
Obviously the longer price remains in the block the more aggressive the breakout may be.
A break to the downside may find support at the 100-day MA resting at 51.84 before the October 14 swing low at 50.59 with the 200-day MA resting below that at the 50.28 handle.
A break to the upside may find some resistance at the YTD high at 53.62 before the psychological 55.00 handle comes into focus.
Silver (XAG/USD) H1 Chart, October 16, 2025
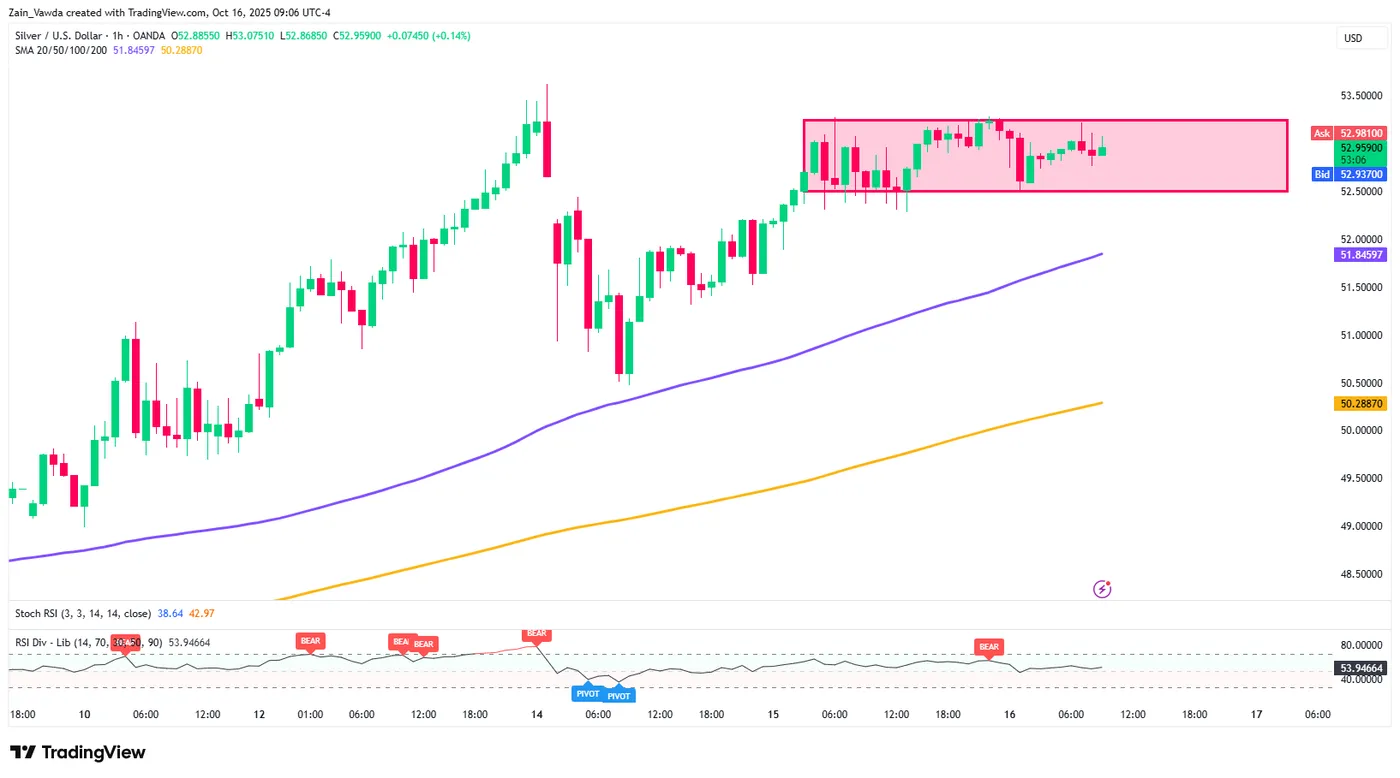
Source: TradingView.com (click to enlarge)
Client Sentiment Data - USD/CAD
Looking at OANDA client sentiment data and market participants are Long on XAG/USD with 64% of traders net-long. I prefer to take a contrarian view toward crowd sentiment and thus the fact that so many traders are Long means XAG/USD prices could fall in the near-term.
EUR/USD Mid-Day Outlook
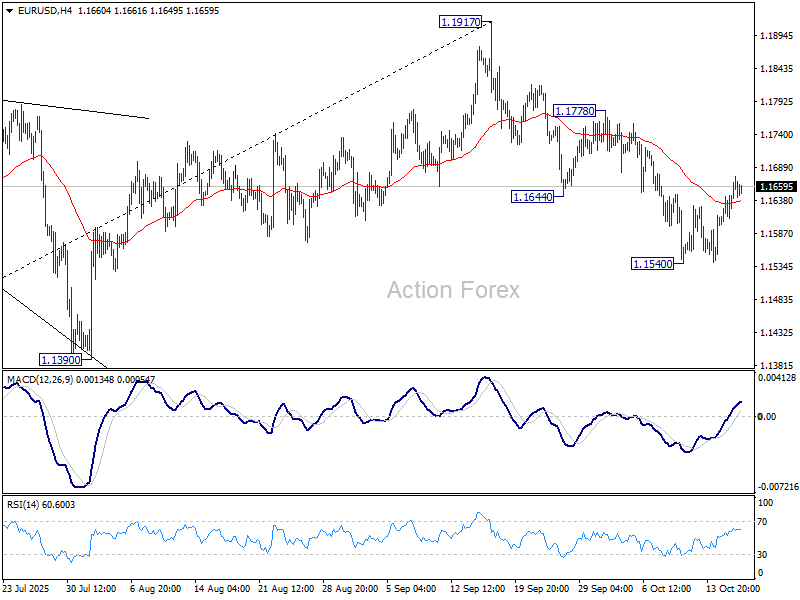
Daily Pivots: (S1) 1.1617; (P) 1.1632; (R1) 1.1663; More…
Intraday bias in EUR/USD remains neutral and more consolidations could be seen above 1.1540. But further decline is still expected with 1.1778 resistance intact. On the downside, break of 1.1540 will resume the fall from 1.1917 to 1.1390 , or further to 38.2% retracement of 1.0176 to 1.1917 at 1.1252.
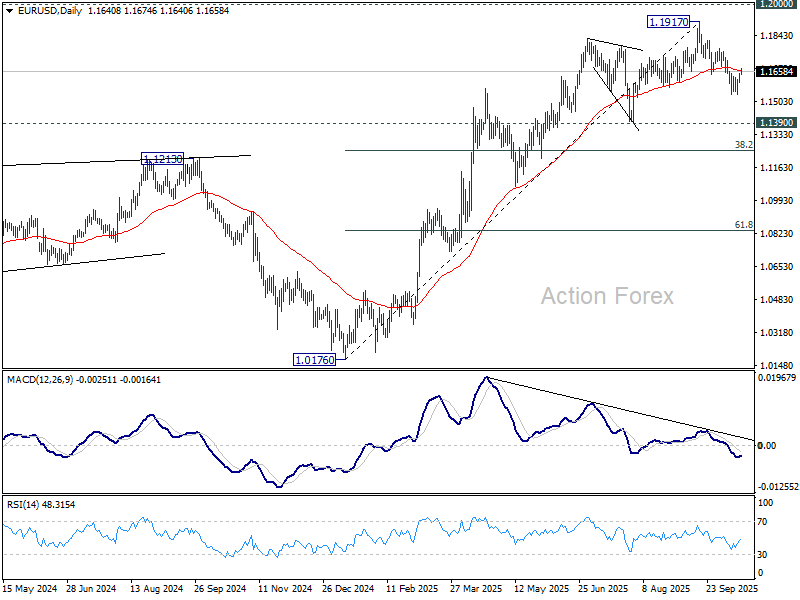
In the bigger picture, considering bearish divergence condition in D MACD, a medium term top is likely in place at 1.1917, just ahead of 1.2 key psychological level. As long as 55 W EMA (now at 1.1274) holds, the up trend from 0.9534 (2022 low) is still extended to continue. Decisive break of 1.2000 will carry larger bullish implications. However, sustained trading below 55 W EMA will argue that rise from 0.9534 has completed as a three wave corrective bounce, and keep outlook bearish.
USD/CHF Mid-Day Outlook
Daily Pivots: (S1) 0.7944; (P) 0.7980; (R1) 0.8003; More…
Intraday bias in USD/CHF stays mildly on the downside for the moment. Rebound from 0.7828 could have completed with three waves up to 0.8075. Further fall would be seen for retesting 0.7828 low. On the upside, above 0.8010 minor resistance will turn intraday bias neutral again first. Overall, price actions from 0.7828 are seen as a correction to fall from 0.9200 that could still extend for a while.
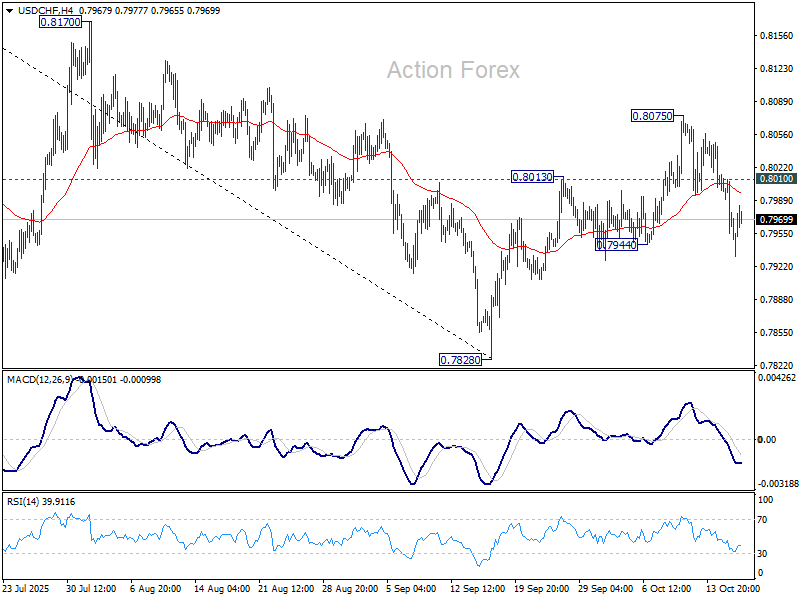
In the bigger picture, long term down trend from 1.0342 (2017 high) is still in progress. Next target is 100% projection of 1.0146 (2022 high) to 0.8332 from 0.9200 at 0.7382. In any case, outlook will stay bearish as long as 0.8332 support turned resistance holds (2023 low).
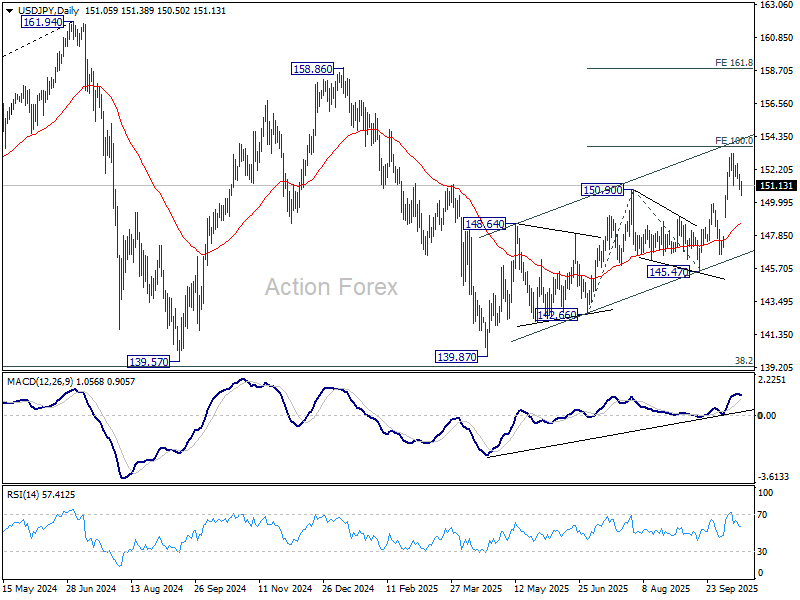
USD/JPY Mid-Day Outlook
Daily Pivots: (S1) 150.68; (P) 151.28; (R1) 151.66; More...
No change in USD/JPY's outlook as consolidations continue below 153.25. Intraday bias stays neutral. Downside should be contained by 149.95 resistance turned support. Break of 153.26 will target 100% projection of 142.66 to 150.90 from 145.47 at 153.71. Firm break there will pave the way to 161.8% projection at 158.80. However, decisive break of 149.95 will bring deeper pullback to 55 D EMA (now at 148.58) instead.
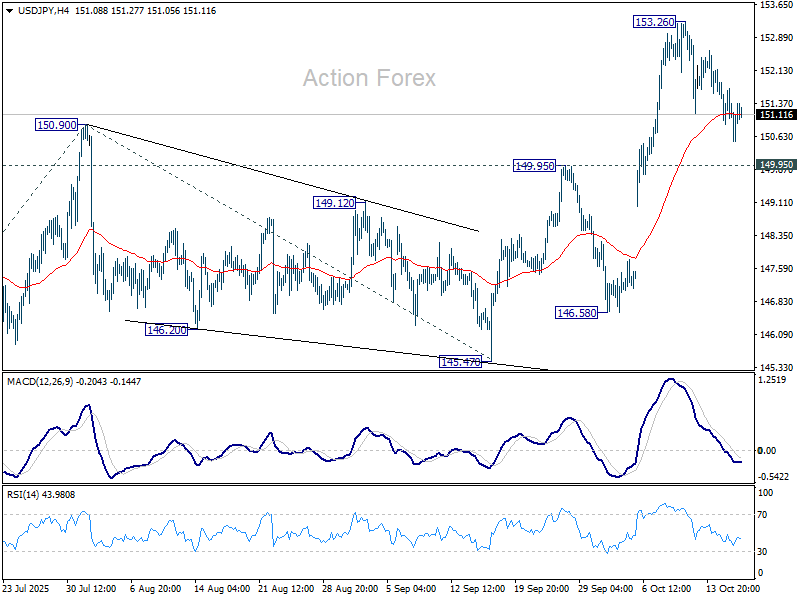
In the bigger picture, current development suggests that corrective pattern from 161.94 (2024 high) has completed with three waves at 139.87. Larger up trend from 102.58 (2021 low) could be ready to resume through 161.94 high. On the downside, break of 145.47 support will dampen this bullish view and extend the corrective pattern with another falling leg.