
Sample Category Title
USD/CAD Daily Outlook
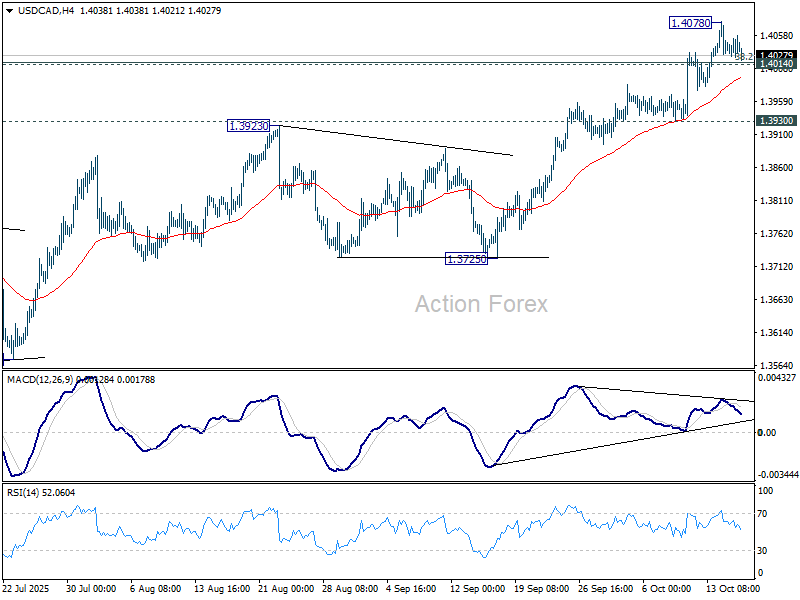
Daily Pivots: (S1) 1.4026; (P) 1.4043; (R1) 1.4059; More...
USD/CAD's rally lost momentum after hitting 1.4078 and intraday bias is turned neutral first. Some consolidations could be seen but further rally is expected as long as 1.3930 support holds. Sustained trading above 1.4014/7 will suggest that USD/CAD is already reversing the whole fall from 1.4719, and target 61.8% retracement at 1.4312. However, break of 1.3930 support will indicate short term topping, and turn bias back to the downside for 1.3725 instead.
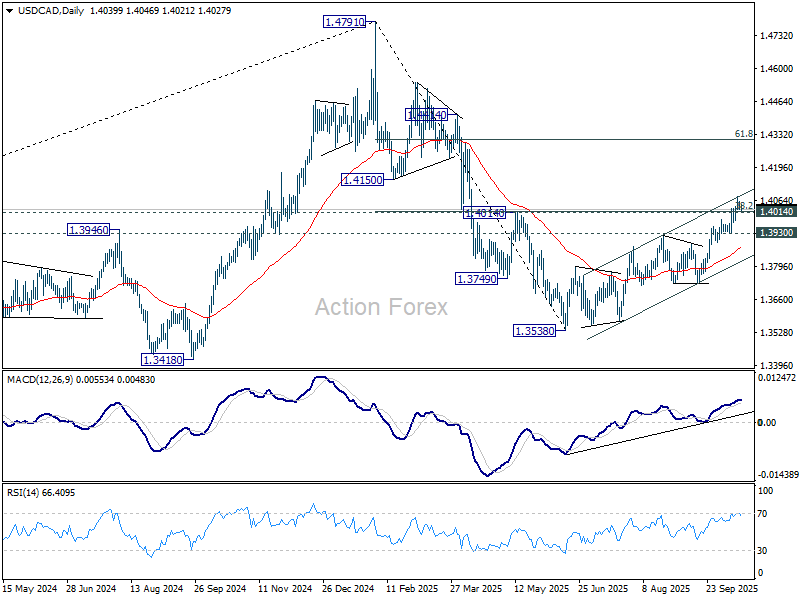
In the bigger picture, price actions from 1.4791 medium term top could either be a correction to rise from 1.2005 (2021 low), or trend reversal. In either case, further decline is expected as long as 1.4014 cluster resistance (38.2% retracement of 1.4791 to 1.3538 at 1.4017) holds. However sustained trading above 1.4014 will suggest that it's more likely just a correction, and the larger up trend would be in favor to resume through 1.4791 at a later stage.
EUR/CHF Daily Outlook
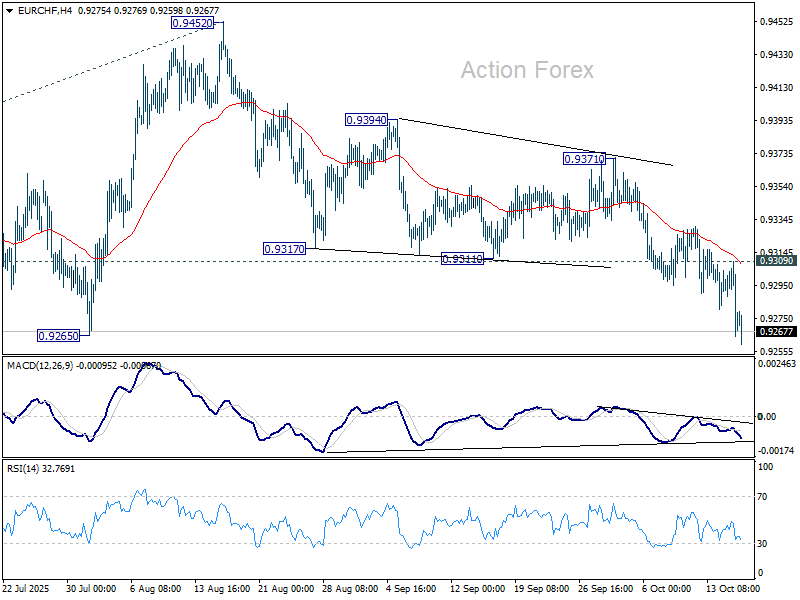
Daily Pivots: (S1) 0.9260; (P) 0.9286; (R1) 0.9305; More...
EUR/CHF's decline from 0.9452 continues and intraday bias stays on the downside. Decisive break of 0.9265 support should confirm that whole corrective pattern from 0.9218 has completed with three waves to 0.9452. Deeper decline should be send to 0.9204/18 support zone. Firm break there will bring larger down trend resumption. On the upside, above 0.9309 minor resistance will turn intraday bias neutral first.
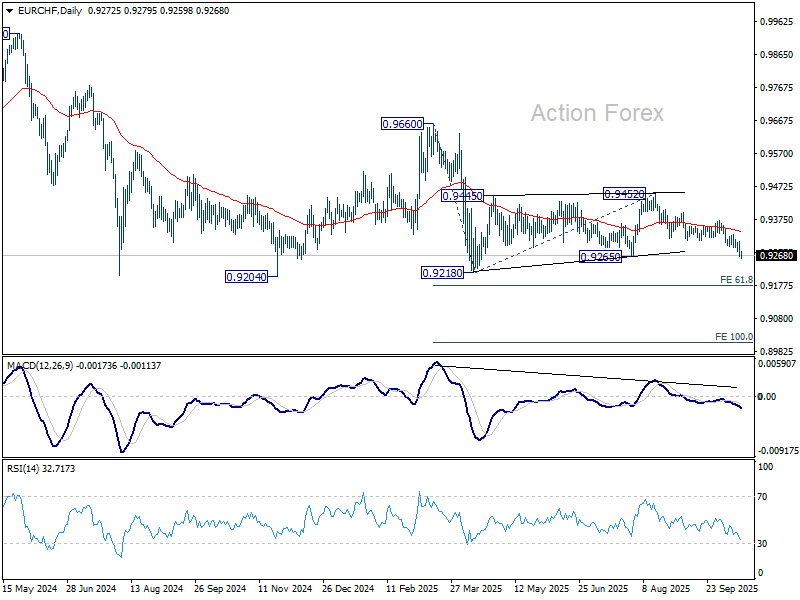
In the bigger picture, the down trend from 0.9204 (2018 high) might still be in progress considering that EUR/CHF is staying well inside the long term falling channel. Bearishness is reaffirmed by rejection at 55 W EMA (now at 0.9405). Firm break of 0.9204 will confirm down trend resumption. On the upside, break of 0.9452 resistance is needed to be the first sign of bullish reversal, and break of 0.9660 is needed to confirm.
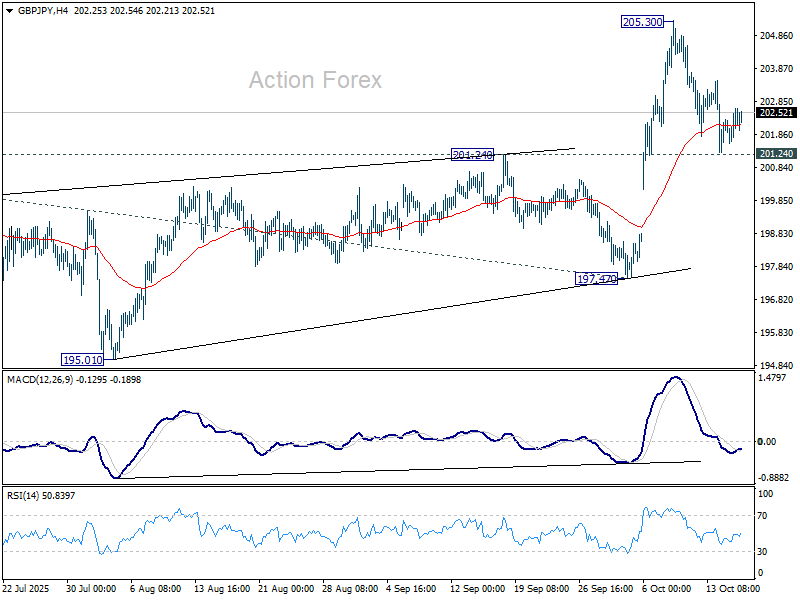
GBP/JPY Daily Outlook
Daily Pivots: (S1) 201.80; (P) 202.26; (R1) 202.93; More...
Intraday bias in GBP/JPY stays neutral and more consolidations could be seen below 205.30. With 201.24 resistance turned support intact, further rally is still in favor. Break of 205.30 will target 61.8% projection of 184.35 to 199.96 from 197.47 at 207.11. However, firm break of 201.24 will confirm short term topping and bring deeper fall back to 197.47 support instead.
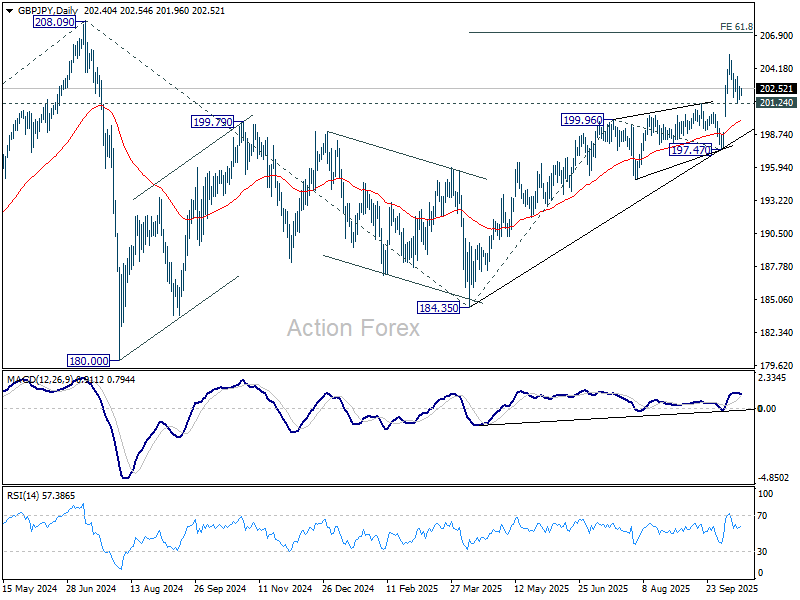
In the bigger picture, price actions from 208.09 (2024 high) are seen as a corrective pattern which might have completed at 184.35. Firm break of 208.09 high will resume the up trend from 123.94 (2020 low). Next target is 61.8% projection of 148.93 to 208.09 from 184.35 at 220.90. However, firm break of 197.47 will dampen this view and could extend the corrective pattern with another fall.
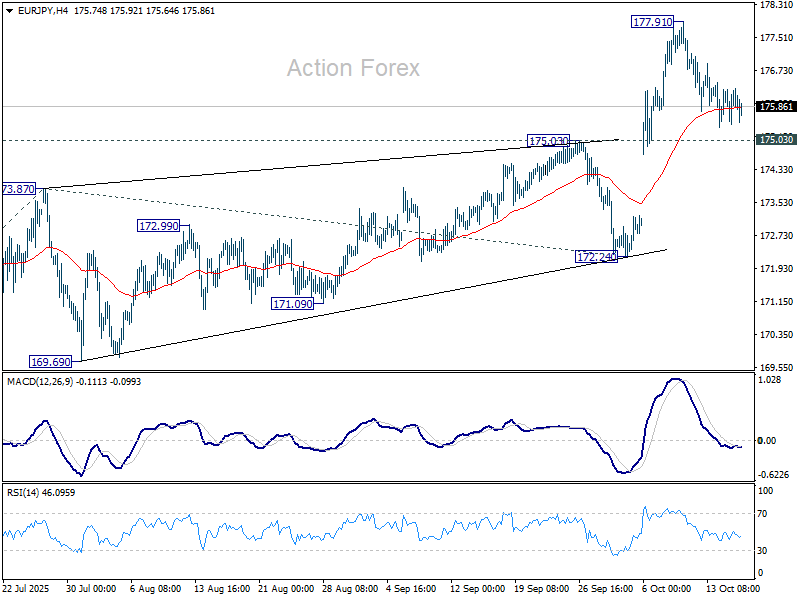
EUR/JPY Daily Outlook
Daily Pivots: (S1) 175.49; (P) 175.90; (R1) 176.36; More...
Intraday bias in EUR/JPY stays neutral and more consolidations could be seen below 177.91. Further rise is expected as long as 175.03 resistance turned support holds. On the upside, break of 177.91 will target 61.8% projection of 161.06 to 173.87 from 172.24 at 180.15 next. However, firm break of 175.03 will confirm short term topping and bring deeper fall back to 172.24 support.
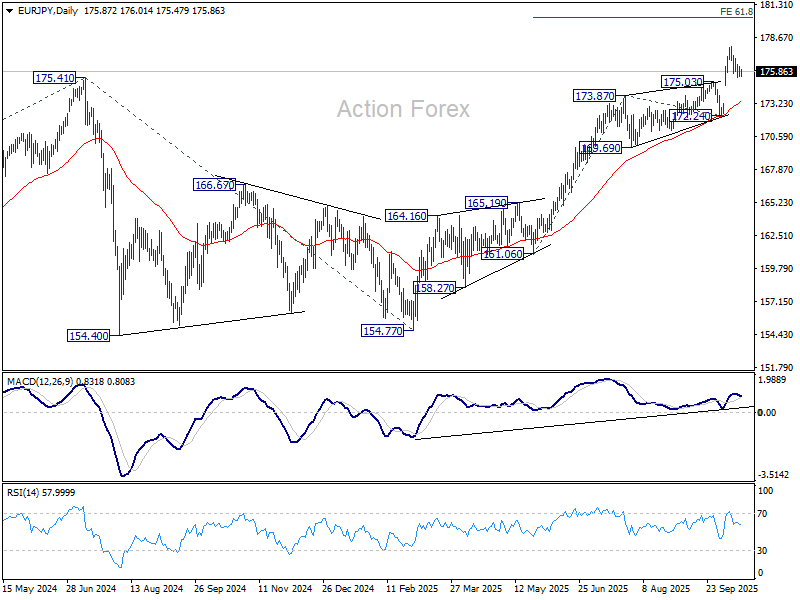
In the bigger picture, up trend from 114.42 (2020 low) is in progress and should target 61.8% projection of 124.37 to 175.41 from 154.77 at 186.31. Firm break of 172.24 support will suggests that it has turned into consolidations again. But still, outlook will continue to stay bullish as long as 55 W EMA (now at 167.16) holds, even in case of deep pullback.
EUR/GBP Daily Outlook
Daily Pivots: (S1) 0.8676; (P) 0.8698; (R1) 0.8713; More…
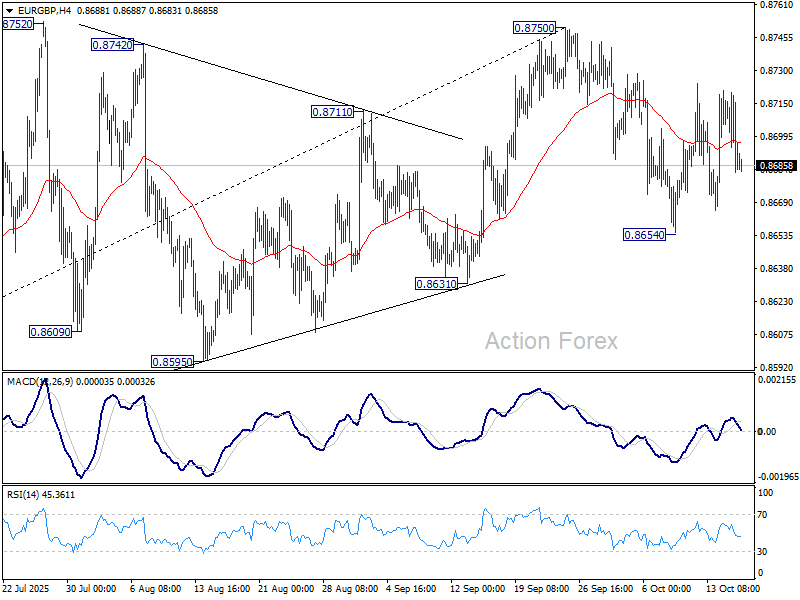
Intraday bias in EUR/GBP remains neutral and more sideway trading could be seen. On the upside, firm break of 0.8750 will resume larger rally towards 0.8867 fibonacci level. On the downside, break of 0.8654 will extend the fall from 0.8750 to 0.8631 support next.
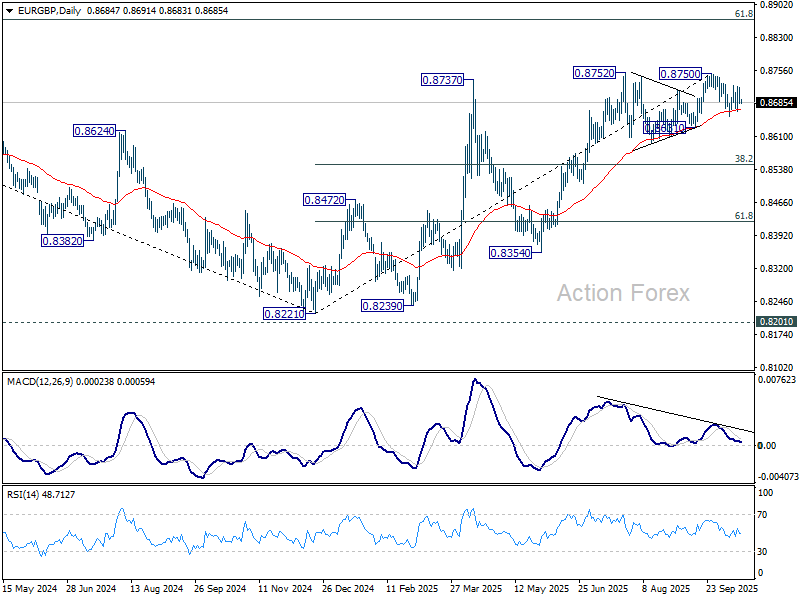
In the bigger picture, rise from 0.8221 medium term bottom is seen as a corrective move. While further rally cannot be ruled out, upside should be limited by 61.8% retracement of 0.9267 to 0.8221 at 0.8867. Considering bearish divergence condition in D MACD, firm break of 0.8631 support will be the first sign that this corrective bounce has completed. Sustained trading below 55 W EMA (now at 0.8550) will confirm, and bring retest of 0.8221 low.
EUR/AUD Daily Outlook
Daily Pivots: (S1) 1.7828; (P) 1.7879; (R1) 1.7935; More...
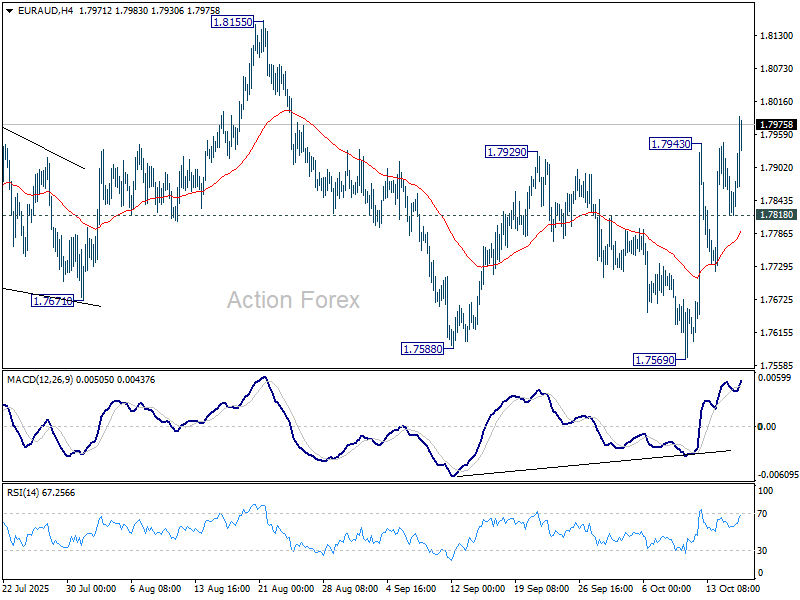
EUR/AUD's rebound from 1.7569 resumed by breaking 1.7943 and intraday bias is back on the upside. Outlook is unchanged that fall from 1.8155 could have completed at 1.7569 already. Further rise should be seen to 1.8155 resistance. Firm break there will argue that whole corrective pattern from 1.8554 has also completed and bring retest of this high. On the downside, below 1.7818 support will mix up the outlook and turn intraday bias neutral again.
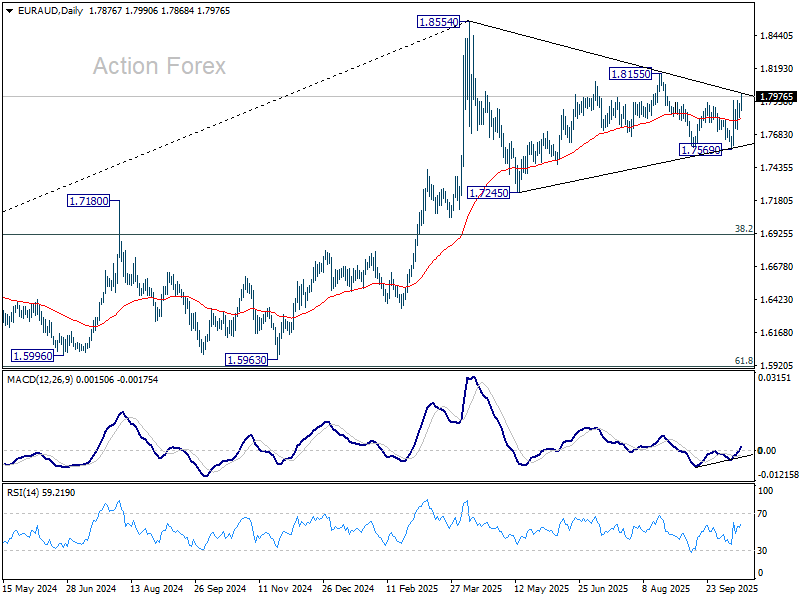
In the bigger picture, price actions from 1.8554 medium term top are seen as a corrective pattern. Deeper fall could be seen as the pattern extends, but downside should be contained by 38.2% retracement of 1.4281 (2022 low) to 1.8554 at 1.6922 to bring rebound. Uptrend from 1.4281 is expected to resume at a later stage.
Aussie Sinks on Jobs Miss as Traders Revive RBA November Cut Bets
Australian Dollar fell sharply after a soft labor market report reignited expectations that the RBA may resume rate cuts soon. September’s data showed unemployment rising to 4.5%, its highest since 2021. The figures surprised policymakers and traders alike, as the Bank’s latest projections did not even envision unemployment climbing this high at any point over the next two years.
The RBA had previously acknowledged that some labor force softening was likely as higher rates filtered through the economy. But today’s release points to a sharper slowdown that could test the central bank’s confidence in holding steady. As a result, speculation has intensified that the Bank’s easing cycle is not yet over, despite earlier suggestions that it may have paused for assessment.
Nevertheless, markets are still divided on timing: some see a November move as increasingly plausible, while others believe policymakers will prefer to wait until 2026 to gather more evidence. Still, the hurdle for a November cut is now materially lower, especially if the trimmed mean CPI due October 29 holds steady near 2.7%. A combination of higher unemployment and stable core inflation could give the RBA enough cover to reduce rates next month without risking credibility on its inflation mandate.
Meanwhile, global risk sentiment steadied somewhat after U.S. officials struck a more conciliatory tone on trade. U.S. Trade Representative Jamieson Greer described China’s new rare earth export rules as a “global supply-chain power grab,” but emphasized that both sides have yet to enact their latest measures. He said Washington expects China will ultimately refrain from implementation, allowing conditions to revert to pre-dispute levels.
Treasury Secretary Scott Bessent echoed that message, saying the U.S. remains “open to discussion” and would prefer to avoid escalation, though it retains options should Beijing proceed. Bessent warned that China’s actions highlight the risk of global dependence on its supply chains but added, “I am optimistic this can be de-escalated.”
In the currency markets, Aussie is the day’s weakest performer so far, trailed by Dollar and Loonie. Kiwi led gains as supported by he rebound against Aussie, followed by Swiss Franc and Yen. The Pound and Euro in the middle, as traders await the upcoming UK GDP figures.
In Asia, at the time of writing, Nikkei is up 0.87%. Hong Kong HSI is up 0.18%. China Shanghai SSE is up 0.44%. Singapore Strait Times is down -0.34%. Japan 10-year yield is down -0.001 at 1.655. Overnight, DOW fell -0.04%. S&P 500 rose 0.40%. NASDAQ rose 0.66%. 10-year yield rose 0.024 to 4.460.
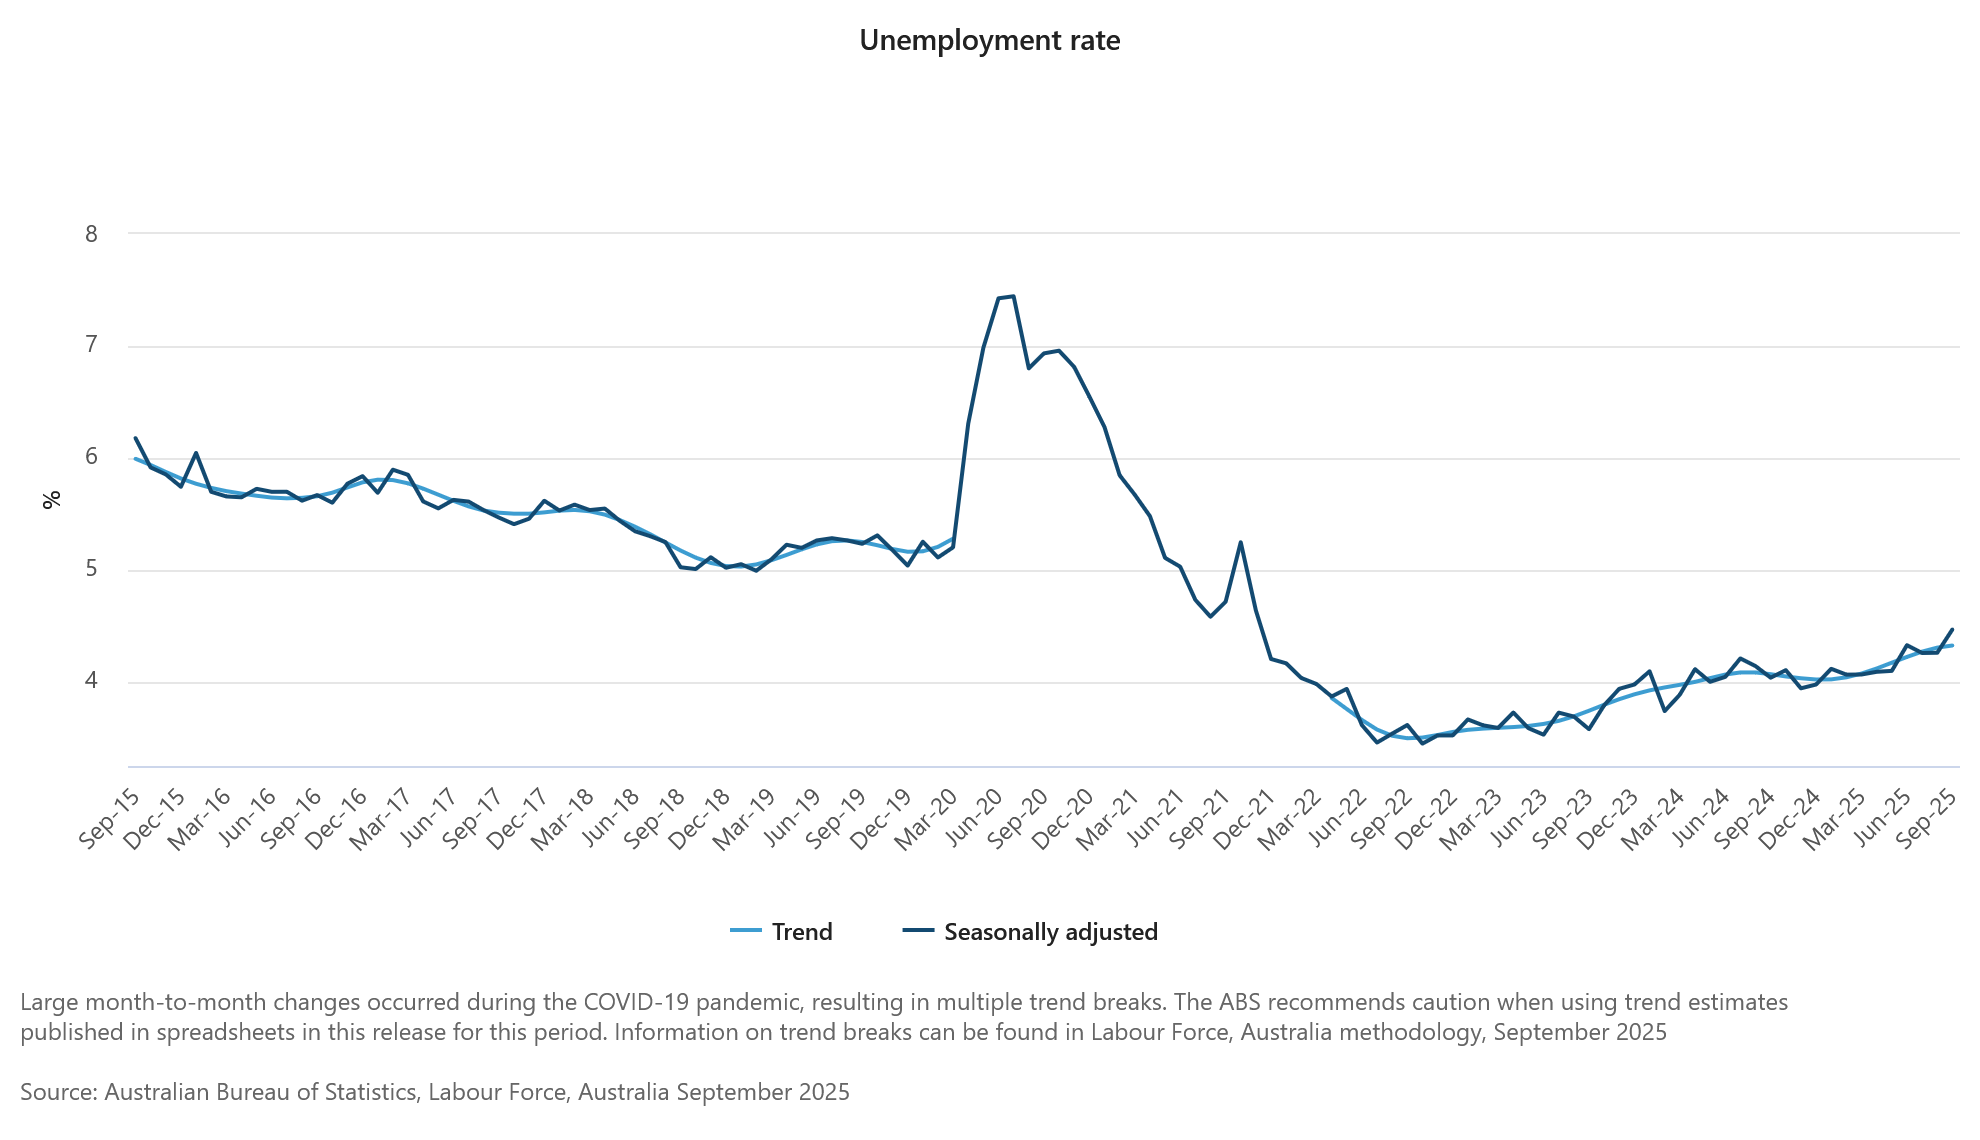
Australia jobless rate rises to 4.5%, highest since 2021
Australia’s labor market showed further signs of cooling in September as hiring momentum eased and the jobless rate climbed from 4.2% to 4.5%, the highest since November 2021. The unemployment rate figure exceeded expectations for 4.3%, driven by a 5.2% jump in the number of unemployed persons, equivalent to an increase of 33.9k people.
Total employment rose by 14.9k, undershooting forecasts of 20.0k. The breakdown showed full-time positions up 8.7k and part-time jobs rising 6.3k. Despite slower hiring, the participation rate edged up by 0.1% to 67.0%, indicating that more Australians are re-entering the labor force even as job creation moderates.
At the same time, monthly hours worked increased 0.5% mom, showing that those employed are still working longer hours on average, cushioning some of the weakness in headline employment figures.
RBA’s Bullock warns markets too optimistic, says trade war effects to linger for years
RBA Governor Michele Bullock cautioned today that financial markets may be underestimating global economic risks, warning that investors have taken a “Goldilocks view” of the outlook. Speaking at a forum, Bullock said markets appear to be “discounting the bad macroeconomic risks,” even as trade and geopolitical tensions threaten to slow global growth. She emphasized that the effects of the trade war will “play out over the next few years,” as tariffs are maintained or expanded by multiple countries, dampening trade and investment.
Bullock said the unpredictability of government responses to tariffs—rather than the general uncertainty surrounding them—was the biggest risk to investors’ confidence. “You just don’t know what might come out tomorrow morning,” she said, noting that sudden policy shifts could easily destabilize the currently “rosy” market outlook.
Addressing China’s economic struggles directly, Bullock pointed to the country’s ongoing deflationary pressures and excess industrial capacity, saying that “competing provinces” are cutting prices to maintain output, effectively exporting deflation to the rest of the world. She suggested that Beijing could do more to stimulate domestic consumption to rebalance its economy, adding that China’s “massive population” provides untapped potential demand if policies shift toward supporting households.
BoJ’s Tamura urges faster move toward neutral rate, warns against falling behind the curve
BoJ board member Naoki Tamura, one of the central bank’s most hawkish policymakers, who voted for a 25bps hike at the September meeting, reiterated his call for a faster shift toward a neutral policy stance. In a speech today, he said the current stance remains “far away from the neutral interest rate” the impact of prior rate hikes on the domestic economy has been “extremely limited.” He warned that keeping policy too loose for too long could invite future instability.
Tamura explained that his dissent was based on “risks to prices being skewed to the upside”. He now sees it as “more likely that the price stability target will be achieved earlier than expected,” helped by the recent Japan–U.S. tariff policy agreement, which he believes will support growth while keeping price momentum intact.
He acknowledged that U.S. tariff measures could weigh on the American economy, with spillover effects on Japan. But he emphasized “It is important from a risk management perspective for the Bank to move closer to a neutral monetary policy stance”.
Delaying further moves, he warned, could lead to Japan “falling behind the curve,” forcing abrupt rate hikes later that might “inflict significant damage” on the economy.
Fed’s Beige Book: Inflation pressures broaden as growth, hiring flat
The Fed’s Beige Book released Wednesday indicated that the U.S. economy has largely stalled, with "little change" in overall activity since the previous report. Out of the 12 regional districts, three reported slight to modest growth, five showed no change, and four signaled mild softening. While some respondents expressed cautious optimism for an uptick in demand within 6–12 months, others highlighted that persistent uncertainty and the government shutdown are weighing on business confidence and investment decisions.
Price pressures remain a key theme. The report said input costs rose at a “faster pace,” citing "tariff-induced" increases alongside higher expenses for insurance, healthcare, and technology services. While some of these cost increases have been passed on to consumers, competitive pressures are limiting full price transmission.
Labor market conditions showed no significant change, with employment levels "largely stable" and labor demand "generally muted". Wage growth continued at a "modest to moderate pace", but firms reported sharper increases in employer-sponsored healthcare costs, which have contributed to higher overall labor expenses.
EUR/AUD Daily Outlook
Daily Pivots: (S1) 1.7828; (P) 1.7879; (R1) 1.7935; More...
EUR/AUD's rebound from 1.7569 resumed by breaking 1.7943 and intraday bias is back on the upside. Outlook is unchanged that fall from 1.8155 could have completed at 1.7569 already. Further rise should be seen to 1.8155 resistance. Firm break there will argue that whole corrective pattern from 1.8554 has also completed and bring retest of this high. On the downside, below 1.7818 support will mix up the outlook and turn intraday bias neutral again.
In the bigger picture, price actions from 1.8554 medium term top are seen as a corrective pattern. Deeper fall could be seen as the pattern extends, but downside should be contained by 38.2% retracement of 1.4281 (2022 low) to 1.8554 at 1.6922 to bring rebound. Uptrend from 1.4281 is expected to resume at a later stage.
BoJ’s Tamura urges faster move toward neutral rate, warns against falling behind the curve
BoJ board member Naoki Tamura, one of the central bank’s most hawkish policymakers, who voted for a 25bps hike at the September meeting, reiterated his call for a faster shift toward a neutral policy stance. In a speech today, he said the current stance remains “far away from the neutral interest rate” the impact of prior rate hikes on the domestic economy has been “extremely limited.” He warned that keeping policy too loose for too long could invite future instability.
Tamura explained that his dissent was based on “risks to prices being skewed to the upside”. He now sees it as “more likely that the price stability target will be achieved earlier than expected,” helped by the recent Japan–U.S. tariff policy agreement, which he believes will support growth while keeping price momentum intact.
He acknowledged that U.S. tariff measures could weigh on the American economy, with spillover effects on Japan. But he emphasized “It is important from a risk management perspective for the Bank to move closer to a neutral monetary policy stance”.
Delaying further moves, he warned, could lead to Japan “falling behind the curve,” forcing abrupt rate hikes later that might “inflict significant damage” on the economy.
Australia jobless rate rises to 4.5%, highest since 2021
Australia’s labor market showed further signs of cooling in September as hiring momentum eased and the jobless rate climbed from 4.2% to 4.5%, the highest since November 2021. The unemployment rate figure exceeded expectations for 4.3%, driven by a 5.2% jump in the number of unemployed persons, equivalent to an increase of 33.9k people.
Total employment rose by 14.9k, undershooting forecasts of 20.0k. The breakdown showed full-time positions up 8.7k and part-time jobs rising 6.3k. Despite slower hiring, the participation rate edged up by 0.1% to 67.0%, indicating that more Australians are re-entering the labor force even as job creation moderates.
At the same time, monthly hours worked increased 0.5% mom, showing that those employed are still working longer hours on average, cushioning some of the weakness in headline employment figures.
RBA’s Bullock warns markets too optimistic, says trade war effects to linger for years
RBA Governor Michele Bullock cautioned today that financial markets may be underestimating global economic risks, warning that investors have taken a “Goldilocks view” of the outlook. Speaking at a forum, Bullock said markets appear to be “discounting the bad macroeconomic risks,” even as trade and geopolitical tensions threaten to slow global growth. She emphasized that the effects of the trade war will “play out over the next few years,” as tariffs are maintained or expanded by multiple countries, dampening trade and investment.
Bullock said the unpredictability of government responses to tariffs—rather than the general uncertainty surrounding them—was the biggest risk to investors’ confidence. “You just don’t know what might come out tomorrow morning,” she said, noting that sudden policy shifts could easily destabilize the currently “rosy” market outlook.
Addressing China’s economic struggles directly, Bullock pointed to the country’s ongoing deflationary pressures and excess industrial capacity, saying that “competing provinces” are cutting prices to maintain output, effectively exporting deflation to the rest of the world. She suggested that Beijing could do more to stimulate domestic consumption to rebalance its economy, adding that China’s “massive population” provides untapped potential demand if policies shift toward supporting households.