
Sample Category Title
Fed’s Beige Book: Inflation pressures broaden as growth, hiring flat
The Fed’s Beige Book released Wednesday indicated that the U.S. economy has largely stalled, with "little change" in overall activity since the previous report. Out of the 12 regional districts, three reported slight to modest growth, five showed no change, and four signaled mild softening. While some respondents expressed cautious optimism for an uptick in demand within 6–12 months, others highlighted that persistent uncertainty and the government shutdown are weighing on business confidence and investment decisions.
Price pressures remain a key theme. The report said input costs rose at a “faster pace,” citing "tariff-induced" increases alongside higher expenses for insurance, healthcare, and technology services. While some of these cost increases have been passed on to consumers, competitive pressures are limiting full price transmission.
Labor market conditions showed no significant change, with employment levels "largely stable" and labor demand "generally muted". Wage growth continued at a "modest to moderate pace", but firms reported sharper increases in employer-sponsored healthcare costs, which have contributed to higher overall labor expenses.
Gold (XAU/USD) Rallies to All-Time Highs of $4218 on Trade Tremors and Rate Cut Expectations – Potential Targets and...
Renewing all-time highs earlier today, around ~$4,218, gold (XAU/USD) has extended gains further so far in this week’s trading.
With 2025 representing the best yearly performance in the yellow metals’ history by some margin, traders are left with one burning question:
When will the current rally end?
Let’s break down some of the major macroeconomic themes at play within precious metal markets, alongside some technical analysis and price targets.
Gold (XAU/USD): Key takeaways 15/10/2025
- Breaking above $4,200 earlier today, gold now trades over 56% higher since the beginning of 2025, with an increase from $3,500 to $4,000 only taking thirty-six days.
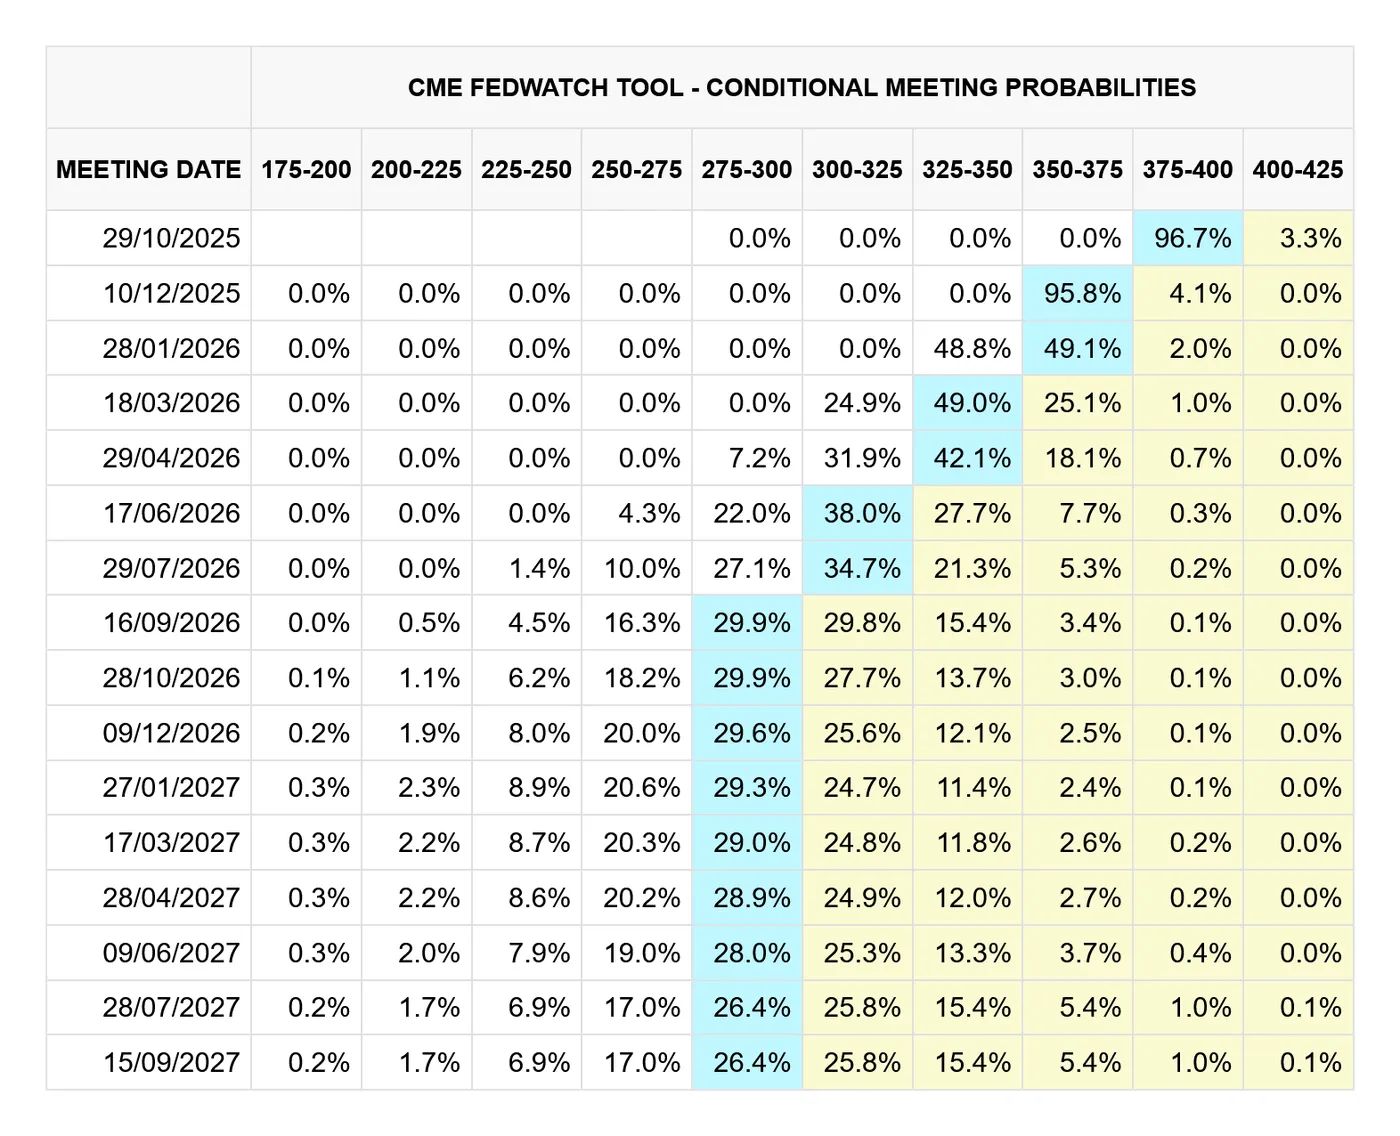
- Acting as the primary catalyst for recent upside, markets are increasingly sure of back-to-back Federal Reserve rate cuts in the upcoming decision, with some sources estimating a ~97% probability.
- Otherwise, renewed US-China tariffs announced on Friday by President Trump are adding a safe-haven demand premium to metal pricing.
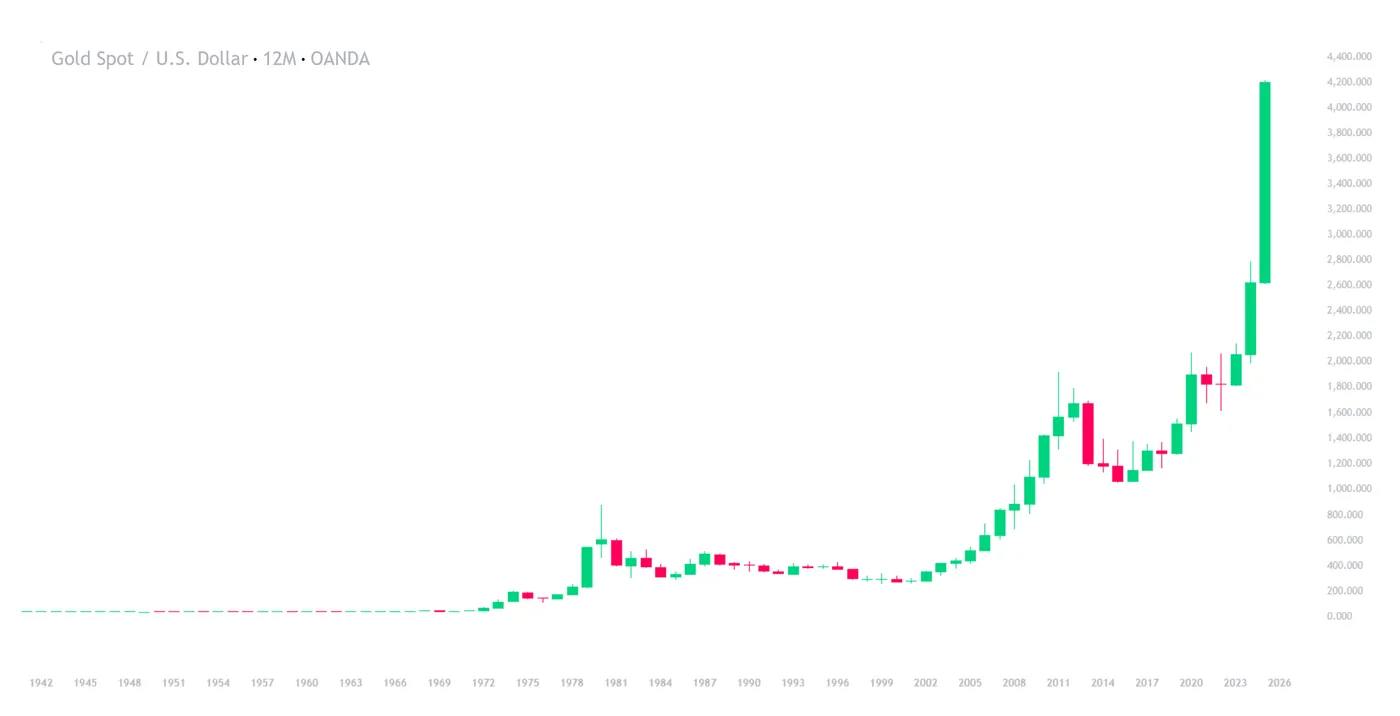
Gold (XAU/USD) yearly performance 1941-2025, OANDA, TradingView, 15/10/2025
Gold breaks above $4,200 with no signs of slowing down
While some thought the current rally must retrace, it would seem that markets need little excuse to push metal pricing higher
Benefiting from a perfect storm of macroeconomic themes, it would seem that there is no shortage of tailwind for the current gold rally.
With markets remaining as bullish as ever, let’s discuss some of the recent macroeconomic developments that are affecting metal pricing:
Renewed ‘tit-for-tat’ US-China tariffs: While there is a long history of trade relations between the United States and China, recent developments leave American levies on Chinese imports at 130%, effective November 1st.
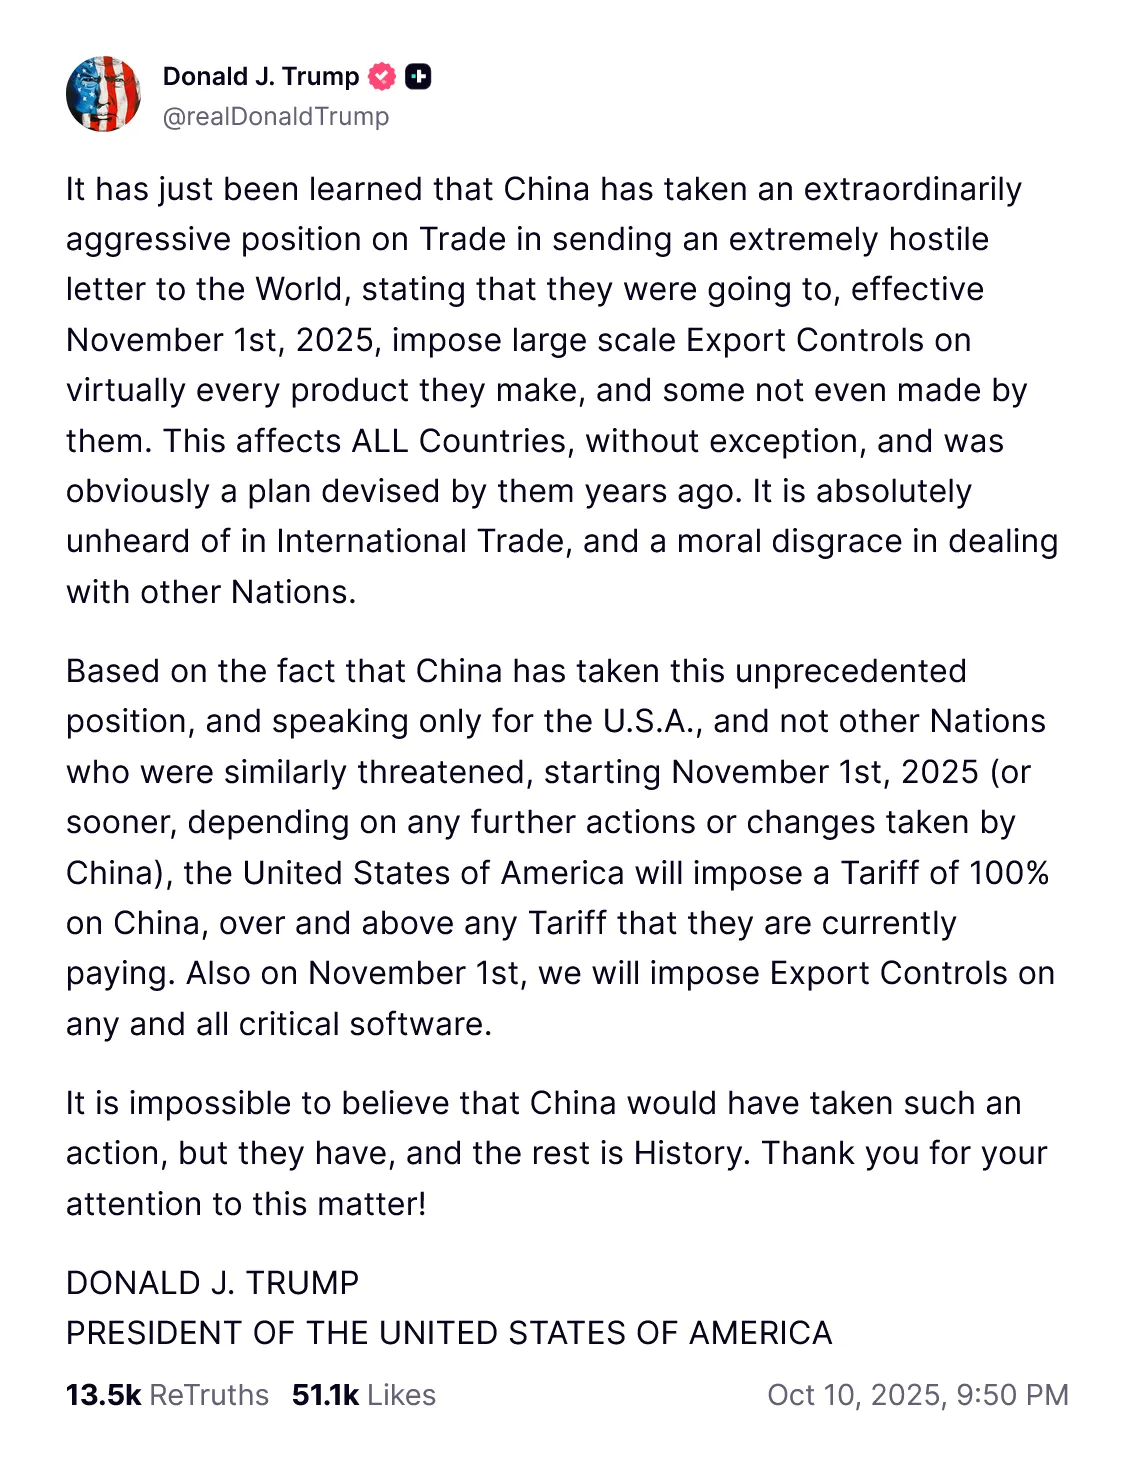
@realDonaldTrump, Truth Social, 10/10/2025
Using China’s proposed export controls as justification, especially regarding rare earth minerals, Trump has somewhat predictably responded in kind with an unprecedented 100% tariff, bringing the total levy on Chinese imports to 130%.
With Trump’s infamous ‘liberation day’ relatively fresh in collective memory, we can expect further global trade disruption to boost precious metal pricing, as seen since Friday’s announcement.
Markets certain of consecutive Fed rate cuts: Having expanded on this in full as part of previous coverage, I’ll be brief: markets are increasingly expecting a 25 basis point cut in the Federal Reserve’s October decision. As a non-yielding asset, this directly benefits gold pricing, especially when considering falling yields on U.S. Treasury bonds.
CME FedWatch, 15/10/2025
While a ~97% probability of a 25 basis point is a rare level of conviction by the market, some rationale behind this confidence can be offered when considering Jerome Powell’s comments on the US labour market yesterday:
Rising downside risks to employment have shifted our assessment of the balance of risks. Jerome Powell, speaking at a conference in Philadelphia, 14/10/2025
Not only do these comments shift the focus away from inflation, but considering the context of a poor ADP payrolls and missing NFP data, a dovish picture continues to develop.
At the time of writing, the Federal Reserve is expected to meet in fourteen days' time, on October 29th.
Ongoing US government shutdown: To finish, an honourable mention must be made to the current US government shutdown, while admittedly old news, it continues to boost gold pricing by way of increased safe-haven flows. Now ongoing for fifteen days, and especially considering the complications to important government data releases, the longer the shutdown continues, the greater the damage to the US economy will increase exponentially.
Gold (XAU/USD): Technical Analysis 15/10/2025
Having touched base on the fundamentals, let’s shift our focus to the technicals, starting with the weekly and finishing with the daily.
Gold (XAU/USD): Weekly (W) chart analysis:
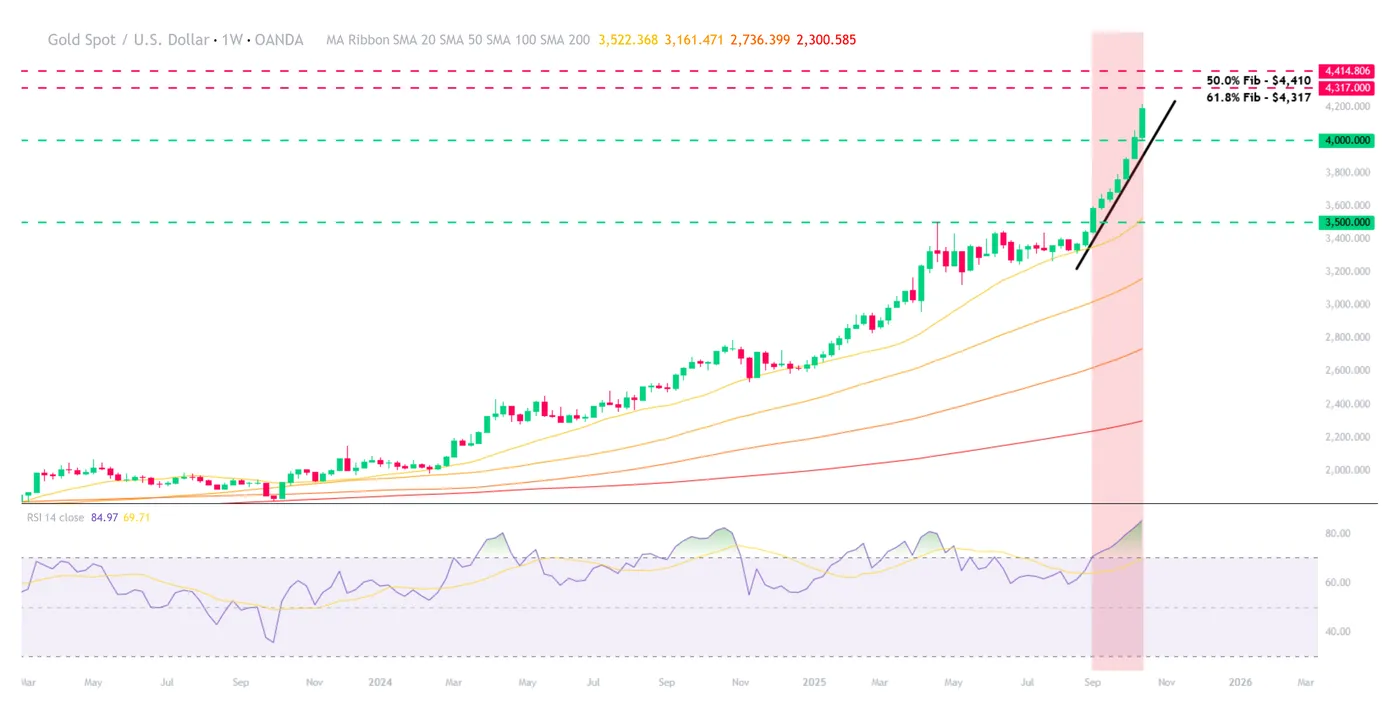
Gold (XAU/USD) W, OANDA, TradingView, 15/10/2025
With recent price action virtually parabolic, pricing continues in one direction, to the behest of gold bulls.
Currently, volatility remains high, with readings from the ATR approaching five-month highs.
From a classical technical standpoint, the market is confirming a sustained long-term bullish move, with the 20, 50, 100, and 200-period SMAs all offering support below current price action.
It should be noted, however, that prices are likely to retrace somewhat in the near future, although no one can be certain exactly when.
As such, the RSI currently trades at its highest level since August 2019, firmly in ‘overbought’ territory. Many will be looking for prices to retreat to get long.
Price targets and support/resistance levels:
- Price target 1: 61.8% Fib: $4,317
- Price target 2: 50.0% Fib: $4,410
- Support 1: Trendline: $4,040
- Support 2: Psychological level: $4,000
Gold (XAU/USD): Daily (D1) chart analysis:
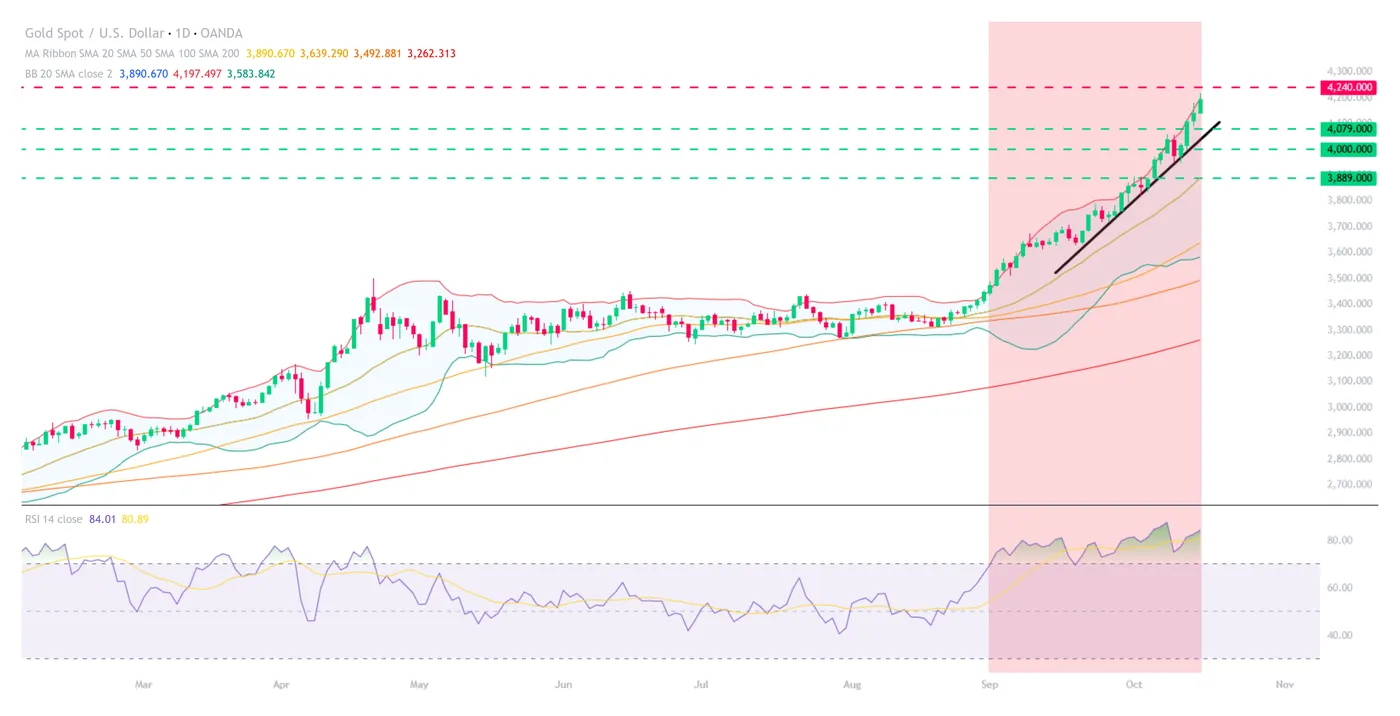
Gold (XAU/USD) D1, OANDA, TradingView, 06/10/2025
With the recent explosive move in metal pricing, it’s no surprise that daily price action continues to trade at the top boundary of the 20-period Bollinger bands.
Price targets and support/resistance levels:
- Price target 1: 78.6% Fib: $4,240
- Support 1: Trendline: $4,079
- Support 2: Psychological key level: $4,000
- Support 3: 20-period SMA: $3,889
Following simple technical analysis theory, this suggests that a retracement towards the midline is inevitable, only being a matter of when.
This goes double when considering that the daily price action has been deemed overbought by the 14-period RSI since early September.
For now, we can consider a retracement towards $4,000 as a potential entry point, with ample support available below.
As traders, we know we shouldn’t try to catch a falling knife, and the same would apply for one shot out of a cannon - some food for thought.
Silver (XAG/USD) squeeze shakes market participants
The run in Silver prices has been nothing short of extraordinary.
Since the start of the year, the metal has surged more than 80%, with most of the move unfolding after Powell’s late-August speech at Jackson Hole (+37% in a 44-day span).
Having broken its 2011 record highs of $49.81, Silver now trades comfortably above $50, and definitely cementing its seat as one of the most explosive rally in more than a decade.
Beyond speculation, Silver’s industrial demand — particularly in photovoltaic panels, EVs and advanced electronics — is driving the squeeze.
Supply issues are mounting, with growing fears that the metal’s rarity could lead to some disastrous developments for the precious metal.
Traders are increasingly nervous.
Some metal specialists like Brian Kuszmar admit they have never witnessed a market this volatile, not even during the infamous 1980s Silver boom.
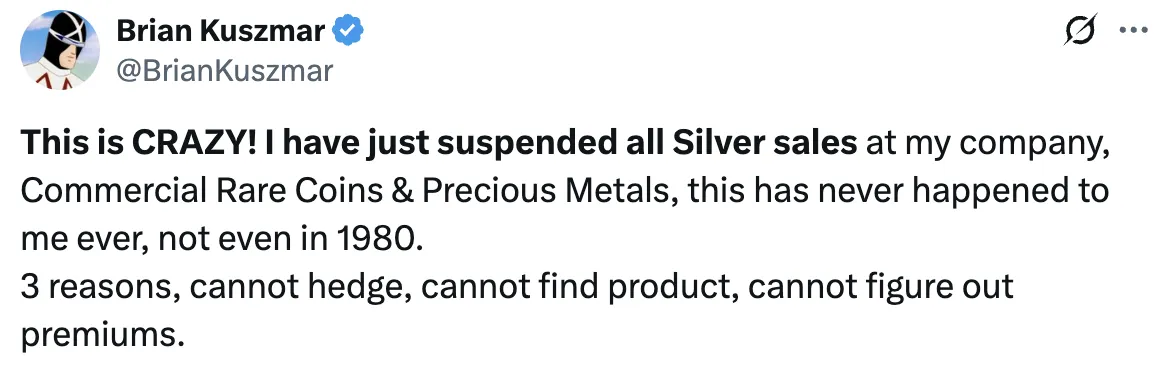
Brian Kuszmar, metal specialist since 1977 – Source: X – October 15, 2025
The parabolic rise now raises one big question — will something blow from this rally?
Silver (XAG/USD) multi-timeframe analysis
Daily Chart
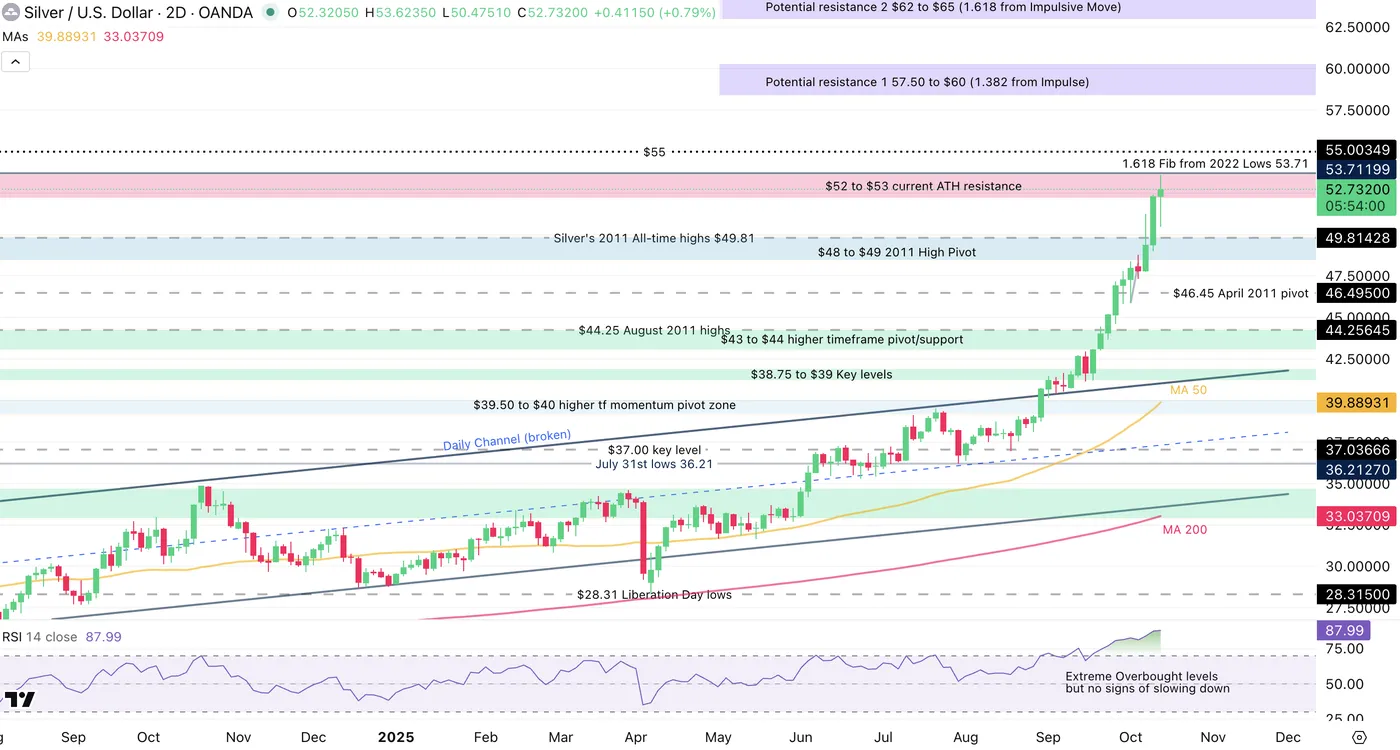
Silver (XAG) 2-Day Chart, October 15, 2025 – Source: TradingView
Looking out on higher timeframes really mark how strong the rally is.
The move is becoming more parabolic as time goes but we haven't seen widespread market panic for now:
What can happen in the strongest squeezes is a development of higher-gaps on very thin volumes.
Volumes are indeed getting thinner as the rally continues but things are not too out of whack.
Up 3% at one point in today's session, some stalling has happened at a test of the $53.71 high timeframe 1.618% Fibonacci-extension (session highs).
Reactions don't imply sudden reversals, but it's essential to keep this level in view for reversal/breakout analysis. Let's take a closer look.
8H Chart and levels
Silver (XAG) 8H Chart, October 15, 2025 – Source: TradingView
The price action is slowing around the current highs after yesterday's strong profit-taking bar.
For now, a convergence of a lower high forming with the same pattern on the RSI prompts some slowdown in the silver-rush.
Keep an eye on the upward trendline that could come into play on a retracement, particularly as it comes close to the $49.81 2011 record that hasn't been retested.
Levels to watch for Silver (XAG) trading:
Resistance Levels:
- Daily peak $53.71
- $52 to $54 current ATH resistance
- Potential resistance 1 $57.50 to $60 (1.382% from 2022 lows)
- Potential resistance 2 $62 to $65 (1.618 from Impulsive Move)
Support Levels:
- $48 to $49 2011 High Pivot
- $43 to $44 higher timeframe support
- $39.50 to $40 higher tf momentum pivot zone
- 2012 Highs Support around $37.50
1H Chart
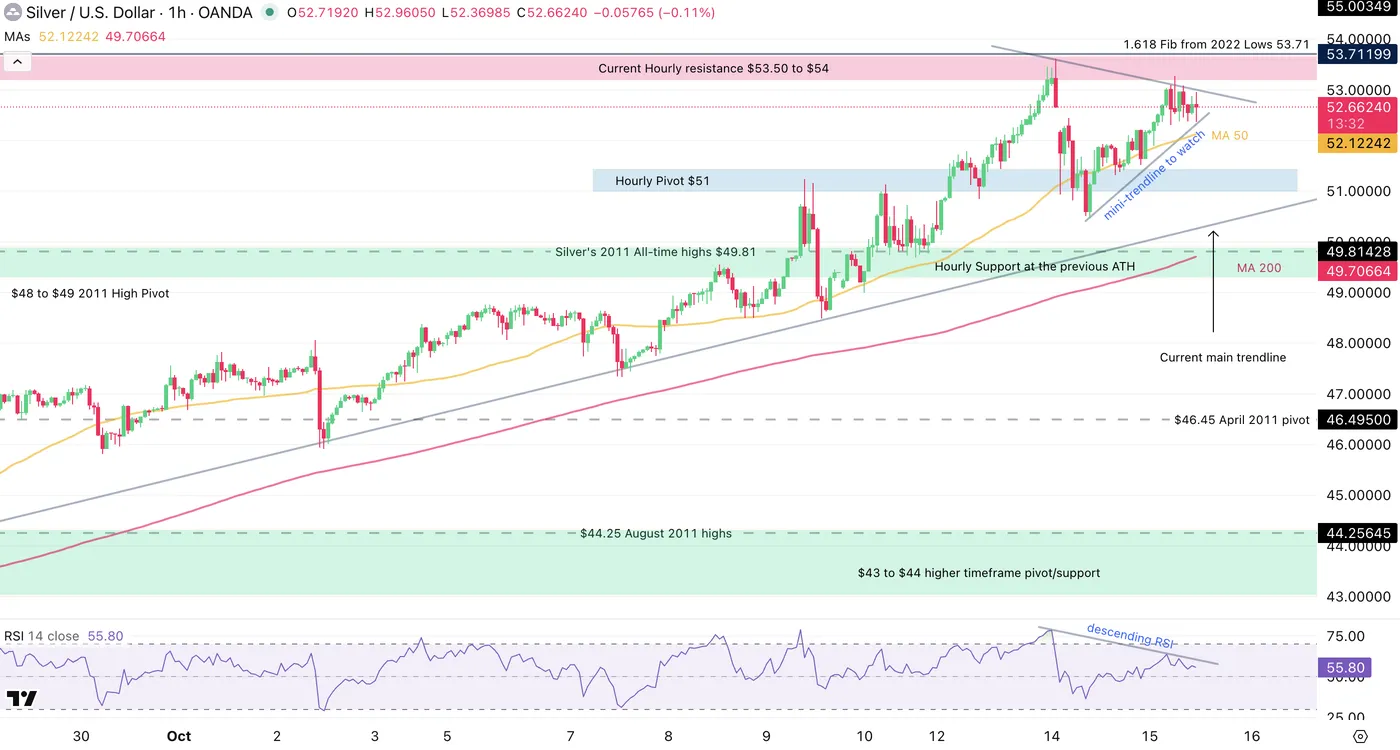
Silver (XAG) 1H Chart, October 15, 2025 – Source: TradingView
Despite the lower high formation, the price action is still consolidating close to the hourly resistance – This marks bull resilience.
Keep an eye on the 50-H MA, currently at $52.12. An hourly close below would confirm a retracement to at least the previous ATH level at $49.80.
However, a daily close above would maintain the upward trajectory.
Safe Trades!
EUR/JPY Forecast: Support at 175.00 Holds the Key to Immediate Bullish Continuation
EUR/JPY printed a hammer candlestick yesterday just above a key support level hinting at a potential bullish continuation. The bullish daily candle close also came after three successive days in the red but today has seen price action fail to build on yesterday's momentum.
EUR/JPY has pushed lower testing the lows printed yesterday. What does the pair have in store for market participants in the coming days? Let us take a look.
Japanese Yen: Geopolitical Safety Bid vs. Domestic Instability
The Japanese Yen (JPY) is currently getting stronger, but this strength is based on fear and is likely to be temporary.
The yen's recent gains is likely because market participants are scared by the rising trade tensions between the US and China, which now includes new shipping fees and tariff threats. This global "risk-off" mood, which is also pushing gold prices to records, makes investors put money into the yen because it's traditionally considered a safe-haven.
However, this rise is unstable due to problems in Japan. The currency's gains are limited by political uncertainty following the collapse of the ruling party's coalition. More importantly, the likely new Prime Minister, Sanae Takaichi, has in the past indicated she may interfere with the Bank of Japan's (BOJ) decision to potentially hike interest rates.
Market participants think this political interference will prevent the BOJ from raising rates which is what the yen needs to get stronger. We have already seen rate hike expectations take a significant hit following the election, based on the latest LSEG data.
These developments are weighing on the Yen and may do so over the medium-term, hinting at potential gains for the Euro.
Political Instability Affecting the Euro
The euro’s path right now seems stuck because the Eurozone looks shaky.
France, for example, saw its prime minister step down, and the country is wrestling with the biggest budget deficit any Euro‑area nation has had in years. That kind of political mess may mean higher risk for investors.
Because of that the spread between French OATs and German Bunds has started to widen. In other words, lenders ask for a bigger premium to hold French debt. The market reads this as a sign that the whole bloc could be under pressure. So the euro’s ability to ride out outside shocks looks weaker, which may push the EUR/JPY pair lower.
Looking Ahead - Beyond the Data
Over the next ten days or so we have a host of data releases which could stoke volatility in EURJPY. However, many of these data releases will likely lead to short-term moves.
The political developments in France and Japan may have a bigger impact on the overall direction of the pair, especially regarding BoJ policy. Keep an eye out for any major announcement in that regard in the coming days.
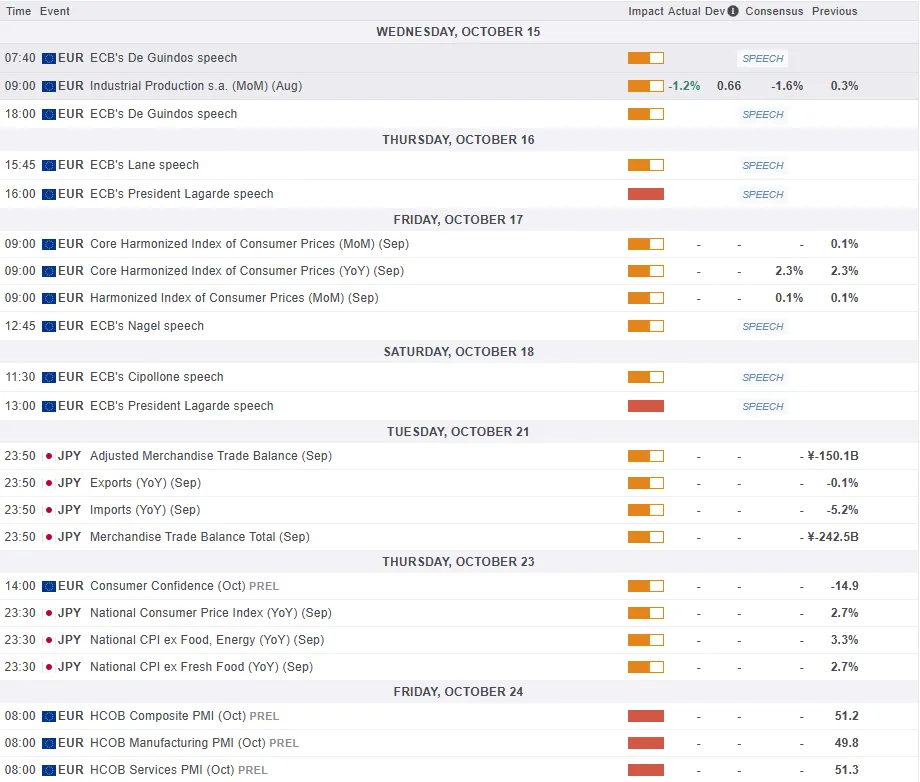
For all market-moving economic releases and events, see the MarketPulse Economic Calendar. (click to enlarge)
Technical Analysis - EUR/JPY
From a technical point of view, EUR/JPY is resting above a key support level which was the recent swing high around the 175.00 handle.
If this level holds there is every chance that EUR/JPY may revisit the YTD high from October 9, resting at 177.92.
A break of that handle could open up a run toward the psychological 180.00 handle and beyond.
A break of support at the 175.00 handle may open up a deeper retracement with a key level resting at 173.89 before the long-term ascending trendline and the 100-day MA which rests at 171.32 comes into focus.
EUR/JPY Daily Chart, October 15, 2025
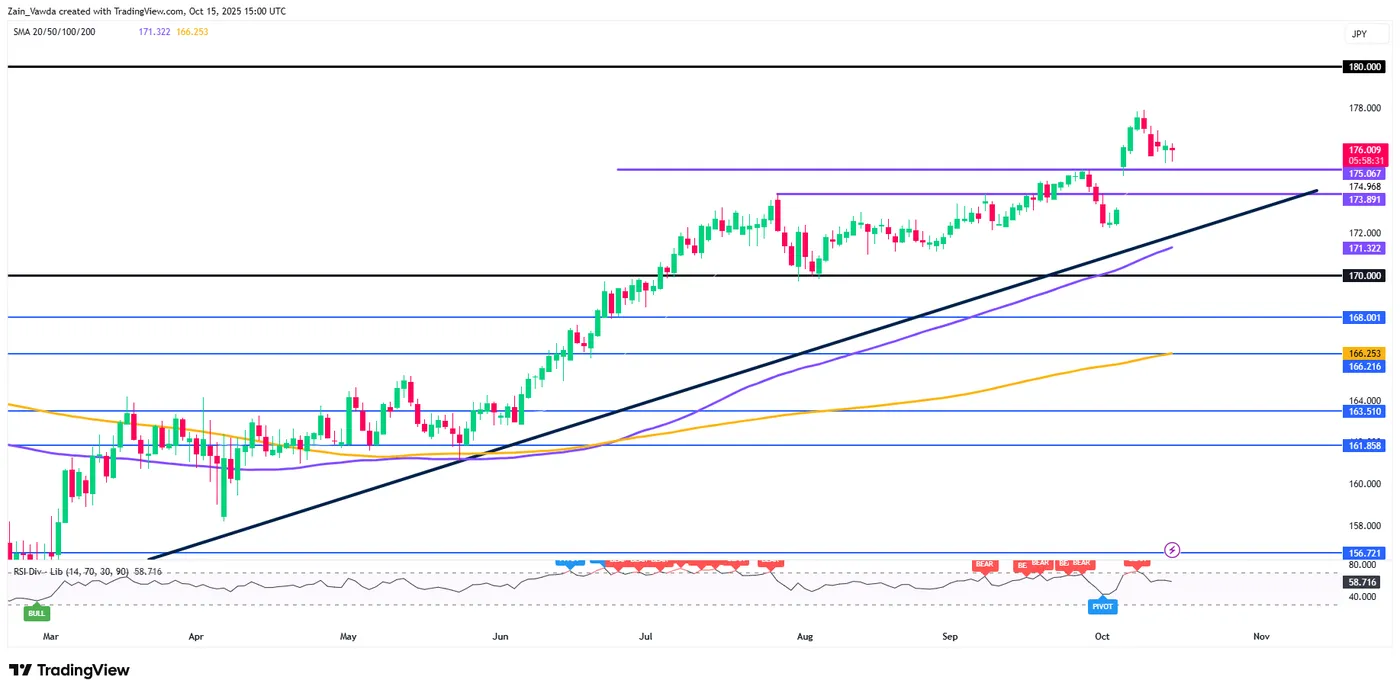
Source: TradingView.com
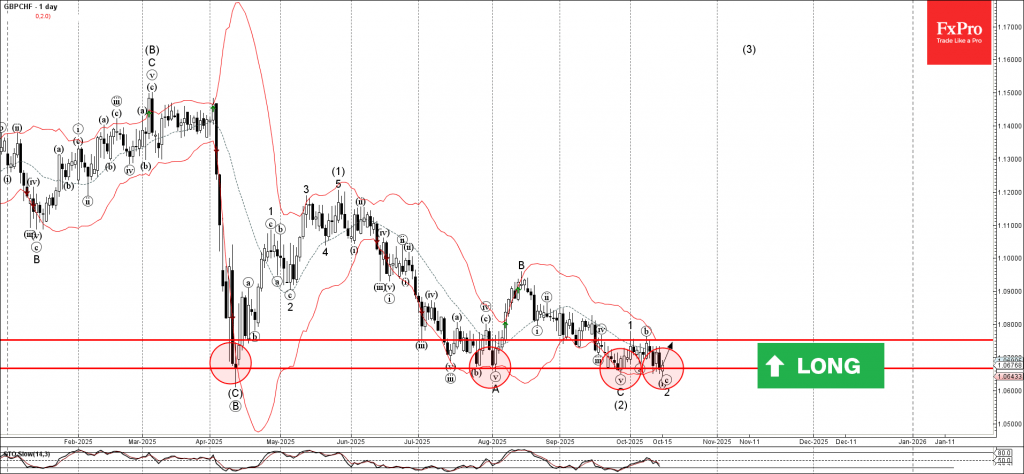
GBPCHF Wave Analysis
GBPCHF: ⬆️ Buy
- GBPCHF reversed from support zone
- Likely to rise to resistance level 1.0750
GBPCHF currency pair recently reversed from the support zone between the strong long-term support level 1.0665 (which has been reversing the price from April) and the lower daily Bollinger Band.
The upward reversal from this support zone stopped the previous short-term ABC correction 2 from the end of September.
Given the bullish divergence on the daily Stochastic indicator, GBPCHF currency pair can be expected to rise to the next resistance level 1.0750.
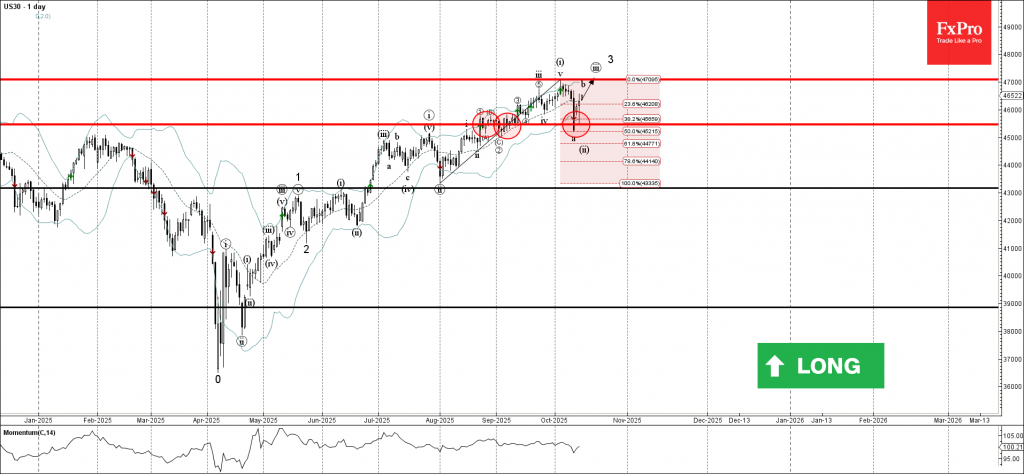
Dow Jones Wave Analysis
Dow Jones: ⬆️ Buy
- Dow Jones reversed from support zone
- Likely to rise to resistance level 47000.00
Dow Jones index recently reversed up from the support zone between the key support level 45470.00 (former resistance from August), lower daily Bollinger Band and the 38.2% Fibonacci correction of the upward impulse from August.
The upward reversal from this support zone created the daily reversal pattern Hammer, which stopped earlier correction ii.
Given the strong daily uptrend, Dow Jones index can be expected to rise further to the next resistance level 47000.00 (which stopped earlier impulse wave i).
USD/JPY Eases Further on Rate Cut Expectations But Key Supports Still Hold
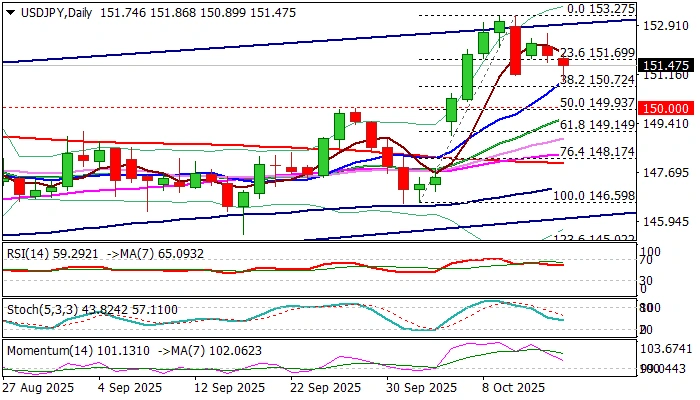
USDJPY fell further on Wednesday as dovish remarks from Fed Powell added to expectations for Fed rate cuts in October and December and kept the dollar at the back foot.
Fresh bears hit one week low but faced strong headwinds at initial support at 150.90 (rising 10DMA / former top of Aug 1), guarding more significant supports at 150.76/72 (weekly cloud top / Fibo 38.2% of 146.59/153.27) and 150 zone (psychological / nearby daily Tenkan-sen / Fibo 50% retracement.
Wednesday’s action was so far shaped in a Hammer candle which may signal that corrective leg from 153.27 (Oct 10 peak) might be running out of steam.
Overall bullish daily studies (multiple golden crosses / 14-d momentum still holding well above the centreline / RSI at 60) may contribute to such scenario and signal that larger bulls might be returning to play after a rather shallow correction.
Daily close above 150.90/72 would boost the signal, however, more action to the upside will be still required to confirm (lift above Tuesday’s high at 152.61 and broken upper bull-channel boundary at 152.88).
Conversely, sustained break of 150.72 to generate bearish signal, with extension below 150 pivot to open way for deeper correction.
Res: 150.90; 151.86; 152.61; 152.88.
Sup: 150.72; 150.00; 149.61; 149.14.
Fed’s Miran sees two more cuts, warns trade tensions add new tail risks
Fed Governor Stephen Miran said today that two more interest rate cuts this year “sound realistic”, in light of continued disinflation and growing downside risks.
Speaking at a CNBC forum, he said it was now “even more urgent to get to the neutral rate quickly”, arguing that the Fed’s priority should be to adjust policy preemptively as economic risks mount.
Miran added that the balance of risks had worsened compared to just a week ago. Recent developments in U.S.–China relations could play a meaningful role in shaping the economic outlook, warning that policymakers must now “think about the introduction of a new tail risk.”
What If There Was No Trend in US Dollar? DXY Outlook
Traders are obsessed with trends.
Yet history shows that markets only trend about 30% of the time — the remaining 70% is spent consolidating sideways. This is valid for almost every asset class since the dawn of time.
But consolidation don't necessary translates to frustrating, choppy action.
In 2025, the US Dollar has been at the center of global debate.
After months of weakness driven by tariff fears, slower US growth, and fiscal uncertainty, a bottom seems to have formed since July — confirmed by the pre-FOMC retest in mid-September.
But bottom doesn’t always mean reversal.
The much-discussed de-dollarization trend, for now, looks overstated.
Despite with less conviction than before, the world still largely trades in USD.
Instead of a sharp recovery, the greenback appears stuck in a large range as traders await new catalysts — whether from tariff policy, an unexpected change to the Fed's stance, or new global economic trends.
This could have important implications for FX markets in all currencies.
Let's take a close look at the Dollar Index (DXY) to spot what the range looks like and its key levels of interest.
Dollar Index mulit-timeframe analysis and levels
Daily Chart
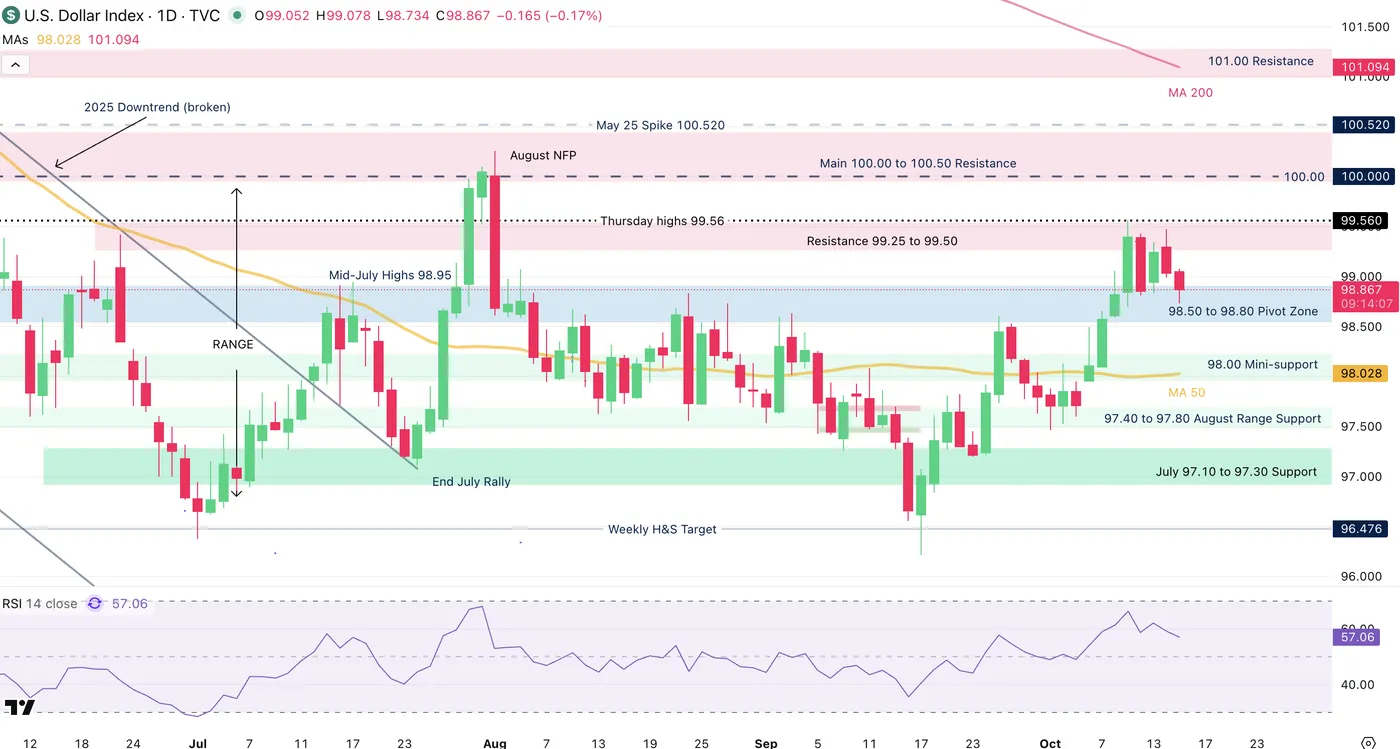
Dollar Index Daily Chart, October 15, 2025 – Source: TradingView
The Dollar Index recently broke the 99.00 handle, having done so for the first time since end-July.
However, with the ongoing uncertainty in markets, it seems that participants are not rushing to bid the greenback at its highs.
Reacting to a key technical resistance right around 99.50, sellers have appeared to correct the pair slightly which decreases the technical outlook for a sudden breakout.
Looking further out, the range is taking place between 97.00 to 100.00 with some +/- 500 pip precision.
USD/CAD is trading right around 1.40, USD/JPY rejected its higher levels and the Swissie is proving resilient around 0.80.
4H Chart and levels
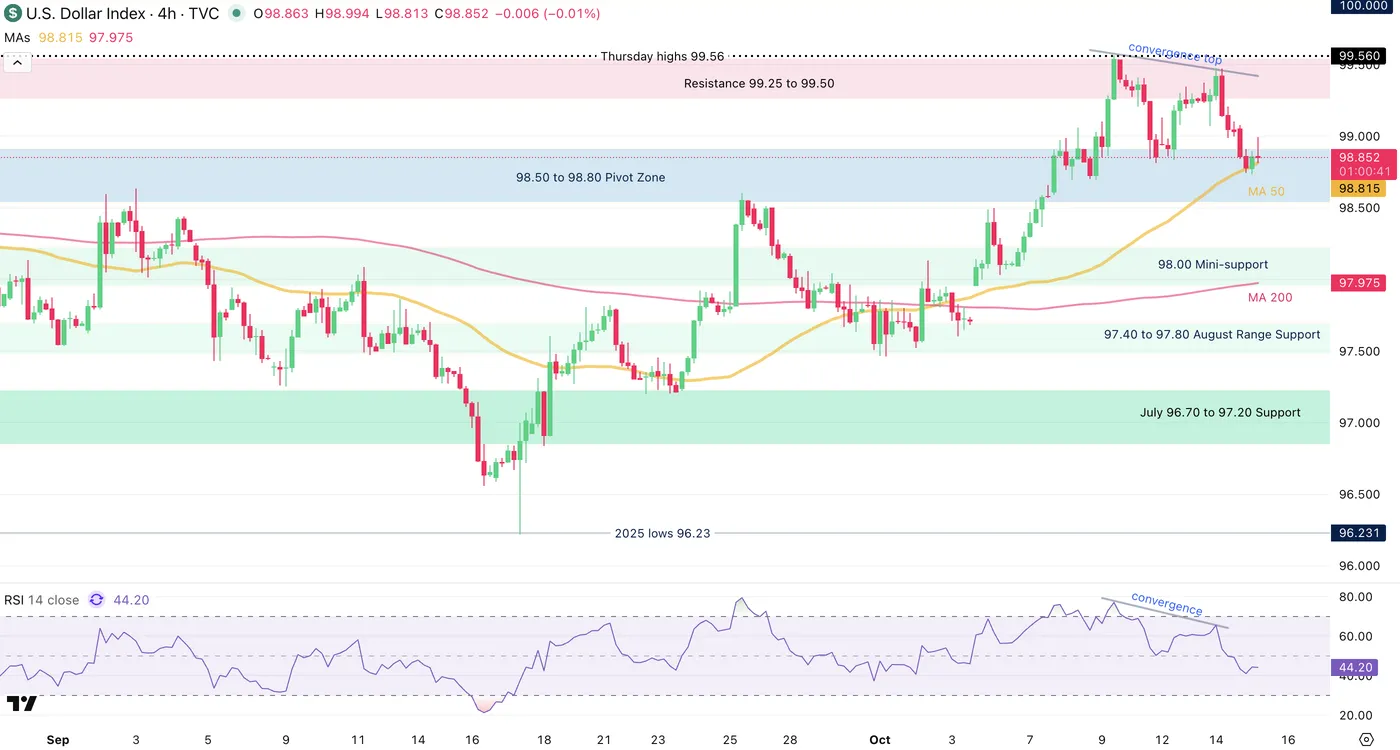
Dollar Index 4H Chart, October 15, 2025 – Source: TradingView
The DXY is reacting particularly well to overbought and oversold levels in the RSI as of late, and the pattern seems to repeat through different timeframes, a sign confirming the rangebound action further.
The 4H MA 50 (98.81) is still acting as support around the current 98.50 zone pivot restraining the selloff – Any breach below would confirm a re-entry in the range.
Levels of interest for the Dollar Index:
Support Levels:
- 98.50 to 98.80 Pivot Zone (with 4H MA 50)
- 98.00 Mini-Support
- August Range support 97.25 to 97.60
- 2025 Lows Major support 96.50 to 97.00
Resistance Levels:
- Resistance 99.25 to 99.50
- Thursday Oct 9 highs 99.56
- 100.00 Main resistance zone
1H Chart
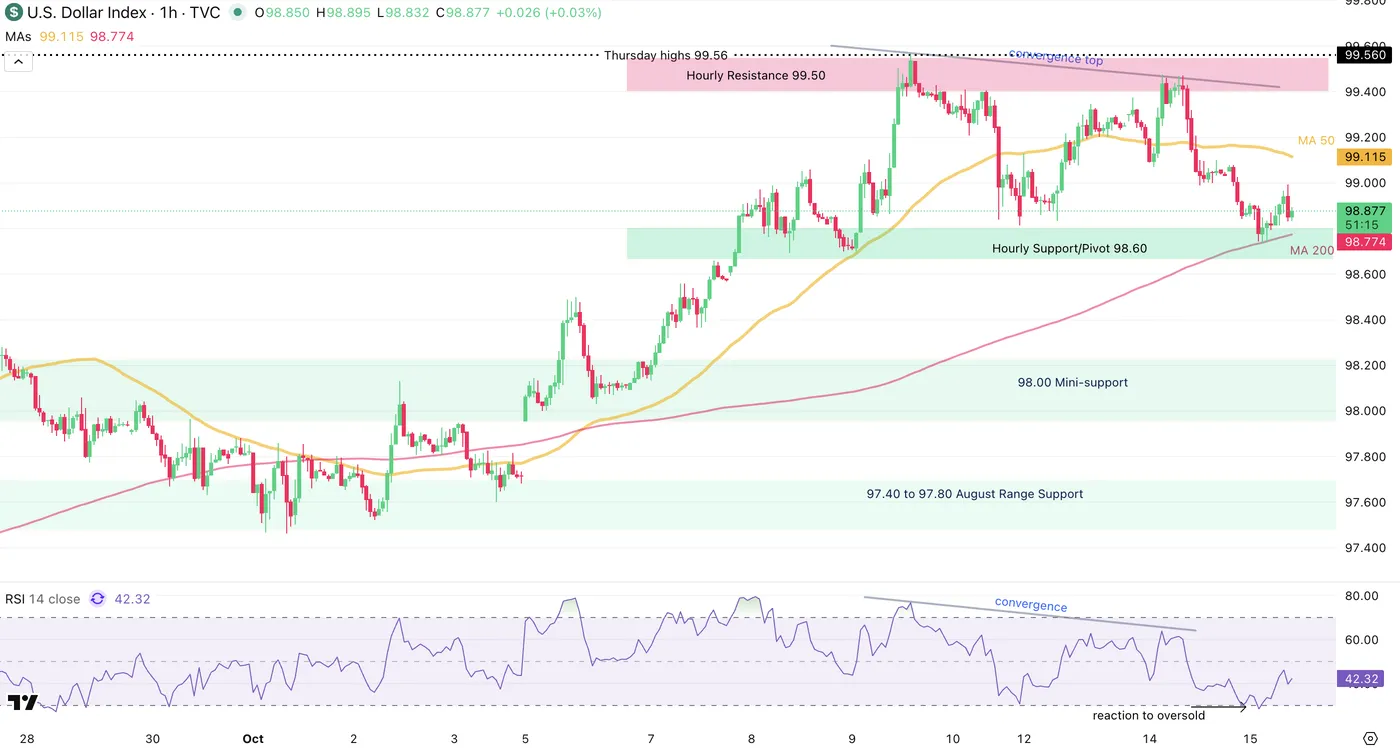
Dollar Index 1H Chart, October 15, 2025 – Source: TradingView
Looking even closer, small mean-reversion buying is occuring at the 98.60 hourly support but with the RSI approaching neutral, reactions will be essential to monitor.
Spot through the chart the ongoing mini-range between 98.60 and 99.50: Any break and close above/below should see continuation.
If rangebound conditions persist, attempt to spot how this could contain the price action in other FX pairs in the waiting of more fundamental catalysts.
Safe Trades!