
Sample Category Title
AUD/USD Daily Report
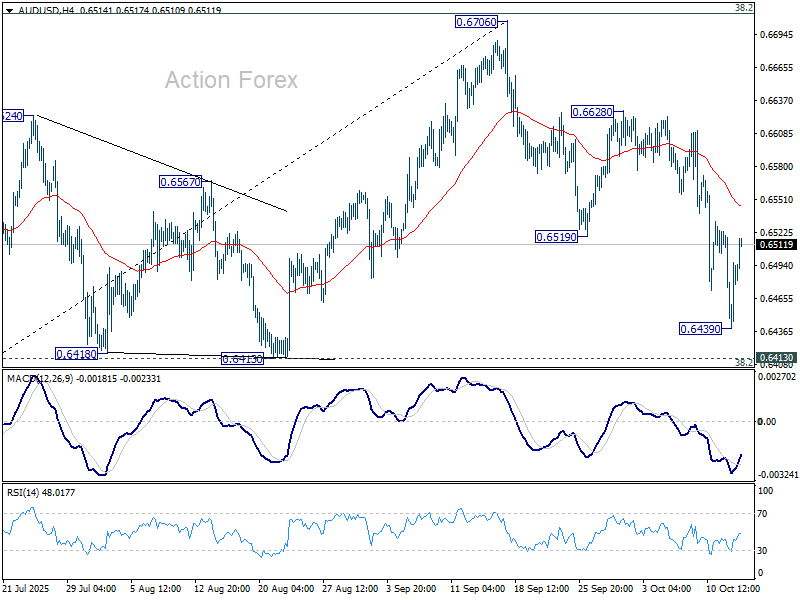
Daily Pivots: (S1) 0.6443; (P) 0.6483; (R1) 0.6525; More...
Intraday bias in AUD/USD is turned neutral first with current recovery. Below 0.6439 will target 0.6413 cluster support (38.2% retracement of 0.5913 to 0.6706 at 0.6403). Sustained break there will pave the way to 61.8% retracement at 0.6216. Nevertheless, break of 0.6628 resistance will retain near term bullishness, and bring retest of 0.6706 high.
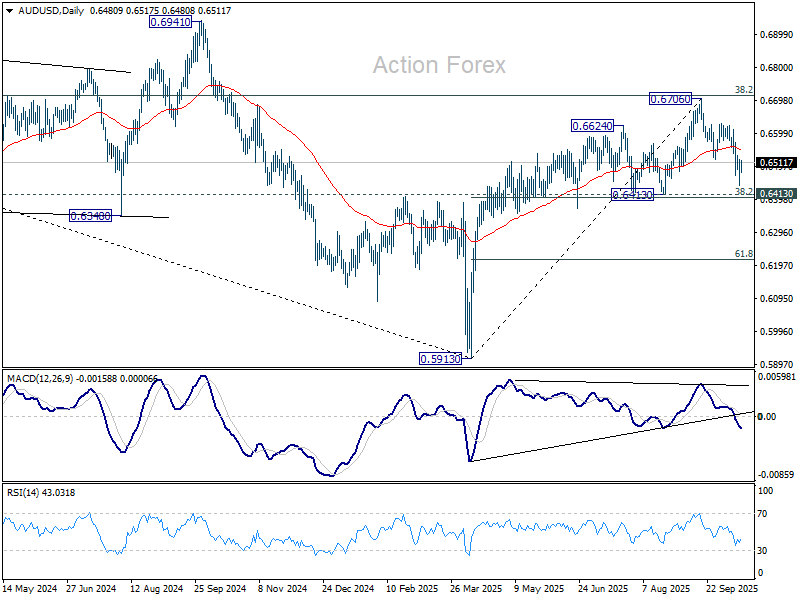
In the bigger picture, there is no clear sign that down trend from 0.8006 (2021 high) has completed. Rebound from 0.5913 is seen as a corrective move. Outlook will remain bearish as long as 38.2% retracement of 0.8006 to 0.5913 at 0.6713 holds. Nevertheless, considering bullish convergence condition in W MACD, sustained break of 0.6713 will be a strong sign of bullish trend reversal, and pave the way to 0.6941 structural resistance for confirmation.
USD/CAD Daily Outlook
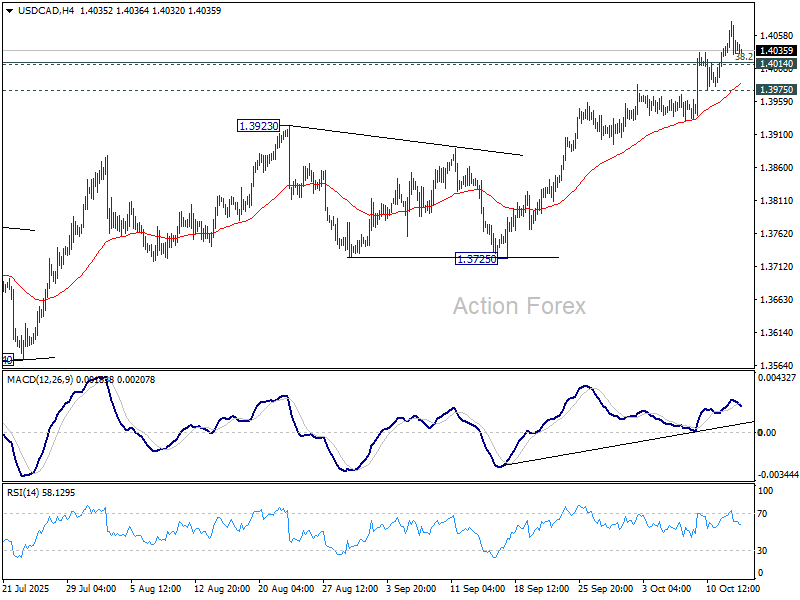
Daily Pivots: (S1) 1.4020; (P) 1.4050; (R1) 1.4075; More...
Intraday bias in USD/CAD remains mildly on the upside for the moment. Sustained trading above 1.4014/7 will suggest that USD/CAD is already reversing the whole fall from 1.4719, and target 61.8% retracement at 1.4312. On the downside, below 1.3975 minor support will turn intraday bias neutral again first.
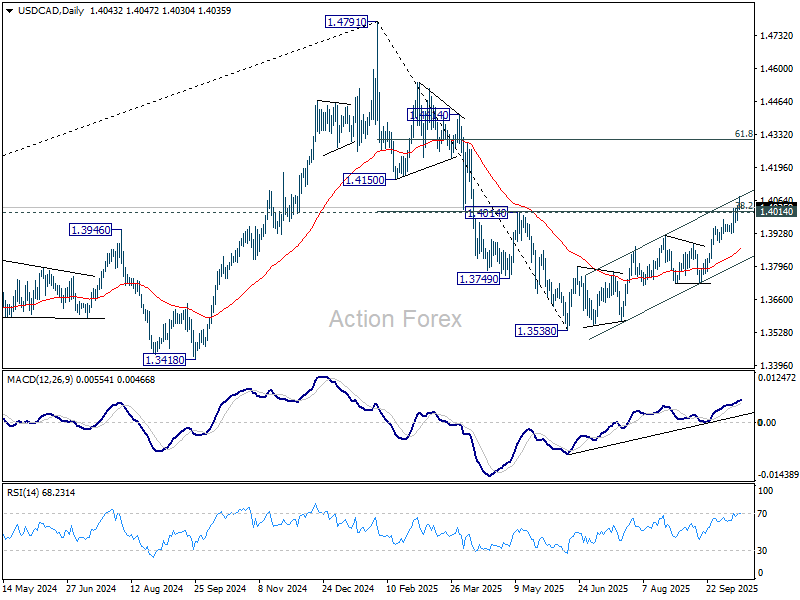
In the bigger picture, price actions from 1.4791 medium term top could either be a correction to rise from 1.2005 (2021 low), or trend reversal. In either case, further decline is expected as long as 1.4014 cluster resistance (38.2% retracement of 1.4791 to 1.3538 at 1.4017) holds. However sustained trading above 1.4014 will suggest that it's more likely just a correction, and the larger up trend would be in favor to resume through 1.4791 at a later stage.
EUR/USD Daily Outlook
Daily Pivots: (S1) 1.1562; (P) 1.1588; (R1) 1.1634; More…
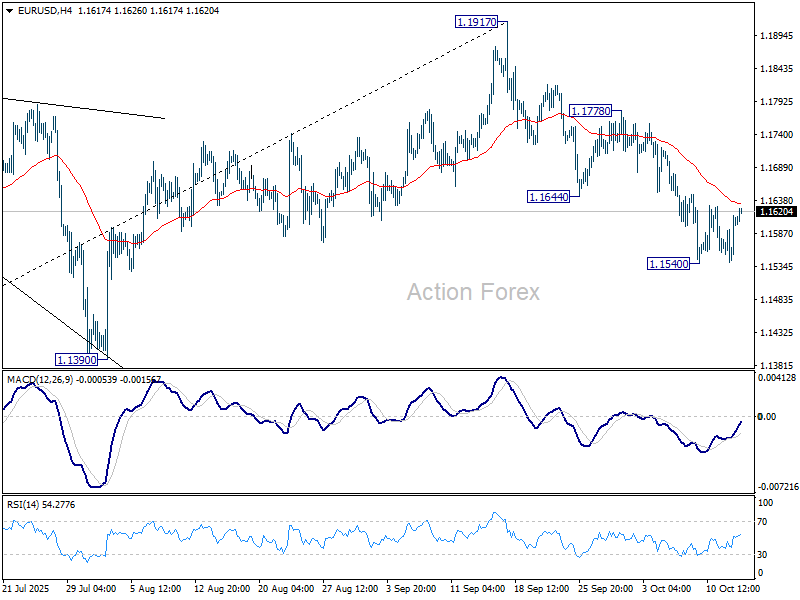
Intraday bias in EUR/USD remains neutral as consolidations continue above 1.1540. Deeper decline is expected as long as 1.1778 resistance holds. On the downside, break of 1.1540 will resume the fall from 1.1917 to 1.1390 , or further to 38.2% retracement of 1.0176 to 1.1917 at 1.1252.
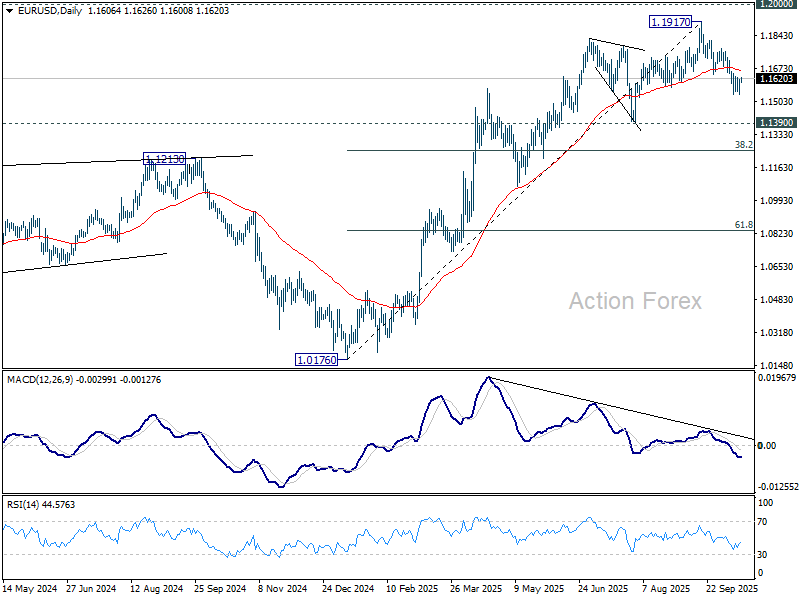
In the bigger picture, considering bearish divergence condition in D MACD, a medium term top is likely in place at 1.1917, just ahead of 1.2 key psychological level. As long as 55 W EMA (now at 1.1274) holds, the up trend from 0.9534 (2022 low) is still extended to continue. Decisive break of 1.2000 will carry larger bullish implications. However, sustained trading below 55 W EMA will argue that rise from 0.9534 has completed as a three wave corrective bounce, and keep outlook bearish.
GBP/USD Daily Outlook
Daily Pivots: (S1) 1.3262; (P) 1.3307; (R1) 1.3366; More...
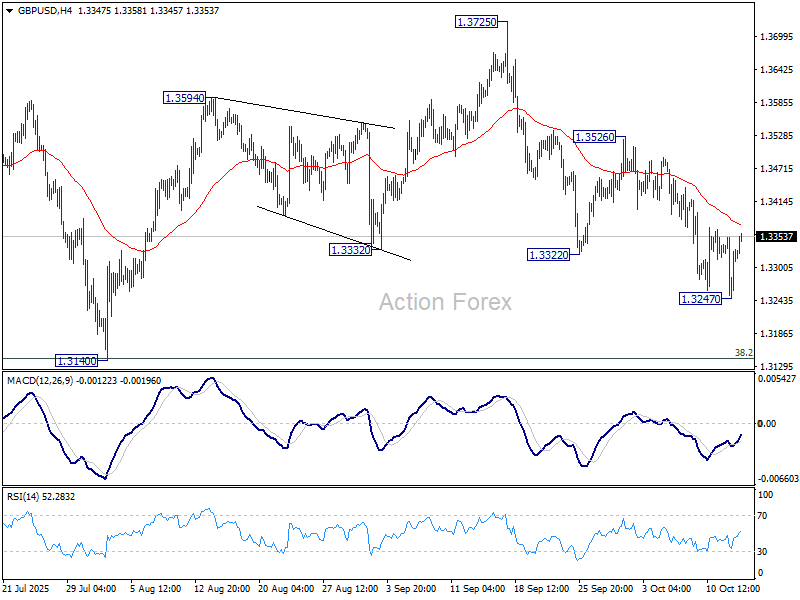
Intraday bias in GBP/USD is turned neutral with current recovery. On the downside, below 1.3247 will resume the fall from 1.3725 to 1.3140 cluster (38.2% retracement of 1.2099 to 1.3787 at 1.3142). Strong support is expected from there to complete the corrective pattern from 1.3787. On the upside, break of 1.3526 will bring stronger rally back to 1.3725/87 resistance zone.
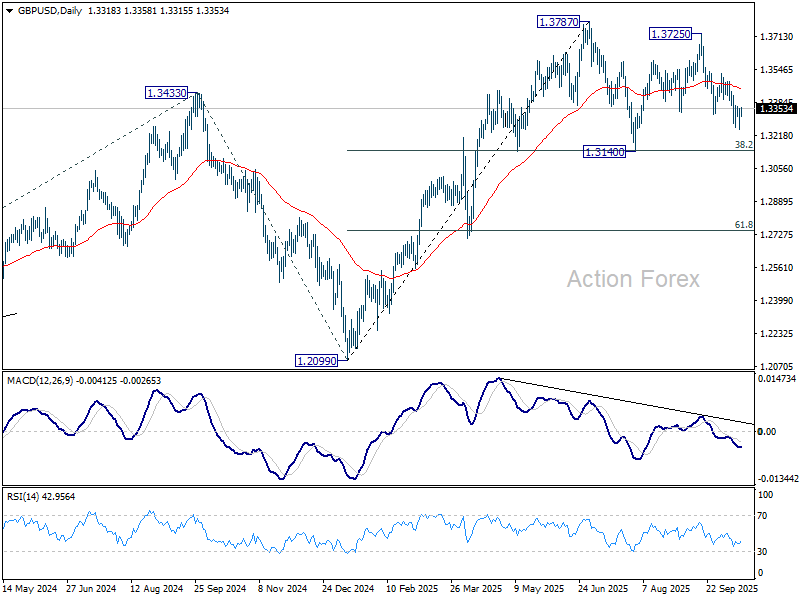
In the bigger picture, rise from 1.0351 (2022 low) is still seen as a corrective move. Further rally could be seen to 61.8% projection of 1.0351 to 1.3433 (2024 high) from 1.2099 (2025 low) at 1.4004. But strong resistance could emerge from 1.4248 (2021 high) to limit upside. Sustained break of 55 W EMA (now at 1.3173) will argue that a medium term top has already formed and bring deeper fall back to 1.2099.
USD/CHF Daily Outlook
Daily Pivots: (S1) 0.7993; (P) 0.8021; (R1) 0.8040; More…
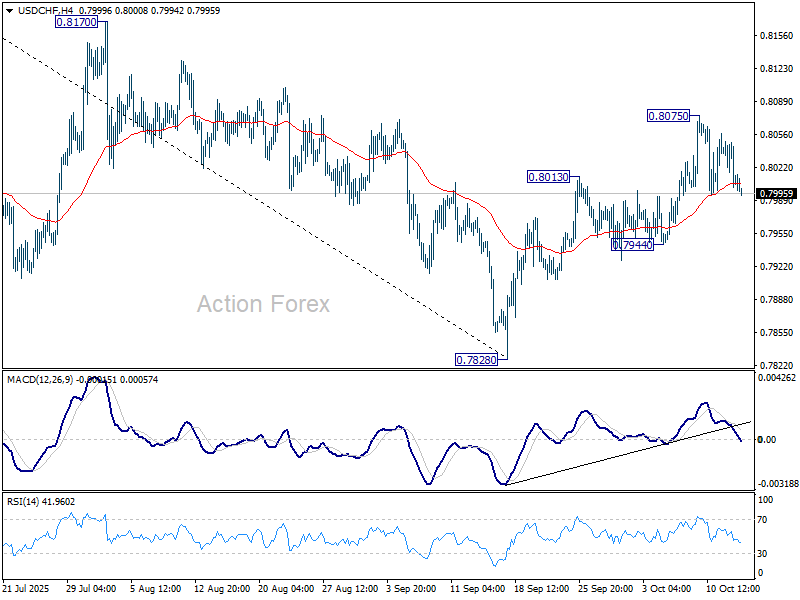
Outlook is unchanged for USD/CHF as consolidations continues below 0.8075. Intraday bias remains neutral at this point. Price actions from 0.7828 are currently seen as correcting whole fall from 0.9200. Above 0.8075 will target 0.8170 resistance next. On the downside, though, break of 0.7944 support will bring retest of 0.7828 low instead.
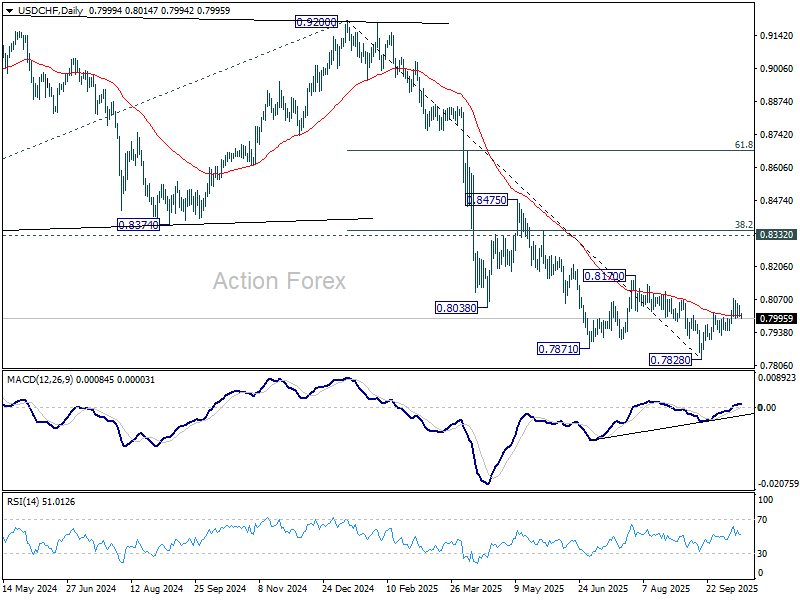
In the bigger picture, long term down trend from 1.0342 (2017 high) is still in progress. Next target is 100% projection of 1.0146 (2022 high) to 0.8332 from 0.9200 at 0.7382. In any case, outlook will stay bearish as long as 0.8332 support turned resistance holds (2023 low).
USD/JPY Daily Outlook
Daily Pivots: (S1) 151.41; (P) 152.01; (R1) 152.42; More...
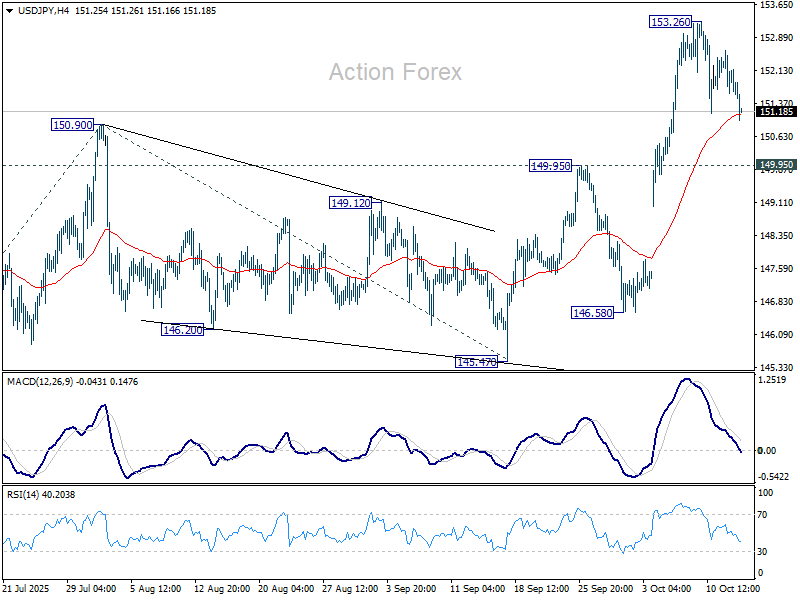
USD/JPY dips mildly today as correction from 153.26 continues, and outlook is unchanged. Intraday bias remains neutral. Downside should be contained above 149.95 resistance turned support. Break of 153.26 will target 100% projection of 142.66 to 150.90 from 145.47 at 153.71. Firm break there will pave the way to 161.8% projection at 158.80. However, decisive break of 149.95 will bring deeper pullback to 55 D EMA (now at 148.58) instead.
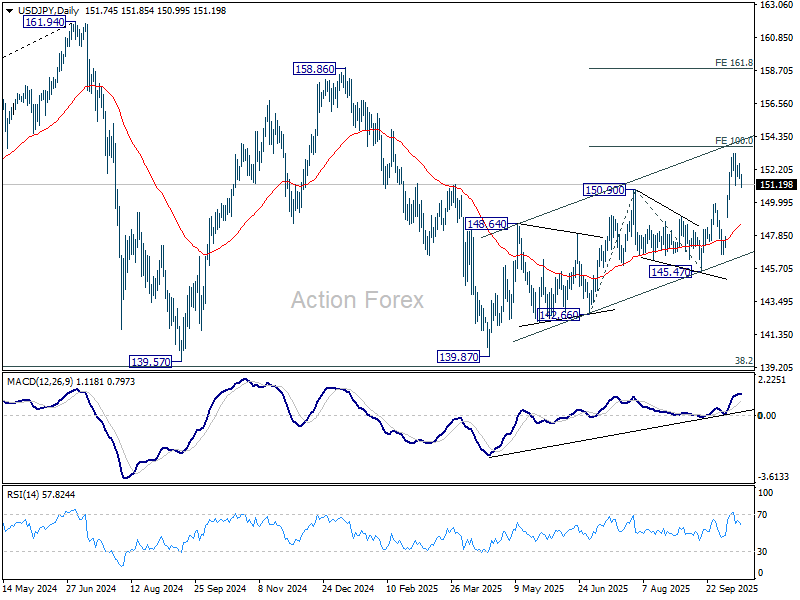
In the bigger picture, current development suggests that corrective pattern from 161.94 (2024 high) has completed with three waves at 139.87. Larger up trend from 102.58 (2021 low) could be ready to resume through 161.94 high. On the downside, break of 145.47 support will dampen this bullish view and extend the corrective pattern with another falling leg.
Volatility Persists as U.S.–China Relations Teeter Between Calm and Conflict
Global markets are caught in a cycle of indecision, with volatility staying elevated and sentiment shifting almost daily. The strained U.S.–China relationship continues to drive market mood, alternating between brief moments of optimism and renewed hostility. Any headline—positive or negative—can swing risk appetite sharply, leaving most major currencies stuck in consolidation.
The latest flare-up came after U.S. President Donald Trump criticized Beijing for halting soybean purchases, calling it “an economically hostile act.” He went further, threatening “retribution”, including a cooking oil embargo, saying the U.S. could easily produce its own.
Despite the geopolitical noise, U.S. stocks ended mixed overnight as investors took comfort from Fed Chair Jerome Powell’s reaffirmation that the central bank remains on course for another rate cut later this month. Powell’s remarks helped temper the downside in equities, with markets continuing to price in a soft-landing narrative despite trade uncertainty and political disruptions.
In Asia, Japanese equities rebounded, leading regional gains after Tuesday’s steep selloff. Investors refocused on domestic political developments as Japan prepares to select its next prime minister following Shigeru Ishiba’s resignation. Sources said the parliamentary vote is likely to take place on October 21, though political maneuvering between the ruling LDP under new leader Sanae Takaichi and the opposition may cause further delays.
Across currencies, Australian Dollar is outperforming for the week so far, , followed by Dollar and Yen. Loonie is the weakest, trailed by Swiss Franc and Sterling. However, most pairs are still moving sideways, suggesting traders are reluctant to take directional bets until clarity emerges on the U.S.–China front.
In Asia, at the time of writing, Nikkei is up 1.57%. Hong Kong HSI is up 1.21%. China Shanghai SSE is up 0.10%. Singapore Strait Times is up 0.30%. Japan 10-year JGB yield is up 0.004 at 1.667. Overnight, DOW rose 0.44%. S&P 500 fell -0.16%. NASDAQ fell -0.76%. 10-year yield fell -0.029 to 4.022.
Fed's Powell keeps October cut alive as downside risks to jobs rise
Fed Chair Jerome Powell reinforced expectations for another rate cut later this month. Speaking overnight, he said that based on available information despite government shutdown, the outlook for growth, employment, and inflation “has not changed much.”
Powell pointed out that hiring momentum has weakened, with payroll gains "slowed sharply" over the past several months. He attributed this partly to structural factors such as lower immigration and participation, which have constrained workforce growth. Even though layoffs remain subdued, Powell warned that the “downside risks to employment appear to have risen,” citing survey evidence that households see fewer job openings and firms report less hiring difficulty.
On inflation, Powell noted that price pressures remain contained. The latest surveys and data indicate that goods price increases are "primarily reflect tariffs rather than broader inflationary pressures". While short-term inflation expectations have edged higher this year, long-term expectations remain well anchored around the Fed’s 2% target.
Taken together, Powell’s tone is balanced but leaning dovish. Fed fund futures continue to see over 90% change of another 25bps cut to 3.75-4.00% on October 29.
BoE’s Bailey notes labor market cooling, IMF warns inflation still highest in G7
BoE Governor Andrew Bailey said overnight that the latest U.K. labor market data released this week reinforced his view that inflation pressures are continuing to ease gradually. Speaking at an IIF event in Washington, Bailey noted “I’ve been saying this for some time, but I think we’re seeing some softening of labor markets”.
Bailey acknowledged that uncertainty over U.S. tariffs had prompted many firms to delay investment plans, creating another drag on business sentiment. Meanwhile, he said the central bank had not yet observed any direct impact on inflation.
His remarks came as IMF Chief Economist Pierre-Olivier Gourinchas cautioned that the BoE must be “very cautious” with future rate cuts, given that U.K. inflation remains stubbornly high compared with peers. The IMF’s latest forecasts project U.K. consumer prices rising 3.4% in 2025 and 2.5% in 2026, the highest in the G7.
RBA’s Hunter: Economy holding up, inflation still persistent in some areas
RBA Assistant Governor Sarah Hunter said in a speech on Tuesday that recent data suggest the Australian economy has been performing slightly stronger than expected, reinforcing the Bank’s decision to keep the cash rate unchanged at 3.60% at its September meeting. She noted that the RBA continues to see signs that “private demand is recovering,” “inflation may be persistent in some areas,” and that labor market conditions remain “stable.”
Hunter highlighted that GDP grew 1.8% over the year to the June quarter. “If anything, outcomes have been a little stronger than those expected in the August SMP,” she said, citing resilient private spending and steady employment as evidence that the economy remains on firmer footing than previously anticipated.
She also pointed to high-frequency indicators showing that underlying inflation in the September quarter is likely to be stronger than anticipated, suggesting that economic and labor market conditions remain “a bit tighter than we had assessed.” However, she acknowledged that employment growth has slowed "slightly" more than expected, while "elevated" global uncertainty continues to cloud the outlook.
Hunter concluded that the RBA will “continually reassess” its view on the economy and adjust policy as appropriate.
China’s CPI still negative at -0.3% in September as food prices drag
China’s consumer inflation remained in negative territory in September, highlighting continued weakness in domestic demand even as underlying price pressures showed tentative signs of improvement. Headline CPI rose from –0.4% yoy to –0.3% yoy, missing expectations of –0.2% yoy.
The National Bureau of Statistics said lower food and energy prices were the main contributors to the decline, with food prices down -4.4% yoy and consumer goods prices falling -0.8% yoy, partly offset by a 0.6% yoy increase in service prices.
However, the data also showed hints of stabilization beneath the surface. Core CPI, which excludes food and energy, rose 1.0% yoy from a year earlier, its highest level since February 2024, suggesting that domestic price momentum is slowly recovering in service sectors and other non-food categories.
Meanwhile, factory-gate prices continued to contract, with PPI rising from –2.9% yoy to –2.3% yoy, in line with expectations. This marks the 36th consecutive month of producer deflation, underscoring persistent cost pressures in manufacturing. NBS statistician Dong Lijuan said recent capacity management efforts in several industries have helped narrow the pace of decline, noting that market competition has improved as industrial supply and demand slowly rebalance.
USD/JPY Daily Outlook
Daily Pivots: (S1) 151.41; (P) 152.01; (R1) 152.42; More...
USD/JPY dips mildly today as correction from 153.26 continues, and outlook is unchanged. Intraday bias remains neutral. Downside should be contained above 149.95 resistance turned support. Break of 153.26 will target 100% projection of 142.66 to 150.90 from 145.47 at 153.71. Firm break there will pave the way to 161.8% projection at 158.80. However, decisive break of 149.95 will bring deeper pullback to 55 D EMA (now at 148.58) instead.
In the bigger picture, current development suggests that corrective pattern from 161.94 (2024 high) has completed with three waves at 139.87. Larger up trend from 102.58 (2021 low) could be ready to resume through 161.94 high. On the downside, break of 145.47 support will dampen this bullish view and extend the corrective pattern with another falling leg.
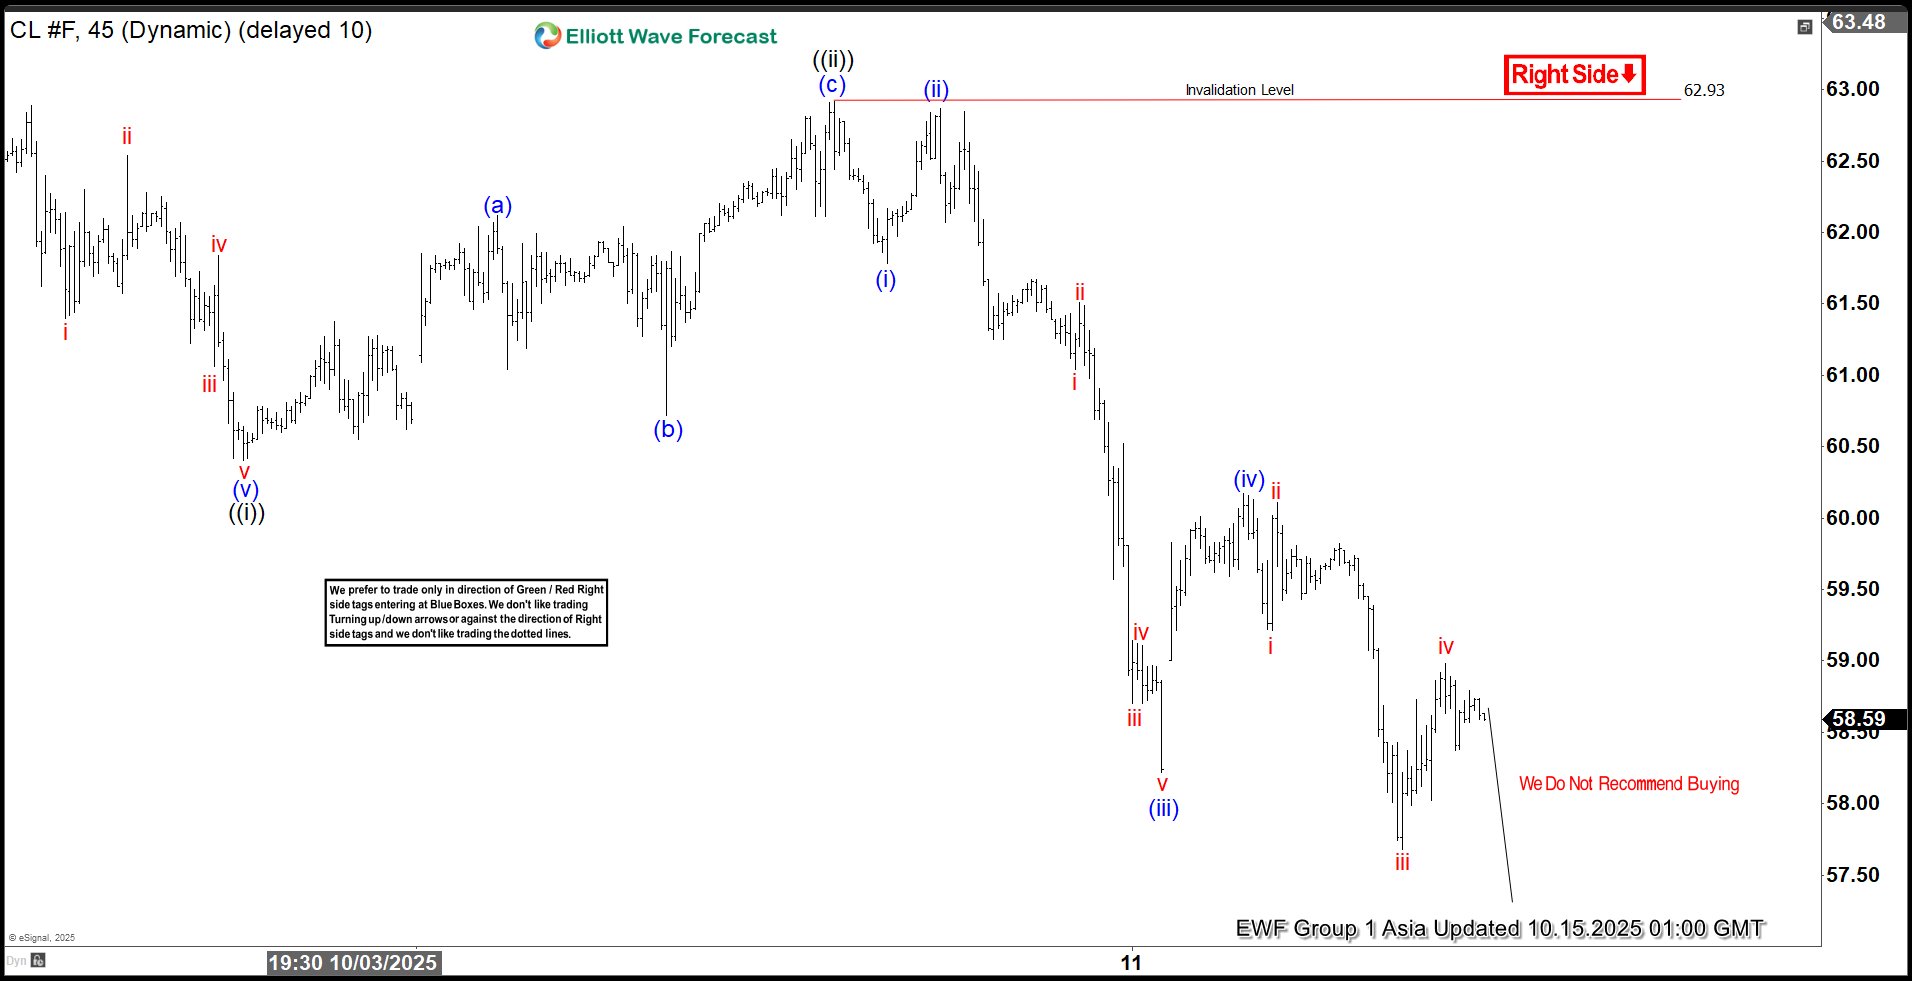
Elliott Wave Analysis: Light Crude Oil (CL) Weakness Expected to Persist
The short-term Elliott Wave analysis for oil indicates that a decline from the September 26, 2025, high is unfolding as a five-wave impulse. Starting from that peak, wave ((i)) concluded at $60.40, as depicted on the 45-minute chart. Subsequently, wave ((ii)) rallied in a zigzag Elliott Wave pattern. From the low of wave ((i)), wave (a) reached $62.12, followed by a pullback in wave (b) to $60.72. The upward move in wave (c) peaked at $62.93, completing wave ((ii)) at a higher degree.
Oil then continued its descent in wave ((iii)), structured as an impulsive sequence. From the wave ((ii)) high, wave (i) dropped to $61.78, and wave (ii) corrected to $62.87. Wave (iii) extended lower to $58.22, with a bounce in wave (iv) reaching $60.17. In the near term, as long as the pivot at $62.93 holds, any rally is expected to falter in a 3, 7, or 11-swing pattern, leading to further declines. The potential downside target lies between $53.2 and $56.9, based on the 100% to 161.8% Fibonacci extension of wave ((i)). This analysis suggests continued bearish momentum, with limited upside potential unless the key pivot is breached.
Oil (CL) – 45 Minute Elliott Wave Technical Chart:
CL – Elliott Wave Technical Video:
https://www.youtube.com/watch?v=q_vrvXMZqxI
GBP/USD Extends Downside Move – Is The Pair Heading For 1.30 Next?
Key Highlights
- GBP/USD declined further below 1.3350 and tested 1.3300.
- A major bearish trend line is forming with resistance at 1.3385 on the 4-hour chart.
- EUR/USD extended losses below 1.1600 and started a consolidation phase.
- Gold rallied to a fresh all-time high above $4,175 before it faced resistance.
GBP/USD Technical Analysis
The British Pound started a major decline below 1.3400 against the US Dollar. GBP/USD dropped below the 1.3350 and 1.3300 levels to enter a bearish zone.
Looking at the 4-hour chart, the pair settled below the 100 simple moving average (red, 4-hour) and the 200 simple moving average (green, 4-hour). The pair even tested the 1.3250 zone and recently started a consolidation phase.
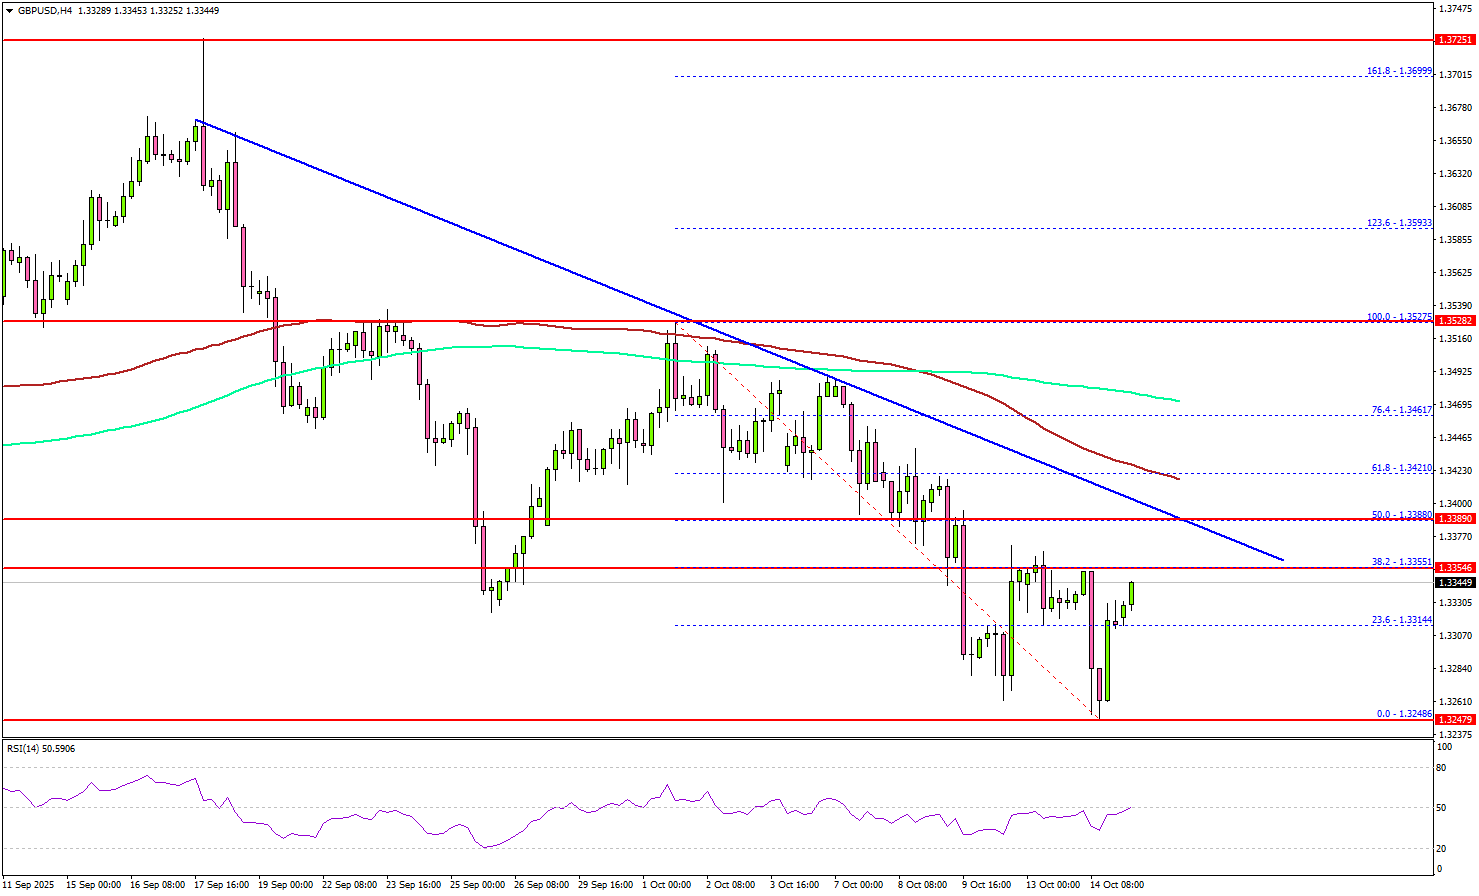
On the upside, the pair faces resistance near the 1.3350 level. It is close to the 23.6% Fib retracement level of the recent decline from the 1.3527 swing high to the 1.3248 low.
The main hurdle could be 1.3385. There is also a major bearish trend line forming with resistance at 1.3385 and the 50% Fib retracement level of the recent decline from the 1.3527 swing high to the 1.3248 low. A close above the trend line resistance might push the pair to the 100 simple moving average (red, 4-hour) or even the 200 simple moving average (green, 4-hour).
On the downside, the pair might find support at 1.3250. The main support might be 1.3200. A close above 1.3200 could send the pair toward 1.3120. Any more losses might open the doors for a test of 1.3000.
Looking at EUR/USD, the pair faced an increase in selling pressure, resulting in a drop below the 1.1600 support zone.
Upcoming Key Economic Events:
- ECB's De Guindos speech.
- BoE's Ramsden speech.
China’s CPI still negative at -0.3% in September as food prices drag
China’s consumer inflation remained in negative territory in September, highlighting continued weakness in domestic demand even as underlying price pressures showed tentative signs of improvement. Headline CPI rose from –0.4% yoy to –0.3% yoy, missing expectations of –0.2% yoy.
The National Bureau of Statistics said lower food and energy prices were the main contributors to the decline, with food prices down -4.4% yoy and consumer goods prices falling -0.8% yoy, partly offset by a 0.6% yoy increase in service prices.
However, the data also showed hints of stabilization beneath the surface. Core CPI, which excludes food and energy, rose 1.0% yoy from a year earlier, its highest level since February 2024, suggesting that domestic price momentum is slowly recovering in service sectors and other non-food categories.
Meanwhile, factory-gate prices continued to contract, with PPI rising from –2.9% yoy to –2.3% yoy, in line with expectations. This marks the 36th consecutive month of producer deflation, underscoring persistent cost pressures in manufacturing. NBS statistician Dong Lijuan said recent capacity management efforts in several industries have helped narrow the pace of decline, noting that market competition has improved as industrial supply and demand slowly rebalance.