Sample Category Title
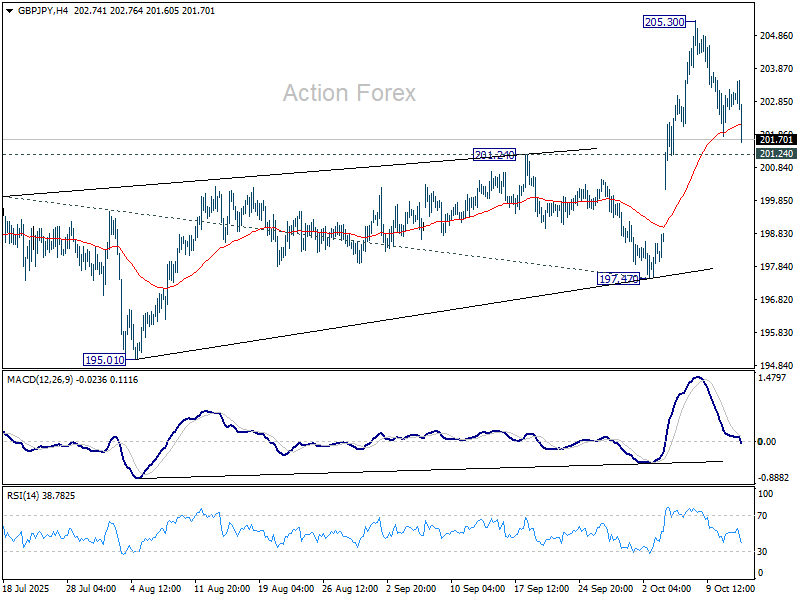
GBP/JPY Daily Outlook
Daily Pivots: (S1) 202.62; (P) 202.93; (R1) 203.40; More...
Intraday bias in GBP/JPY stays neutral first. More consolidations could be seen but with 201.24 resistance turned support intact, further rally is still in favor. Break of 205.30 will target 61.8% projection of 184.35 to 199.96 from 197.47 at 207.11. However, firm break of 201.24 will confirm short term topping and bring deeper fall back to 197.47 support instead.
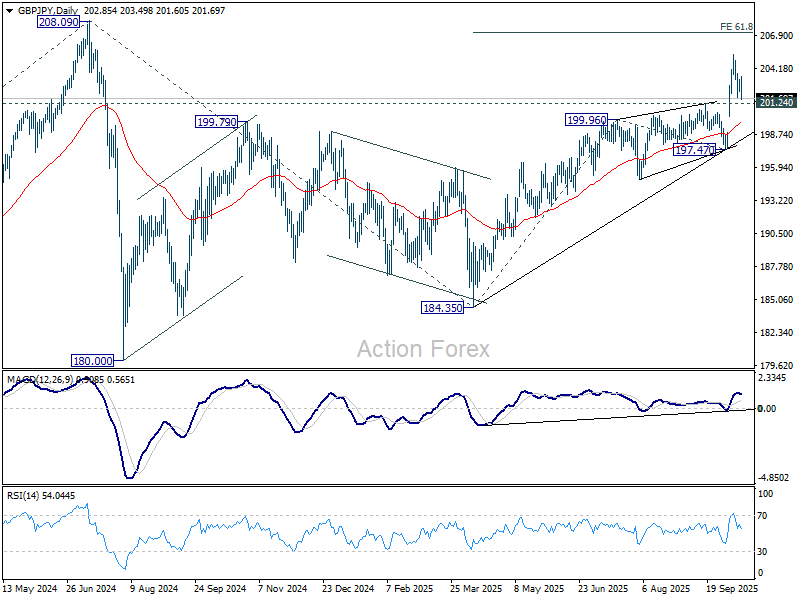
In the bigger picture, price actions from 208.09 (2024 high) are seen as a corrective pattern which might have completed at 184.35. Firm break of 208.09 high will resume the up trend from 123.94 (2020 low). Next target is 61.8% projection of 148.93 to 208.09 from 184.35 at 220.90. However, firm break of 197.47 will dampen this view and could extend the corrective pattern with another fall.
EUR/JPY Daily Outlook
Daily Pivots: (S1) 175.77; (P) 176.34; (R1) 176.79; More...
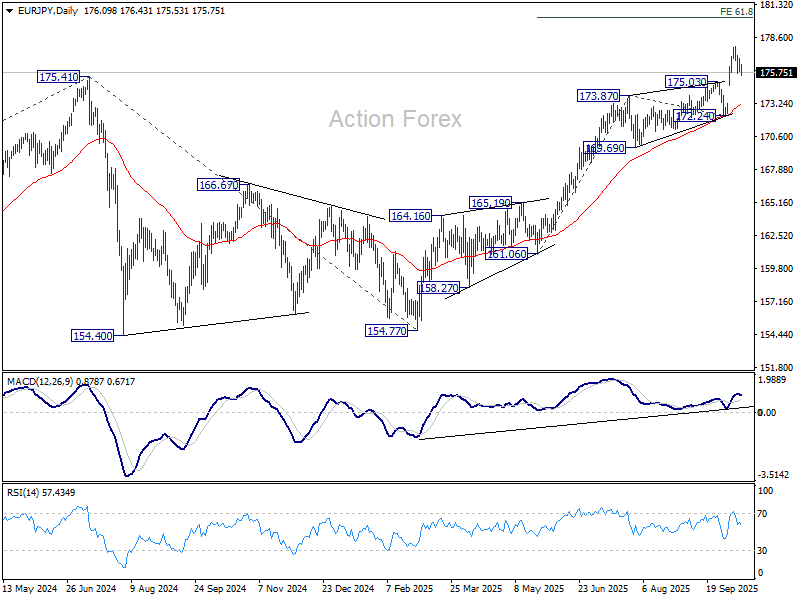
Intraday bias stays neutral in EUR/JPY and more consolidations could be seen. Further rise is expected as long as 175.03 resistance turned support holds. On the upside, break of 177.91 will target 61.8% projection of 161.06 to 173.87 from 172.24 at 180.15 next. However, firm break of 175.03 will confirm short term topping and bring deeper fall back to 172.24 support.
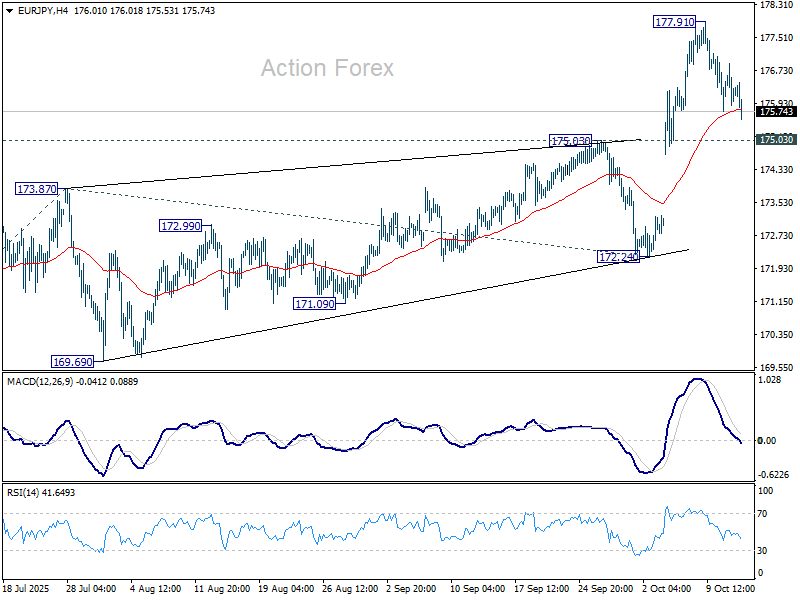
In the bigger picture, up trend from 114.42 (2020 low) is in progress and should target 61.8% projection of 124.37 to 175.41 from 154.77 at 186.31. Firm break of 172.24 support will suggests that it has turned into consolidations again. But still, outlook will continue to stay bullish as long as 55 W EMA (now at 167.16) holds, even in case of deep pullback.
EUR/GBP Daily Outlook
Daily Pivots: (S1) 0.8664; (P) 0.8687; (R1) 0.8701; More…
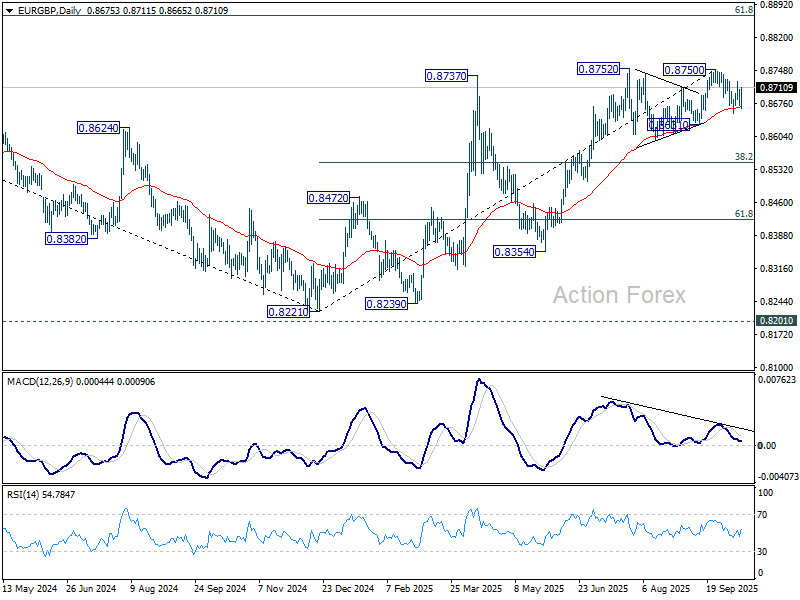
Intraday bias in EUR/GBP is turned neutral first. More range trading could be seen. On the upside, firm break of 0.8750 will resume larger rally towards 0.8867 fibonacci level. On the downside, break of 0.8654 will resume the fall from 0.8750 to 0.8631 support next.
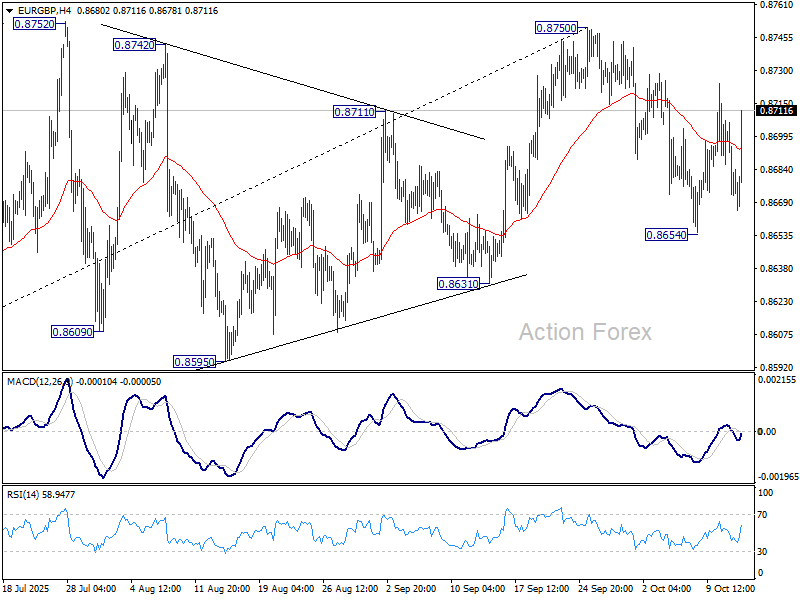
In the bigger picture, rise from 0.8221 medium term bottom is seen as a corrective move. While further rally cannot be ruled out, upside should be limited by 61.8% retracement of 0.9267 to 0.8221 at 0.8867. Considering bearish divergence condition in D MACD, firm break of 0.8631 support will be the first sign that this corrective bounce has completed. Sustained trading below 55 W EMA (now at 0.8550) will confirm, and bring retest of 0.8221 low.
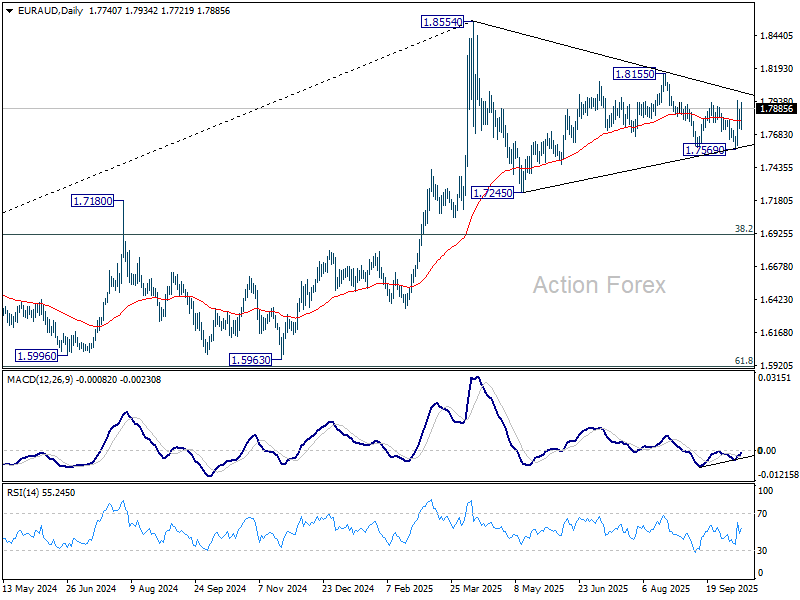
EUR/AUD Daily Outlook
Daily Pivots: (S1) 1.7703; (P) 1.7793; (R1) 1.7849; More...
Despite some volatility, intraday bias in EUR/AUD stays on the upside at this point. Fall from 1.8155 could have completed at 1.7569 already. Further rise should be seen to 18155 resistance. Firm break there will argue that whole corrective pattern from 1.8554 has also completed and bring retest of this high. On the downside, below 55 4H EMA (now at 1.7744) will turn bias neutral and mix up the outlook.
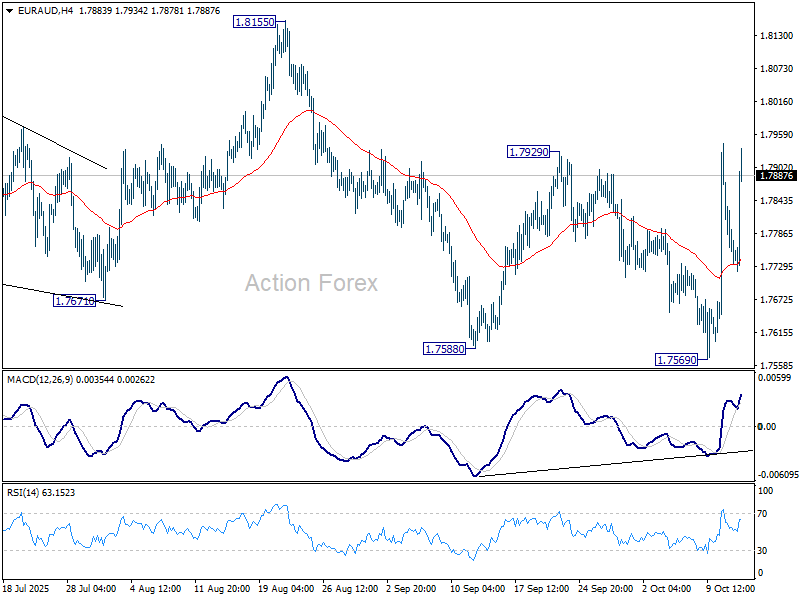
In the bigger picture, price actions from 1.8554 medium term top are seen as a corrective pattern. Deeper fall could be seen as the pattern extends, but downside should be contained by 38.2% retracement of 1.4281 (2022 low) to 1.8554 at 1.6922 to bring rebound. Uptrend from 1.4281 is expected to resume at a later stage.
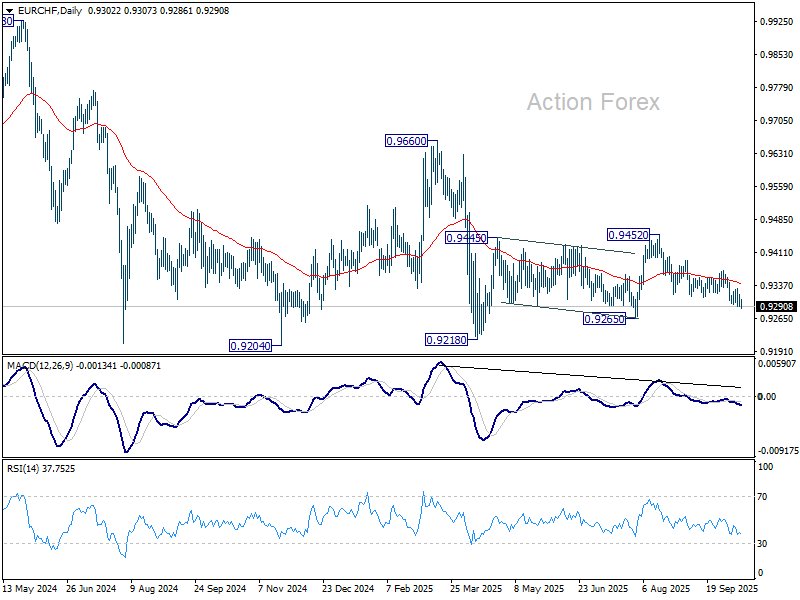
EUR/CHF Daily Outlook
Daily Pivots: (S1) 0.9290; (P) 0.9306; (R1) 0.9319; More...
Intraday bias in EUR/CHF stays on the downside, as fall from 0.9452 is in progress for 0.9265 support. Firm break there should confirm that whole corrective rebound from 0.9218 has completed at 0.9452, and deeper fall should be seen to 0.9204/18 support zone. For now, risk will stay on the downside as long as 0.9330 resistance holds, in case of recovery.
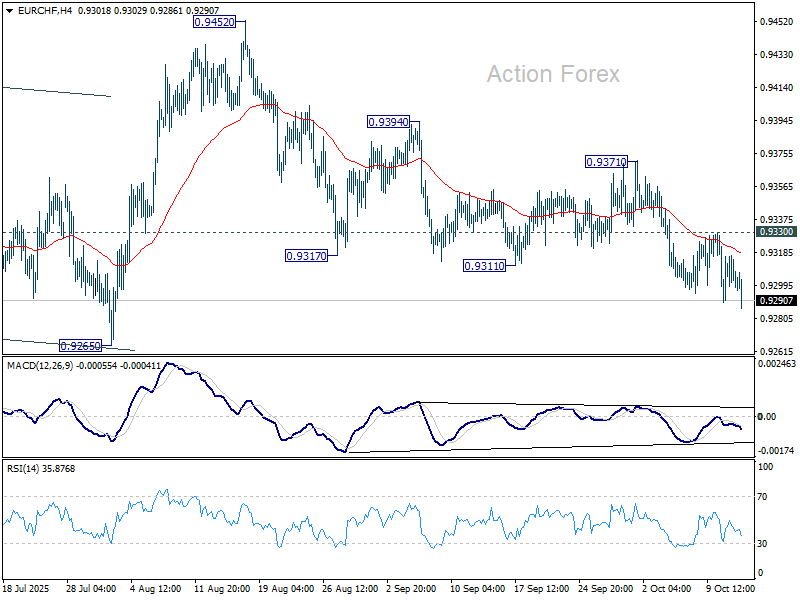
In the bigger picture, the down trend from 0.9204 (2018 high) might still be in progress considering that EUR/CHF is staying well inside the long term falling channel. Bearishness is reaffirmed by rejection at 55 W EMA (now at 0.9405). Firm break of 0.9204 will confirm down trend resumption. On the upside, break of 0.9452 resistance is needed to be the first sign of bullish reversal, and break of 0.9660 is needed to confirm.
Asian Stock Markets Missed the Risk-On Boat
Markets
Dip-buyers already emerged yesterday, encouraged by the US administration that kept the option for trade talks with China open over the weekend. Of the 3.4% stock slide in the US (Nasdaq) after Trump threatened a 100% levy on Chinese goods, some 2.2% was recovered. European equities rose about 0.7% (EuroStoxx50). The US dollar strengthened too, reversing most of Friday’s decline. EUR/USD revisited the recent lows around 1.157. The trade-weighted index bounced back to north of 99 and USD/JPY went from 151.2 on Friday’s close to 152.3. The Australian dollar outperformed due to strong links with major trading partner China. We should add though that moves happened against the backdrop of a partially closed US market. Bond markets were shut for Columbus Day. Net daily changes in European rates were limited to less than 2 bps across the curve. French bonds slightly underperformed European peers after Lecornu II was born over the weekend. Certain commodities were very well bid. Copper, platinum and palladium all rose. Gold and silver surged to new all-time highs amid ongoing talk of what is dubbed the debasement trade. It’s in essence investors shifting away from fiat currencies into hard & scarce assets for reasons varying from runaway budgets over inflation worries to speculation that central banks will one day (have to) start the money printers again.
Asian stock markets missed the risk-on boat, driven amongst others by China imposing sanctions on 5 US-related firms in response to US probes against Chinese maritime, logistics and shipbuilding industries. Chinese stocks slip but Japanese ones underperform due to a JPY rally. French politics take center stage later today. Lecornu will present a draft budget to his cabinet this morning with a speech scheduled this afternoon (3 PM) before parliament. It’s a critical moment that will decide over the fate of his freshly installed government. The far left and right have already vowed to topple the government, regardless of the budget contents. Lecornu’s survival depends on the abstention by some of Les Républicains and the Socialist Party. The latter amongst others uses its outsized leverage to demand a wealth tax, higher company taxes, smaller budget cuts and a suspension of one of president Macron’s flagship pension reforms. Chances of Lecornu II not making it by the end of the week remain uncomfortably high. Euro and OAT underperformance are likely. The pound loses in a first reaction to the labour market data this morning. Both earnings and employment growth fell short of expectations while the unemployment rate ticked higher to 4.8%, a four year high. EUR/GBPrises to 0.87. The Q3 earnings seasons kicks off with the biggest of US financial firms.
News & Views
UK retail sales growth (same store sales) slowed from 2.9% Y/Y in August to 2% Y/Y in September (vs 2.5% consensus). Details showed both food (3.8% Y/Y from 4.2%) and non-food (0.5% Y/Y from 1.8%) sales growth slowing. Electrical sales were buzzing thanks to new Apple releases while milder weather delayed refreshing autumn and winter wardrobes. The CEO of the British Retail Consortium said that retail spending rose more slowly than in recent months with the (November) budget looming large and households facing higher bills: “Rising inflation and a potentially taxing budget is weighing on the minds of many households planning their Christmas spending. Retailers also face difficult decisions about investment and hiring over the Golden Quarter given uncertainty over business rates bills arriving in April (new business rates surtax).”
Japan’s main opposition parties are likely to meet today to discuss the possibility of rallying behind a unified candidate to take on the new LDP-leader in a parliamentary vote on becoming the new PM. LDP Takaichi’s road to succeeding PM Ueda hit a first road block last week when LDP’s junior coalition partner Komeito decided to end their understanding. Yuichiro Tamaki, leader of the small but rapidly growing Democratic Party for the People (DPP), would be the opposition’s joint candidate. He shares a platform with Japan’s main opposition party (CDP) and the Japan innovation party (Ishin) with a clear promise to raise people’s take-home pay. Both LDP and the trio of DPP-CDP-Ishin would rule a minority government, but the opposition block (210) outvotes LDP (196) when it comes to securing the next PM. If Komeito were to flip sides completely, they could have a razor-thin majority in Japan’s key lower house (234 vs 233 threshold). If Tamaki were to succeed in his PM bid, it would be the first time since 2009 that LDP was forced to the opposition.
UK payrolled employment falls -10k, but wages growth still firm
The latest U.K. labor market figures painted a mixed picture for September, highlighting a slowdown in hiring momentum alongside still-solid wage growth. Payroll employment fell by -10k. Claimant count rose sharply by 25.8k, well above expectations for a modest 10.3k increase.
At the same time, wage growth remains resilient, albeit easing from its prior peak. Median monthly pay increased by 5.5% yoy, down from 6.5% in August but still within the tight range seen since the start of the year.
Over the three months to August, unemployment rate ticked up to 4.8%, slightly higher than the expected 4.7%. Meanwhile, average earnings including bonuses rose 5.0% yoy, beating forecasts of 4.7% yoy. Pay growth excluding bonuses slowed to 4.7% yoy, in line with expectations.
Overall, the figures reinforce the view of a gradual cooling in the labor market rather than a sharp deterioration. Elevated wage pressures will remain a key concern for the BoE.


US CPI Will Be Released Despite Government Furlough
In focus today
In the euro area, focus turns to the German ZEW index which is one of the first sentiment indicators for October. The indicator has declined in recent months due to both weaker economic assessments and expectations in contrast to the rising PMIs. We expect a small improvement in the index in October.
In the UK, the monthly labour market report is released. Employment has declined throughout the year, but the pace has been very modest. Wage growth has been edging lower but remains elevated. An accelerating job loss is probably needed to put a November cut from the Bank of England back on the table.
Overnight, China will release CPI and PPI for September. CPI moved into negative in August at -0.4% headline inflation. It was driven by lower food prices, though, and core inflation stood at 0.9%. In September we look for a small increase in headline CPI to -0.2% y/y while core inflation is expected to be flat. PPI will likely stay negative but move up from -2.9% y/y to around -2.5% y/y.
During the week, we will look for news on negotiations of a new coalition government in Japan. The parliamentary vote on the country's next PM was postponed after the small Buddhist party, Komeito, turned its thumps down on a continuation of the current LDP-Komeito coalition. The vote will likely take place on Monday.
Economic and market news
What happened yesterday
In the US, the Bureau of Labor Statistics (BLS) published a statement saying that the September CPI will be released on 24 October. The statement also iterated that no other releases will be rescheduled or produced until the resumption of regular government services. This implies that the CPI figures will be released during the FOMC blackout ahead of the October MP meeting.
In global trade, US Treasury Secretary Scott Bessent confirmed that President Trump remains on track to meet Chinese President Xi Jinping in South Korea later this month to discuss de-escalating trade tensions. Bessent noted that lines of communication have reopened, and the 100% tariffs announced on Friday could still be avoided if progress is made before 1 November. This, together with other comments received over the weekend and during Monday, largely helped keep markets calm during Monday's trade.
However, in a new escalation of the conflict, China stated that it has begun collecting additional port fees on US-linked vessels, while the US will impose similar fees starting today, 14 October. China's fees target US-linked ships but exempt Chinese-built vessels, while the US also specifically aims to counter China's dominance in global shipping and shipbuilding. Analysts estimate that China-owned container carrier COSCO could bear nearly half of the USD 3.2bn in expected industry costs by 2026.
In the Gaza War, Hamas freed the last Israeli hostages while Israel released nearly 2,000 Palestinian detainees under a US-brokered ceasefire. President Trump declared the war over in a speech to the Knesset, calling it a "long nightmare" for both sides. At a summit in Egypt, over 20 world leaders discussed the Gaza Strip's reconstruction and governance, but challenges remain, including aid delivery, governance, and recovering the remains of deceased hostages.
In geopolitics, Ukrainian President Zelenskiy is set to meet US President Trump on Friday in Washington to discuss air defence systems, the potential supply of long-range Tomahawk missiles, and a landmark drone technology-sharing deal. The talks come as Russia escalates strikes on Ukraine's energy infrastructure, forcing Kyiv to consider importing electricity. Discussions will also cover Ukraine's energy needs and shifting Russian tactics.
Equities: US equities rebounded on Monday following Friday's selloff. The S&P 500 rose 1.6% and the Nasdaq gained 2.2%, although the move was not enough to fully offset Friday's losses. European and Nordic markets saw more modest gains - the Stoxx 600 added 0.4% - but had also held up better into Friday's close. Overall, it was a classic rebound session, with sectors that underperformed on Friday leading the recovery, particularly US big tech. Futures in both the US and Europe are little changed this morning, so recouping the losses from Friday looks to take some time.
FI and FX: The US bond market was closed due to Columbus Day, but the equity market rallied as the trade tensions between US and China eased together with a de-escalation in the Middle East and a continued rally in AI stocks. European yields declined modestly and the spread between Germany and France stabilized, while the BTPS-Bund spread tightened.
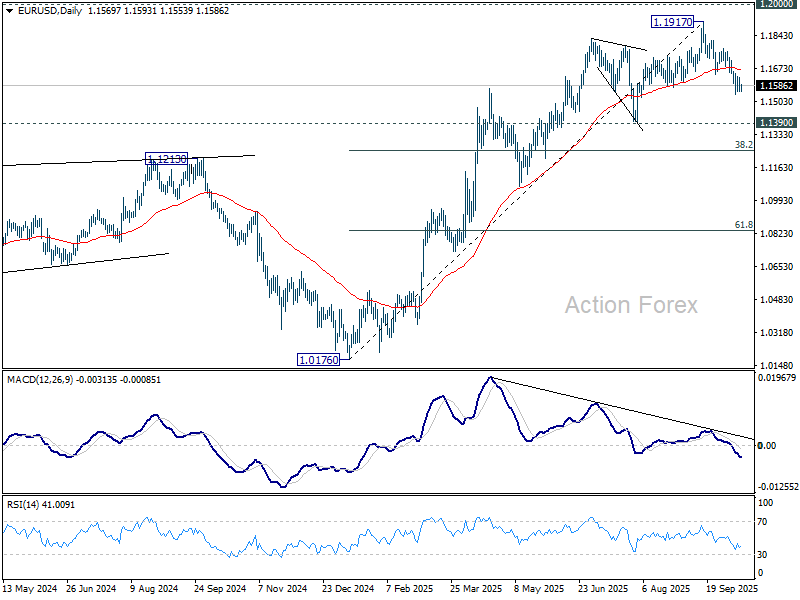
EUR/USD Daily Outlook
Daily Pivots: (S1) 1.1542; (P) 1.1586; (R1) 1.1614; More…
Intraday bias in EUR/USD remains neutral as consolidations continue above 1.1540. Deeper decline is expected as long as 1.1778 resistance holds. On the downside, break of 1.1540 will resume the fall from 1.1917 to 1.1390 , or further to 38.2% retracement of 1.0176 to 1.1917 at 1.1252.
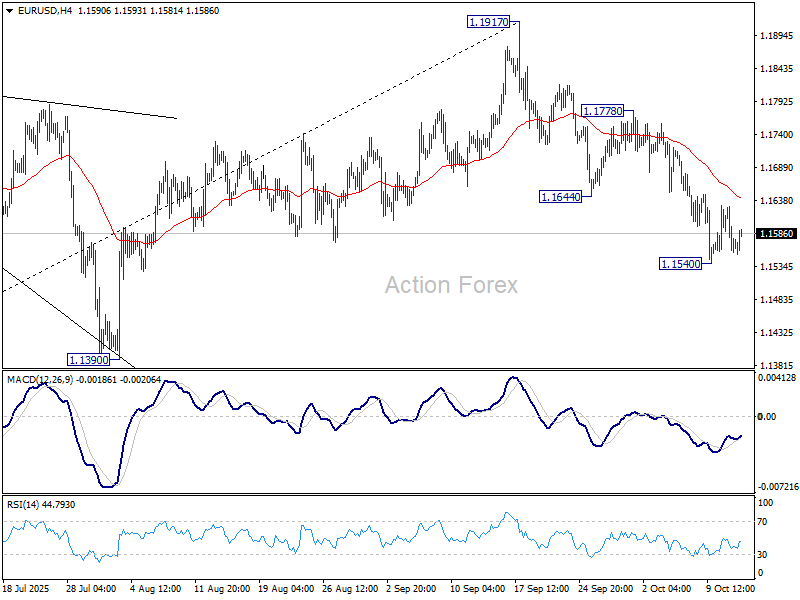
In the bigger picture, considering bearish divergence condition in D MACD, a medium term top is likely in place at 1.1917, just ahead of 1.2 key psychological level. As long as 55 W EMA (now at 1.1274) holds, the up trend from 0.9534 (2022 low) is still extended to continue. Decisive break of 1.2000 will carry larger bullish implications. However, sustained trading below 55 W EMA will argue that rise from 0.9534 has completed as a three wave corrective bounce, and keep outlook bearish.
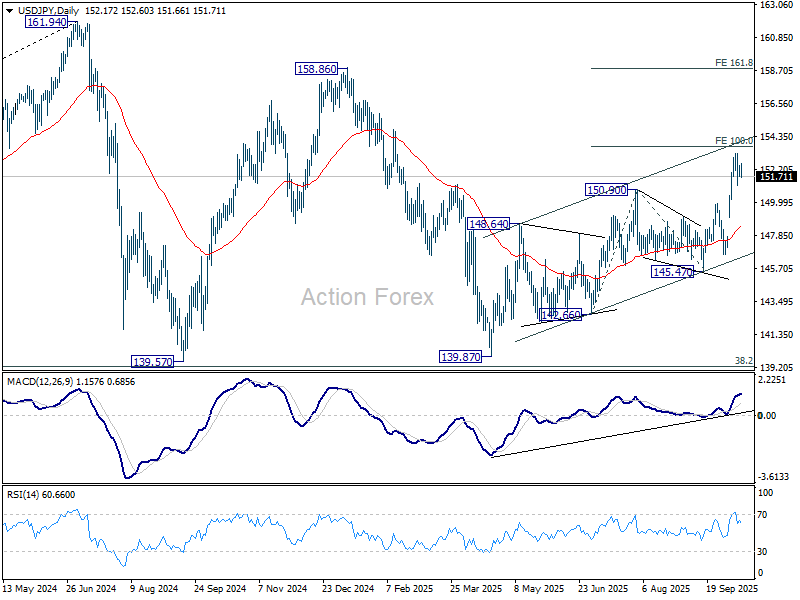
USD/JPY Daily Outlook
Daily Pivots: (S1) 151.86; (P) 152.16; (R1) 152.59; More...
Intraday bias in USD/JPY remains neutral and more consolidations could be seen below 153.26. Downside should be contained above 149.95 resistance turned support. Break of 153.26 will target 100% projection of 142.66 to 150.90 from 145.47 at 153.71. Firm break there will pave the way to 161.8% projection at 158.80. However, decisive break of 149.95 will bring deeper pullback to 55 D EMA (now at 148.48) instead.
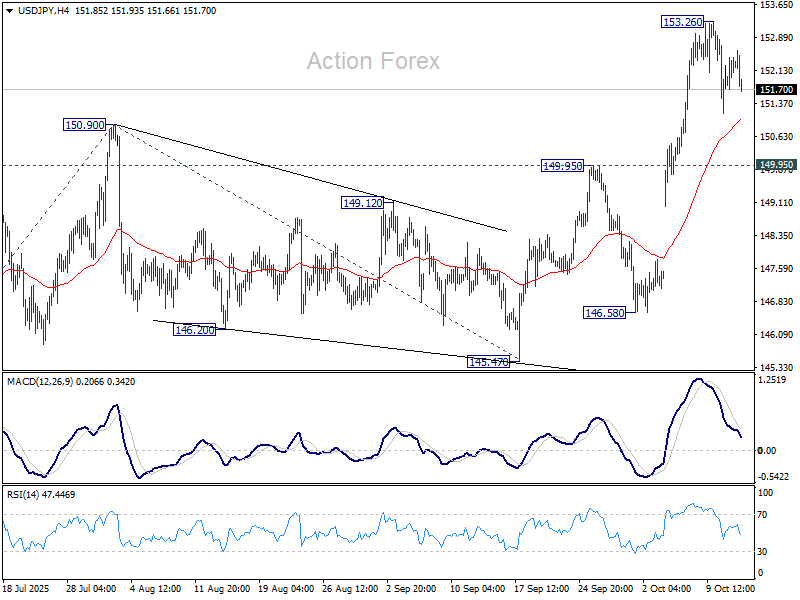
In the bigger picture, current development suggests that corrective pattern from 161.94 (2024 high) has completed with three waves at 139.87. Larger up trend from 102.58 (2021 low) could be ready to resume through 161.94 high. On the downside, break of 145.47 support will dampen this bullish view and extend the corrective pattern with another falling leg.