
Sample Category Title
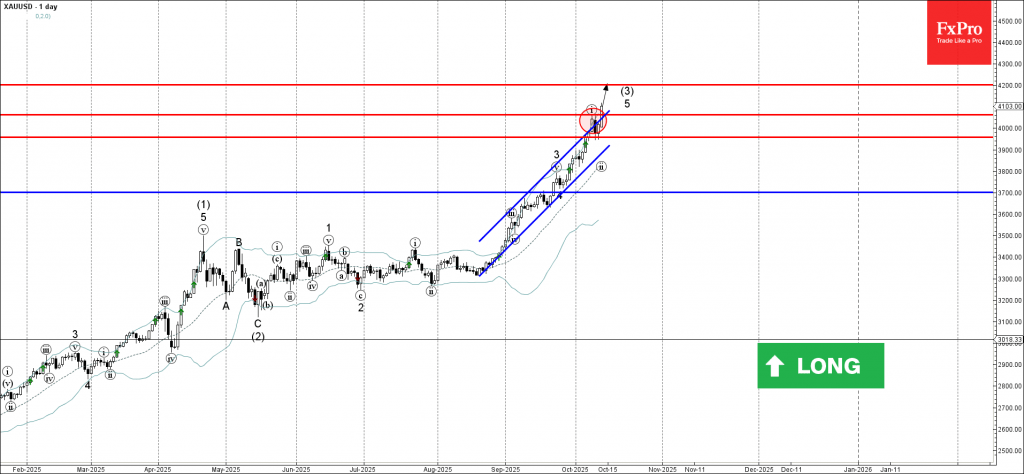
Gold Wave Analysis
Gold: ⬆️ Buy
- Gold broke resistance zone
- Likely to rise to resistance level 4200.00
Gold recently broke the resistance zone between the key resistance level 4060.00 (which stopped the previous impulse wave i) and the resistance trendline of the daily up channel from August.
The breakout of this resistance zone accelerated the active impulse waves 5 and (3).
Given the strong daily uptrend, Gold can be expected to rise to the next resistance level 4200.00 (target for the completion of the active impulse waves 5 and (3)).
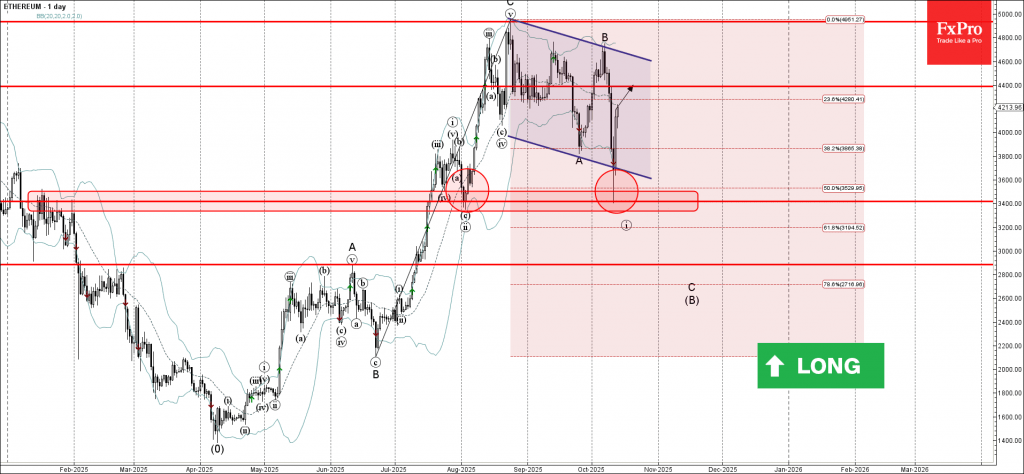
Ethereum Wave Analysis
Ethereum: ⬆️ Buy
- Ethereum reversed from the support zone
- Likely to rise to resistance level 4400.00.
Ethereum cryptocurrency recently reversed up from the support zone between the key support level 3400.00 (which also reversed the price in August), lower daily Bollinger Band and the 50% Fibonacci correction of the upward impulse from June.
The upward reversal from this support zone created the daily Japanese candlesticks reversal pattern Bullish Engulfing.
Given the clear daily uptrend, Ethereum cryptocurrency can be expected to rise to the next resistance level 4400.00.
Sunset Market Commentary
Markets
Tensions between the US and China eased over the weekend after Friday evening’s dramatic turn of events in which US President Trump slapped China with an additional 100% tariff from November 1st over export restrictions for rare earth commodities. Vice-president JD Vance and Trump later indicated that negotiations are ongoing. US Treasury Secretary Bessent, the soothing market voice, indicated that to his knowledge, the Trump-Xi Jinping meeting is still on. Both leaders are scheduled to meet in person on the sidelines of the Asia-Pacific Economic Corporation (APEC) Summit which will be held in the South Korean city of Gyeongju on October 31-November 1st. It will be the first face-to-face meeting since 2019 and the first during Trump’s second term. Today’s more constructive tone helps erasing (part of) Friday evening’s panic move. We’d err on the side of caution though with US trading volumes thinned by Columbus Day holiday and as we don’t think the tit-for-that game between the US and China is already over. EUR/USD slides back from a start at 1.1613 to currently 1.1567. The trade-weighted dollar returns north of 99. European stock markets regain 0.5% after Friday’s beating but intraday sentiment is dwindling. Key US equity gauges opened over 1% stronger.
Today’s eco calendar was empty on both sides of the Atlantic. French politics captured some headlines as PM Lecornu and his cabinet rush to pass a budget, but risk being ambushed by several confidence votes. Snap elections are an accident waiting to happen, but not yet top of mind of investors. A flurry of central bankers take parole this week with hawkish Bank of England member Greene kicking off festivities. She strongly advocates keeping UK rates unchanged into 2026 as she’s worried over the slowing disinflation process, risks of second-round effects, elevated food prices and their impact on household inflation expectations and the fact that monetary policy isn’t actually restrictive in her view. BoE Greene’s hawkish views are known in the split BoE where governor Bailey probably holds the key vote in deciding either on the status quo or the rate cut at the November 6 policy meeting. He’s scheduled to speak tomorrow on the sidelines of the annual IMF and Worldbank meetings. Before he does, the UK Office for National Statistics publishes its latest labour market report. One of Bailey’s concerns is that situation on the UK labour market is worse than some numbers suggest. EUR/GBP followed EUR/USD south today, moving from levels just north of 0.87 to 0.8675 currently.
News & Views
Indian inflation slowed to 1.54 % Y/Y in September from 2.07% Y/Y in August. This marks the lowest Y/Y-reading since June 2017. According to the Ministry of Statistics, the decline in headline inflation and food inflation during the month of September is mainly attributed to favorable base effects and to a decline in food prices (-0.49% M/M). Food prices also were 2.28% lower compared to the same month last year. The RBI targets inflation to stay within a 2%-6% band. However other non-food components still showed higher price rises including 2.28% Y/Y for clothing and footwear, 3.98% for housing and 1.98% for fuel and light. Other miscellaneous (weight 26% of the index) still rose 5.35%. In this respect, Bloomberg calculates core inflation(excluding volatile food and energy prices) at 4.58% up from 4.21% in August. Even so, further impact of the consumer tax overhaul end September might slow inflation further and open the path for the Reserve Bank of India to cut the policy rate further in December (currently 5.5%) in order to support the economy as it suffers from US tariffs. The rupee is holding near all-time low levels against the dollar near USD/INR 88.67.
In its monthly oil market report, OPEC sees global oil demand growth for 2025 unchanged from previous month at around 1.3 mb/d, y-o-y. In 2026, global oil demand is forecast to grow by around 1.4 mb/d, y-o-y, also unchanged from last month’s assessment. OPEC indicated that the outlook for rising demand for oil comes as the global economy maintained its stable economic growth trajectory, supported by the consistent and strong momentum observed in 1H25. OPEC expects production of countries not participating in OPEC to grow by 0.8mb/day and to come in at 0.6mb/d next year, with Brazil, Canada, the US and Argentina as the main drivers. OPEC says that crude oil production by countries participating in the DoC increased by 630 tb/d in September, m-o-m, to average about 43.05 mb/d. Demand for 2026 Opec+ production is seen rising from 42.5mb/d to 43.1mb/d next year. Brent oil today rebounds marginally after the risk-off decline (trade tensions) on Friday (currently $63.2/b).
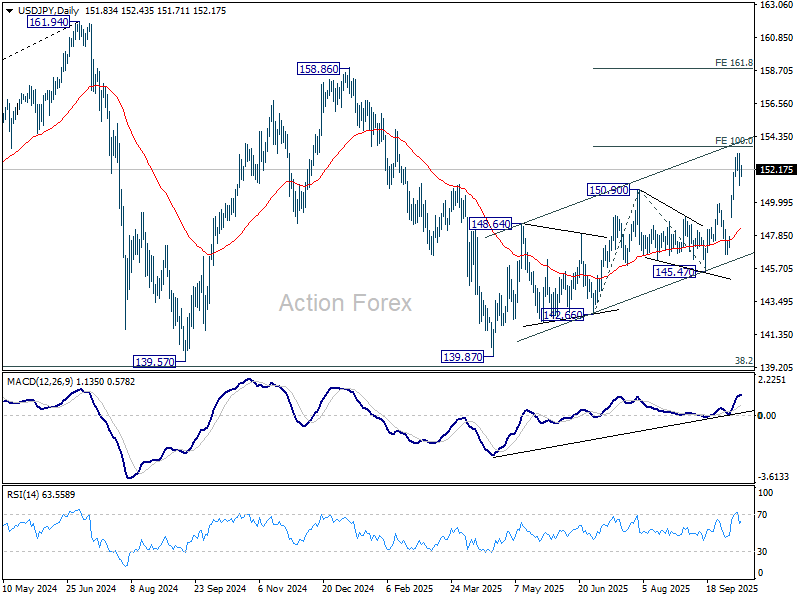
USD/JPY Mid-Day Outlook
Daily Pivots: (S1) 150.47; (P) 151.87; (R1) 152.58; More...
USD/JPY is staying in consolidations below 153.26 and intraday bias stays neutral. Downside should be contained above 149.95 resistance turned support. Break of 153.26 will target 100% projection of 142.66 to 150.90 from 145.47 at 153.71. Firm break there will pave the way to 161.8% projection at 158.80. However, decisive break of 149.95 will bring deeper pullback to 55 D EMA (now at 148.22) instead.
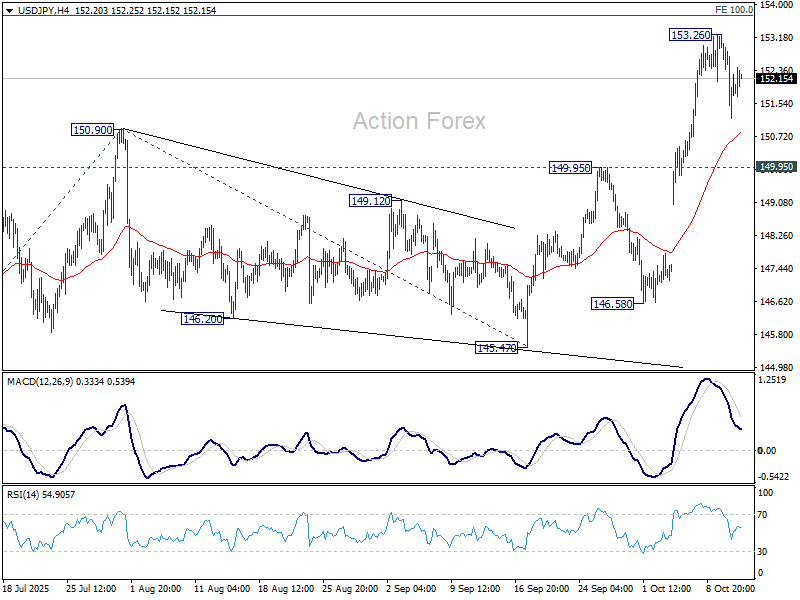
In the bigger picture, current development suggests that corrective pattern from 161.94 (2024 high) has completed with three waves at 139.87. Larger up trend from 102.58 (2021 low) could be ready to resume through 161.94 high. On the downside, break of 145.47 support will dampen this bullish view and extend the corrective pattern with another falling leg.
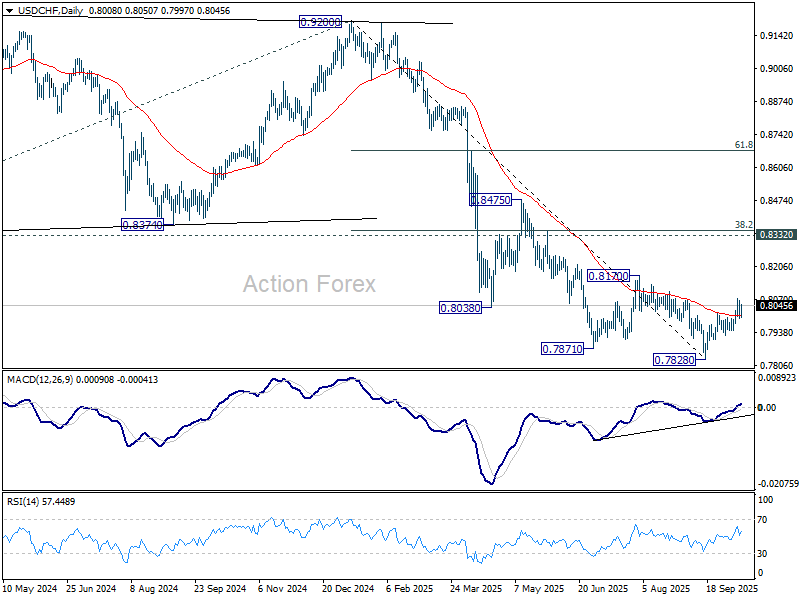
USD/CHF Mid-Day Outlook
Daily Pivots: (S1) 0.7963; (P) 0.8019; (R1) 0.8050; More…
USD/CHF is staying in consolidations below 0.8075 temporary top and intraday bias remains neutral. Price actions from 0.7828 are currently seen as correcting whole fall from 0.9200. Above 0.8075 will target 0.8170 resistance next. On the downside, though, break of 0.7944 support will bring retest of 0.7828 low instead.
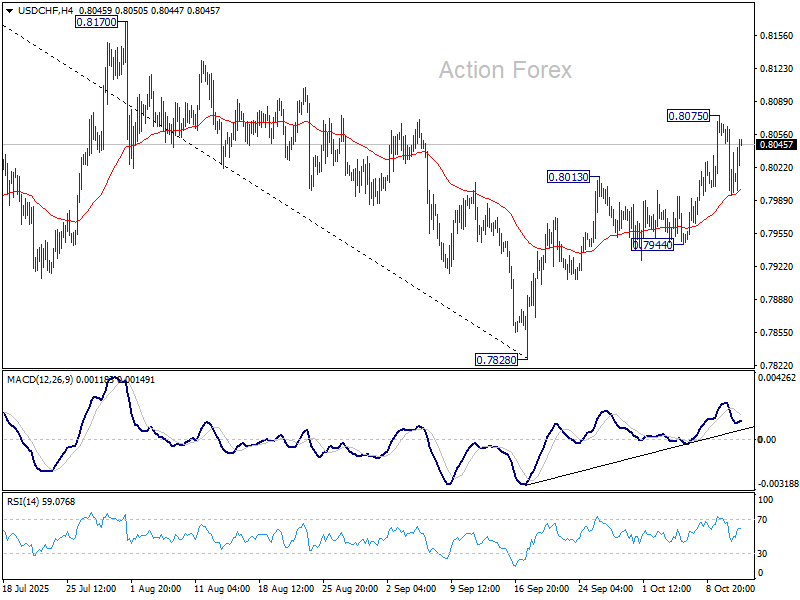
In the bigger picture, long term down trend from 1.0342 (2017 high) is still in progress. Next target is 100% projection of 1.0146 (2022 high) to 0.8332 from 0.9200 at 0.7382. In any case, outlook will stay bearish as long as 0.8332 support turned resistance holds (2023 low).
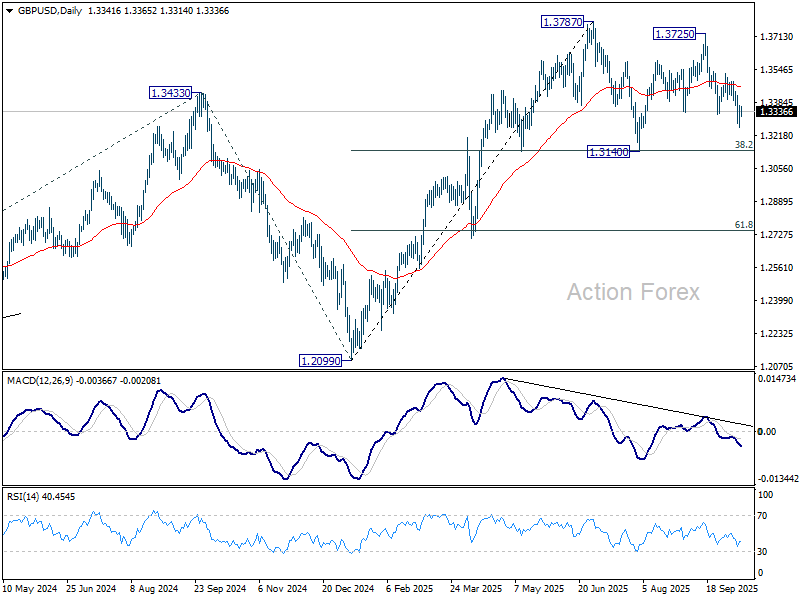
GBP/USD Mid-Day Outlook
Daily Pivots: (S1) 1.3290; (P) 1.3329; (R1) 1.3395; More...
GBP/USD is staying in consolidations above 1.3260 temporary low and intraday bias remains neutral. Overall outlook is unchanged that corrective pattern from 1.3787 is extending. Below 1.3260 will bring deeper decline but strong support should be seen from 1.3140 cluster (38.2% retracement of 1.2099 to 1.3787 at 1.3142) to contain downside. On the upside, break of 1.3526 will bring stronger rally back to retest 1.3728/87 resistance zone.
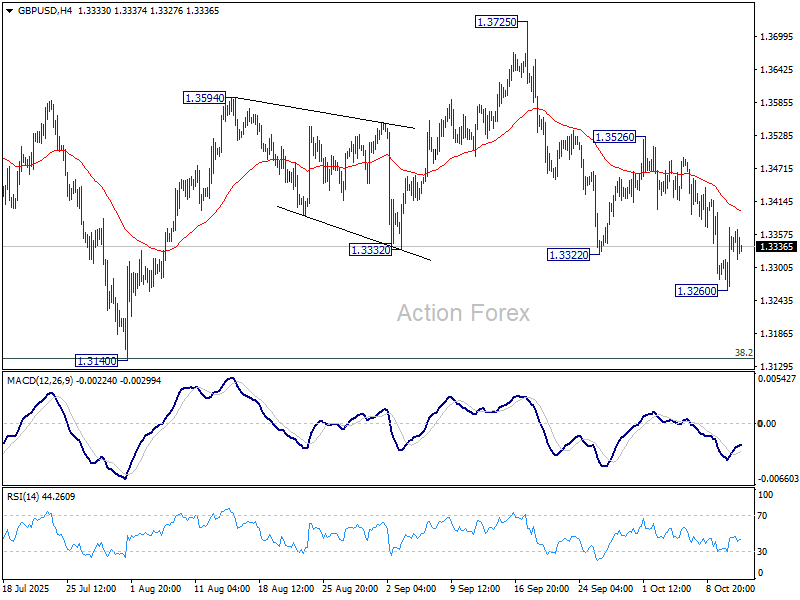
In the bigger picture, rise from 1.0351 (2022 low) is still seen as a corrective move. Further rally could be seen to 61.8% projection of 1.0351 to 1.3433 (2024 high) from 1.2099 (2025 low) at 1.4004. But strong resistance could emerge from 1.4248 (2021 high) to limit upside. Sustained break of 55 W EMA (now at 1.3173) will argue that a medium term top has already formed and bring deeper fall back to 1.2099.
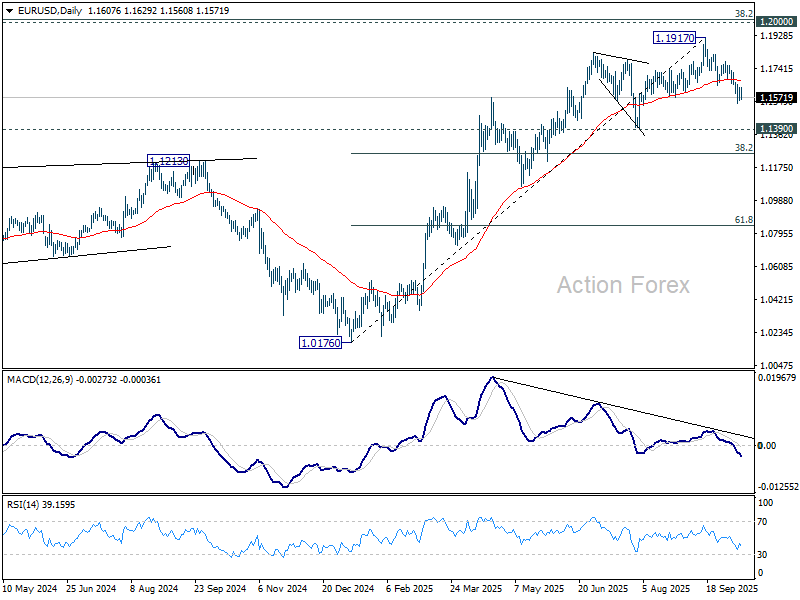
EUR/USD Mid-Day Outlook
Daily Pivots: (S1) 1.1573; (P) 1.1601; (R1) 1.1651; More…
EUR/USD dips mildly today but stays above 1.1540 temporary low. Intraday bias remains neutral for more consolidations. Deeper decline is expected as long as 1.1778 resistance holds. On the downside, break of 1.1540 will resume the fall from 1.1917 to 1.1390 , or further to 38.2% retracement of 1.0176 to 1.1917 at 1.1252.
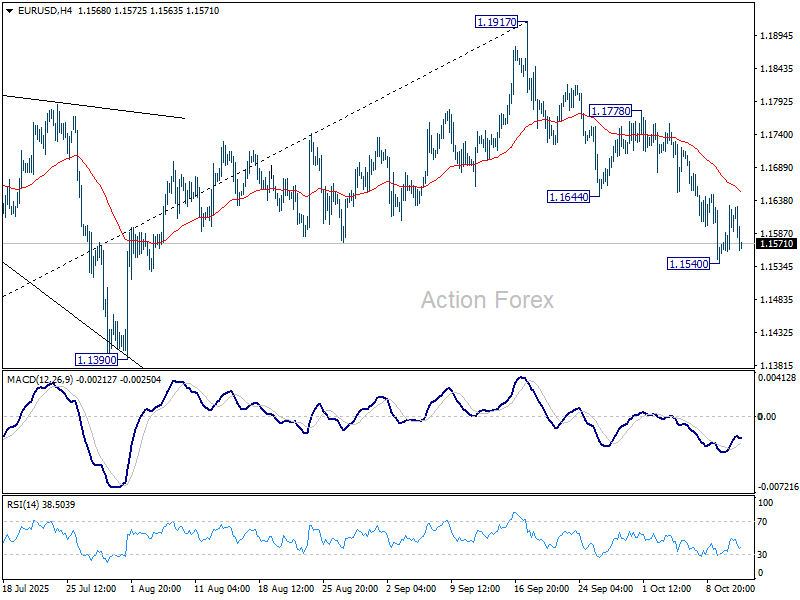
In the bigger picture, considering bearish divergence condition in D MACD, a medium term top is likely in place at 1.1917, just ahead of 1.2 key psychological level. As long as 55 W EMA (now at 1.1247) holds, the up trend from 0.9534 (2022 low) is still extended to continue. Decisive break of 1.2000 will carry larger bullish implications. However, sustained trading below 55 W EMA will argue that rise from 0.9534 has completed as a three wave corrective bounce, and keep outlook bearish.
Calm Returns as Markets Bet on U.S.–China De-escalation
Global markets were notably calmer today as investors looked past last week’s turbulence and welcomed signs of a tentative thaw in U.S.–China trade relations. Asian stocks, which opened sharply lower, managed to recover most of their earlier losses by the close, while both European indexes and U.S. futures traded higher. The relative calm suggested that sentiment, while still cautious, was no longer gripped by fears of an immediate escalation in the trade conflict.
The improved mood followed remarks from U.S. Treasury Secretary Scott Bessent, who confirmed that President Donald Trump remains on track to meet with Chinese President Xi Jinping at the APEC summit in South Korea later this month. Bessent told Fox Business that the two sides have engaged in substantial communications over the weekend and that tensions have “substantially de-escalated” since Friday’s exchange of threats.
Bessent emphasized that the planned 100% tariffs on Chinese imports would not take effect until November 1, leaving a window for diplomacy. Dialogue channels remain open, while staff-level meetings will take place in Washington this week on the sidelines of the World Bank and IMF annual gatherings. These discussions could lay the groundwork for progress before the leaders’ meeting.
While Bessent struck a reassuring tone, he maintained that Washington retains leverage should diplomacy fail. “If not, we have substantial levers we can pull,” he warned, adding that “we could move more aggressively than China has” and that “everything’s on the table.”
In the currency markets, most major pairs were confined within Friday’s ranges. Dollar traded on the firmer side, joined by Aussie and Kiwi, while Swiss Franc, Yen, and Euro softened slightly. Sterling and Loonie hovered in mid-range positions.
In Europe, at the time of writing, FTSE is down -0.05%. DAX is up 0.35%. CAC is up 0.18%. UK 10-year yield is down -0.013 at 4.66. Germany 10-year yield is down -0.013 at 2.633. Earlier in Asia, Japan was on holiday. Hong Kong HSI lost -1.52%. China Shanghai SSE fell -0.19%. Singapore Strait Times fell -0.84%.
Greene says BoE should skip some rounds of rate cuts to tame inflation
BoE policymaker Megan Greene sounded a hawkish note today, warning that interest rates may need to stay elevated for an extended period to ensure inflation is fully subdued. She said monetary policy is “less restrictive than it had been,” a worrying sign given that price growth has shown renewed momentum over the past year.
While Greene believes the disinflation process “remains intact,” she expressed concern that it is losing pace, adding that inflation’s earlier spike above 11% has likely reshaped consumer and business behavior.
Ahead of Tuesday’s key U.K. wage and jobs data, Greene said the labor market appears to be stabilizing after a mild slowdown, having avoided the sharp deterioration some had feared earlier in the year. That resilience, combined with lingering inflation pressures, supports the case for patience before cutting rates again.
To ensure inflation is fully defeated, Greene argued that the Bank Rate should be “more restrictive than the market curve”, but without undermining the BoE’s credibility by alternating between hikes and cuts. Instead, she said the preferable path would be to keep rates "higher for longer", and "skipping some rounds in terms of rate cuts."
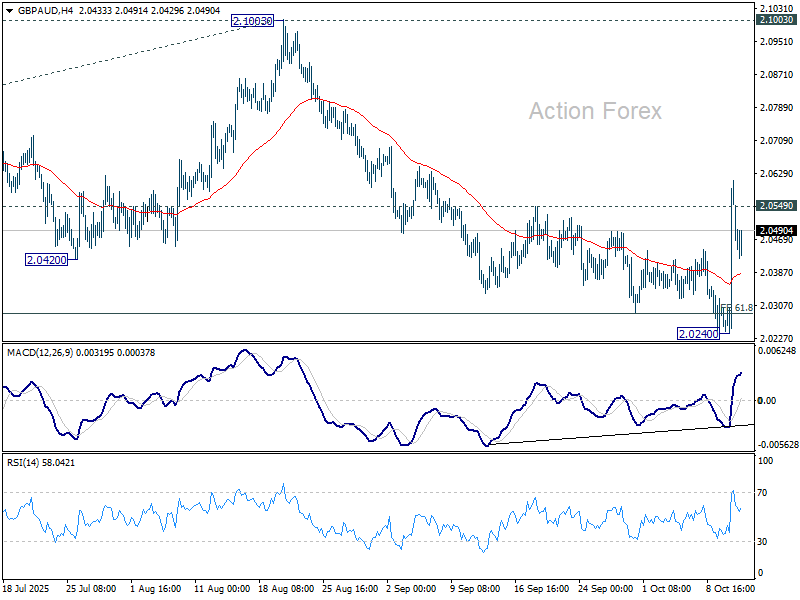
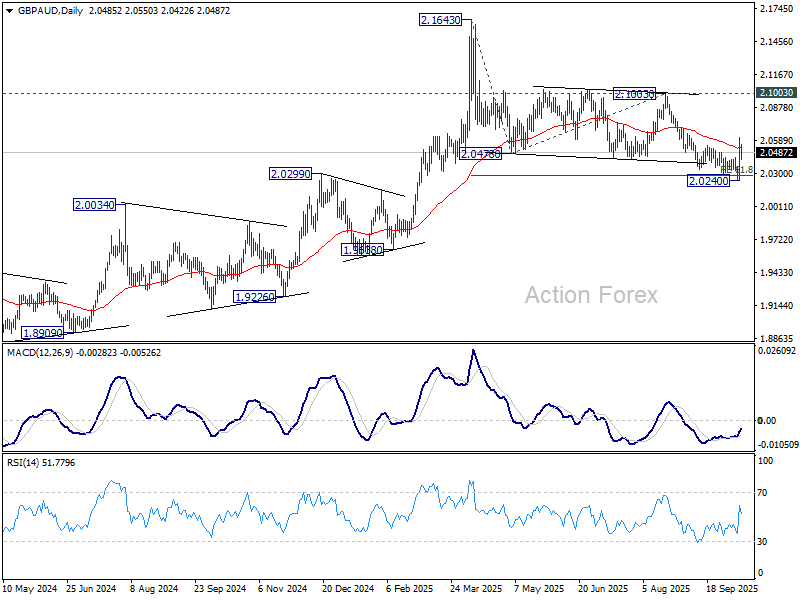
GBP/AUD in focus ahead of key UK, Australia events; Near-term upside bias holds
GBP/AUD will be a pair to watch this week as a string of key economic releases from both the U.K. and Australia promise to inject volatility. There will be RBA meeting minutes and U.K. labor market data on Tuesday, followed by Australian employment and U.K. GDP figures on Thursday. The cross has already shown renewed strength, rebounding firmly after a period of weakness, and traders are positioning for fresh direction from the incoming data.
Australian Dollar endured a setback late last week after the U.S.–China trade war flared up again, sending risk sentiment tumbling. Yet, the currency has stabilized on Monday, suggesting that markets are refocusing on domestic fundamentals rather than external shocks. Attention now turns to whether the RBA’s November policy meeting will bring another rate cut, a decision clouded by conflicting economic signals.
Recent data indicate that Australia’s economy is regaining momentum, supported by stronger consumer spending and rising house prices. However, this recovery has been accompanied by slower employment growth and upside surprises in inflation, leaving the RBA in a delicate position. Policymakers must weigh whether the rebound is sustainable enough to delay further easing, or if lingering labor market slack warrants additional stimulus. Tomorrow’s employment report and the Q3 CPI later in the month could tip the balance either way.
In the U.K., the policy outlook is equally nuanced. The BoE’s Monetary Policy Committee remains split, though the hawkish voices have grown louder in recent weeks. Chief Economist Huw Pill underscored that monetary policy should stay “resolutely focused on price stability,” while MPC member Catherine Mann argued for keeping rates restrictive despite weak consumption, warning that high inflation continues to weigh heavily on households.
Still, policymakers have stressed that their stance will remain data-dependent, placing a spotlight on Tuesday’s labor data—particularly wage growth—as a key input ahead of the next meeting. A firmer set of figures could reinforce the BoE’s cautious approach toward easing, lending further support to Sterling against the Aussie.
Technically, GBP/AUD's rebound and break of 2.0549 resistance suggests that a short term bottom was already formed at 2.0240, on bullish convergence condition in 4H MACD. It's also possibly that fall from 2.6143 (April high) has completed as a three-wave correction after hitting 61.8% projection of 2.1643 to 2.0478 from 2.1003 at 2.0283. For now, risk will stay mildly on the upside as long as 2.0240 support holds. Sustained trading above 55 D EMA (now at 2.0524) will affirm this bullish case, and target 2.1003 resistance for confirmation.
China trade in September, exports and imports surge, surplus narrows
China’s trade figures for September delivered a mixed picture. Exports rose 8.3% yoy, well above forecasts of 6.0% and marking the fastest pace in six months. Imports jumped 7.4% yoy, the strongest gain since April 2024 and far exceeding expectations of 1.5%.
However, the details showed signs of strain beneath the surface. Exports of rare earths—a key strategic material—fell -30.9% from August to 4,000 tonnes, the lowest level since February, amid tighter export restrictions. Meanwhile, soybean imports surged to the second-highest level on record, boosted by heavy purchases from South America as buyers avoided U.S. supplies in response to the escalating trade conflict.
Overall, China’s trade surplus narrowed to USD 90.5B from USD 102.3B, undershooting expectations of USD 98.5B. The surplus with the U.S. widened to USD 22.8B, even as total bilateral trade continued to shrink—exports to the U.S. fell nearly -17% in the first three quarters, while imports declined -11.6%. At the same time, trade deficit with Russia expanded to its widest level in six months at USD 2.1B.
NZ BNZ services at 48.3, contracts for 19th month as signs of strain persist
New Zealand’s services sector remained mired in contraction in September, with BNZ Performance of Services Index edging up modestly from 47.6 to 48.3. While the improvement marks a slight lift in momentum, the index has now stayed below the 50-point expansion threshold for 19 consecutive months.
Activity and sales rose to 47.8, and new orders improved to 49.6, but both remained in negative territory. Employment slipped to 47.8, reflecting ongoing caution among firms facing soft sales and squeezed margins.
BNZ reported that 58% of survey comments were negative, only marginally below August’s 59.6%. Respondents cited weak consumer confidence, rising living costs, and reduced discretionary spending as key drags. Many businesses also noted clients delaying projects and contracts amid broader economic uncertainty.
EUR/USD Mid-Day Outlook
Daily Pivots: (S1) 1.1573; (P) 1.1601; (R1) 1.1651; More…
EUR/USD dips mildly today but stays above 1.1540 temporary low. Intraday bias remains neutral for more consolidations. Deeper decline is expected as long as 1.1778 resistance holds. On the downside, break of 1.1540 will resume the fall from 1.1917 to 1.1390 , or further to 38.2% retracement of 1.0176 to 1.1917 at 1.1252.
In the bigger picture, considering bearish divergence condition in D MACD, a medium term top is likely in place at 1.1917, just ahead of 1.2 key psychological level. As long as 55 W EMA (now at 1.1247) holds, the up trend from 0.9534 (2022 low) is still extended to continue. Decisive break of 1.2000 will carry larger bullish implications. However, sustained trading below 55 W EMA will argue that rise from 0.9534 has completed as a three wave corrective bounce, and keep outlook bearish.
Greene says BoE should skip some rounds of rate cuts to tame inflation
BoE policymaker Megan Greene sounded a hawkish note today, warning that interest rates may need to stay elevated for an extended period to ensure inflation is fully subdued. She said monetary policy is “less restrictive than it had been,” a worrying sign given that price growth has shown renewed momentum over the past year.
While Greene believes the disinflation process “remains intact,” she expressed concern that it is losing pace, adding that inflation’s earlier spike above 11% has likely reshaped consumer and business behavior.
Ahead of Tuesday’s key U.K. wage and jobs data, Greene said the labor market appears to be stabilizing after a mild slowdown, having avoided the sharp deterioration some had feared earlier in the year. That resilience, combined with lingering inflation pressures, supports the case for patience before cutting rates again.
To ensure inflation is fully defeated, Greene argued that the Bank Rate should be “more restrictive than the market curve”, but without undermining the BoE’s credibility by alternating between hikes and cuts. Instead, she said the preferable path would be to keep rates "higher for longer", and "skipping some rounds in terms of rate cuts."