
Sample Category Title
BoE’s Bailey notes labor market cooling, IMF warns inflation still highest in G7
BoE Governor Andrew Bailey said overnight that the latest U.K. labor market data released this week reinforced his view that inflation pressures are continuing to ease gradually. Speaking at an IIF event in Washington, Bailey noted “I’ve been saying this for some time, but I think we’re seeing some softening of labor markets”.
Bailey acknowledged that uncertainty over U.S. tariffs had prompted many firms to delay investment plans, creating another drag on business sentiment. Meanwhile, he said the central bank had not yet observed any direct impact on inflation.
His remarks came as IMF Chief Economist Pierre-Olivier Gourinchas cautioned that the BoE must be “very cautious” with future rate cuts, given that U.K. inflation remains stubbornly high compared with peers. The IMF’s latest forecasts project U.K. consumer prices rising 3.4% in 2025 and 2.5% in 2026, the highest in the G7.
Fed’s Powell keeps October cut alive as downside risks to jobs rise
Fed Chair Jerome Powell reinforced expectations for another rate cut later this month. Speaking overnight, he said that based on available information despite government shutdown, the outlook for growth, employment, and inflation “has not changed much.”
Powell pointed out that hiring momentum has weakened, with payroll gains "slowed sharply" over the past several months. He attributed this partly to structural factors such as lower immigration and participation, which have constrained workforce growth. Even though layoffs remain subdued, Powell warned that the “downside risks to employment appear to have risen,” citing survey evidence that households see fewer job openings and firms report less hiring difficulty.
On inflation, Powell noted that price pressures remain contained. The latest surveys and data indicate that goods price increases are "primarily reflect tariffs rather than broader inflationary pressures". While short-term inflation expectations have edged higher this year, long-term expectations remain well anchored around the Fed’s 2% target.
Taken together, Powell’s tone is balanced but leaning dovish. Fed fund futures continue to see over 90% change of another 25bps cut to 3.75-4.00% on October 29.
Powell/TACO Combo Lifts Wall Street from Early Losses
Today marked the first trading day of the week for many North American traders after Columbus Day for the US and the Canadian Thanksgiving — and the session opened with what felt like a long-weekend hangover.
Overnight markets had reacted sharply to China’s condemnations regarding the escalating US-China trade tensions, notably hurting Oil markets even further.
Despite Trump’s reassuring comments on Sunday, which helped risk assets rebound over the weekend and led to a bullish Monday session, sentiment reversed during the Asia session leading to a scary opening Bell.
Major indices gapped down, with the Nasdaq dropping 1.2% and cryptocurrencies also taking another hit after last week’s selloff.
Sentiment quickly shifted mid-morning after the rough open.
US Trade Representative Jamieson Greer downplayed some of the recent rhetoric between the two nations, triggering a rebound just 20 minutes after the open that carried momentum throughout the session.
By midday, all four major US indices had turned positive, erasing their early losses.
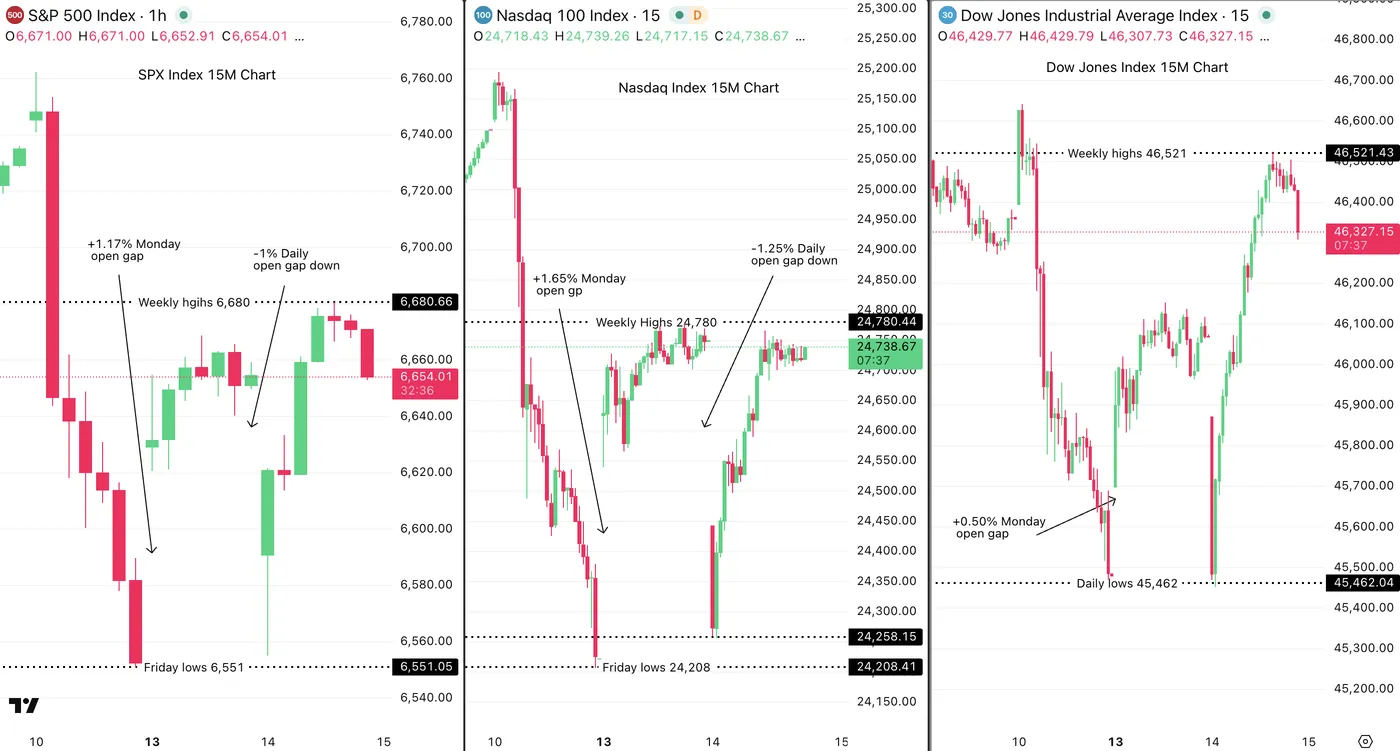
15M Chart Outlook for US Equities – October 14, 2025 – Source: TradingView
Despite the impressive rebound right after the open taking all indices to their weekly highs, there is are ongoing selloff waves in the Dow Jones and the S&P 500 to keep some eyes on. Nasdaq is not really reacting much for now and I am not spotting any headlines.
The real bullish catalysts came around mid-day from Fed Chair Jerome Powell, whose dovish remarks at the National Association for Business Economics meeting brought further bullish momentum.
Powell’s comments raised questions about whether the Fed had early insights into the NFP data, as he emphasized that further labor market softening could justify additional easing.
His tone cemented expectations for another rate cut by month-end, reinforcing the ongoing theme of things not being so bad after all despite the US-China trade scare.
Still, the price action is looking more rangebound with the recent swings rather than back to fully bullish – Let's take a closer look to the Dow Jones, Nasdaq and S&P 500.
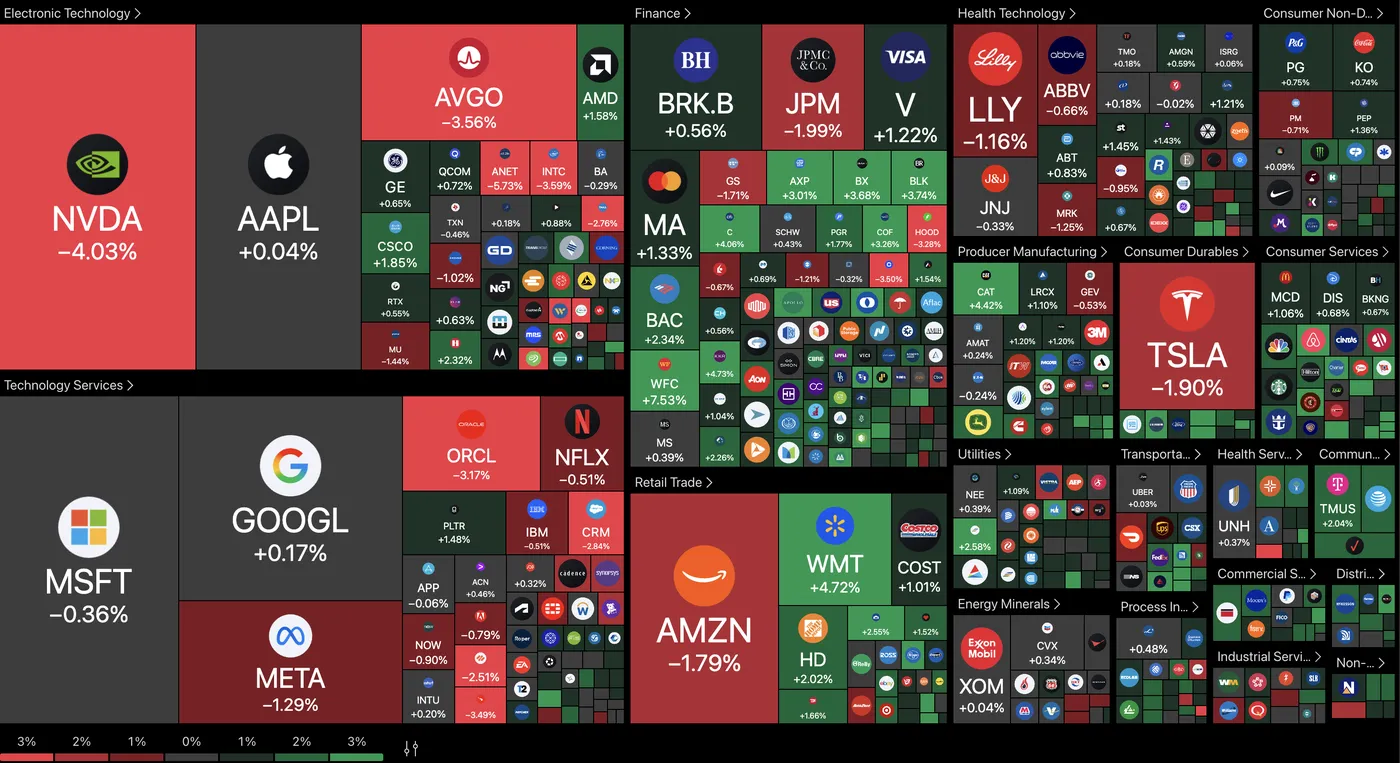
US Equity heatmap – October 14, 2025 – Source: TradingView
US Index analysis and levels: Dow Jones, Nasdaq and S&P 500
Dow Jones 4H Chart
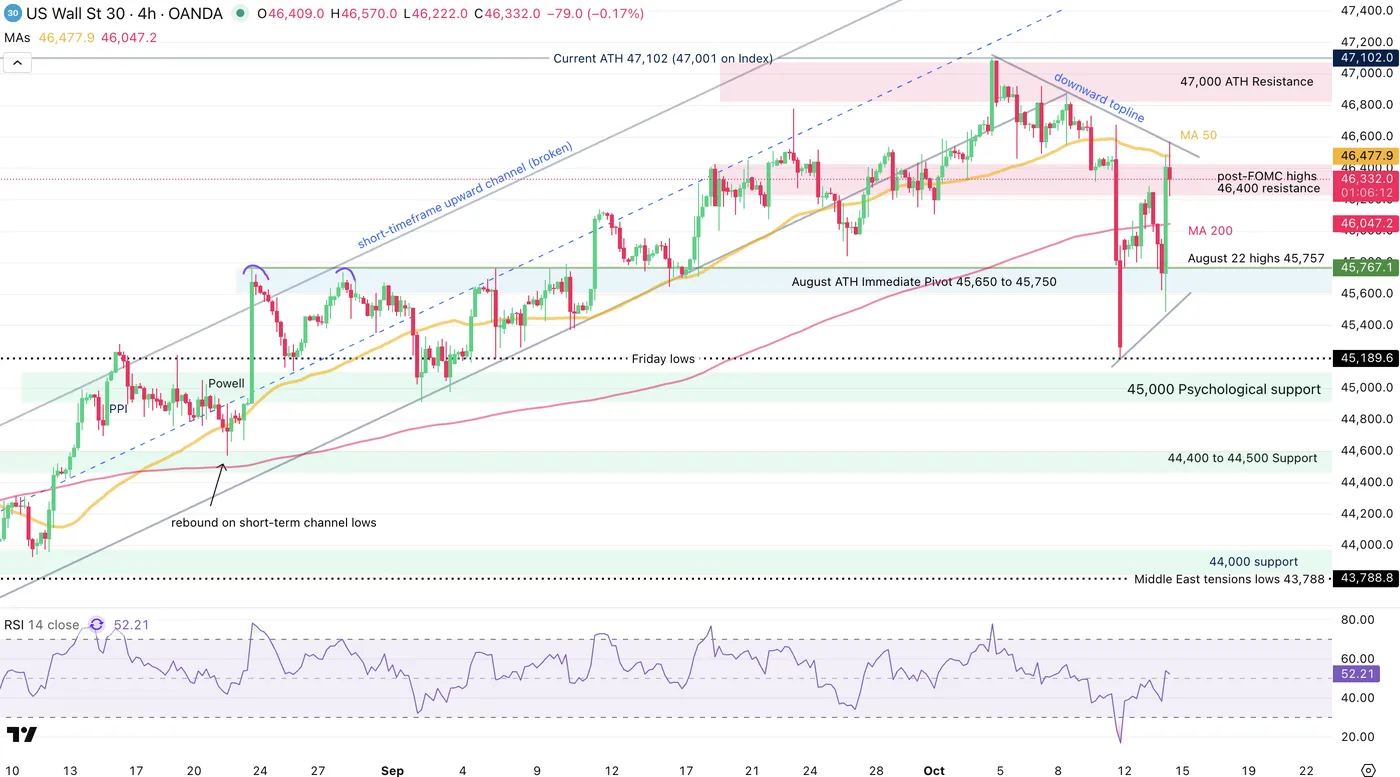
Dow Jones 4H Chart, October 14, 2025 – Source: TradingView
The Dow Jones led an impressive rebound today, lifted by decent earnings and a easier-path ahead when turning to Powell's latest comments.
A few things to look going forward:
- A downward topline has put a strong stop to the ongoing bullish action
- Bulls will have to break above the Monday highs to relaunch a fully bullish price action
- Sellers will also have to break below the daily lows to relaunch take control
- In the meantime, the technical outlook being mixed, a consolidation period would have high probability of taking place – At least until the market knows more on the US-China situation.
Dow Jones technical levels of interest
Resistance Levels
- Current All-time high 47,105
- Daily highs to break with topline 46,560
- ATH Resistance Zone 47,000 to 47,160 (+/- 150 pts)
- post-FOMC highs resistance zone around 46,400 (immediately testing)
Support Levels
- August ATH Immediate Pivot 45,650 to 45,750
- Daily session lows at 45,490
- Friday lows at 45,189
- 45,000 psychological level
- 44,400 to 44,500 Main Support
Nasdaq 4H Chart
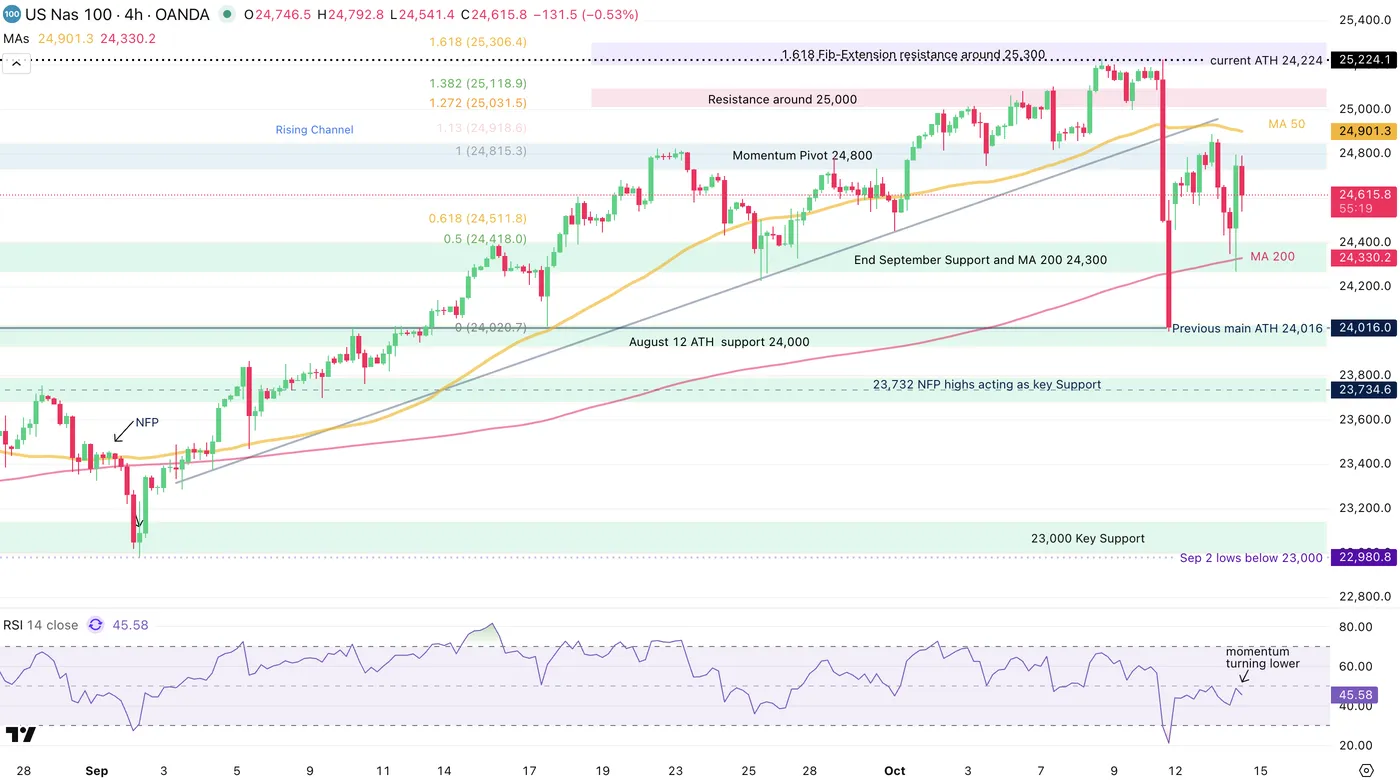
Nasdaq 4H Chart, October 14, 2025 – Source: TradingView
The Tech-Heavy index hasn't rebounded as strongly as its peers today on a relative change and is finding itself in a mixed technical environment.
It is the second time that sellers appear at the key Momentum pivot around 24,800 showing how undecisive the price action is.
Keep an eye on struggling names in tech like Nvidia: If they come back from here, Nasdaq should follow suit.
If the big names keep getting offered, ther path ahead might be a bit more grim.
Nasdaq technical levels of interest
Resistance Levels
- current ATH 25,224
- 1.618 Fib-Extension resistance between 25,200 and 25,300
- Momentum Pivot 24,750 to 24,800
- Monday highs and 4H MA 50 24,890
Support Levels
- End September Support and MA 200 24,300 (morning rebound)
- Friday lows 24,016
- August 12 ATH zone turning support (23,950 to 24,020)
- 23,000 Key Support
- Early 2025 ATH at 22,000 to 22,229 Support
S&P 500 4H Chart
S&P 500 4H Chart, October 14, 2025 – Source: TradingView
Similarly as the Nasdaq, sellers have appeared around the momentum pivot and the overall action might not be as bullish as it was the past few months – Keep an eye on sentiment.
A pattern that emerges is the ongoing break-retest action of the main May upward channel – short term technicals are looking more neutral than anything for now.
The price action will be interesting for the time to come, expect volatility.
S&P 500 Trading Levels:
Resistance Levels
- 6,774 (current All Time-Highs)
- Key current Resistance 6,745 to 6,760
- Key Pivot Zone 6,670 to 6,700
- potential resistance (1.618 fib - 6,790 to 6,800)
Support Levels
- 6,570 to 6,600 Key Support
- FOMC and daily lows 6,562
- 6,490 to 6,512 Previous ATH now Support (MA 200 Confluence)
- 6,400 Main Support
- 6,210 to 6,235 Main Support (August NFP Lows)
Safe Trades!
USD/CAD Price Outlook: Consolidation Above Key 1.4000 Handle. What Next for Loonie?
The loonie has recovered in the US session after starting the day on the back foot. The move was more driven by the US dollar than any developments on the side of the Canadian Dollar.
The loonie has come under pressure in recent days as oil prices have also retreated to fresh lows. When it comes to USD/CAD, the loonies weakness coincided with a rally for the US Dollar which has defied the US Government shutdown and US-China tensions to leave the US Dollar Index (DXY) hovering near recent highs.
Technical Analysis - USD/CAD
Back to the technicals though and USD/CAD has broken the channel which had help price over for just over two months. This sets up USD/CAD for a potential 280 pip move.
The medium-term outlook does look positive for USD/CAD as price has broken above the psychological 1.4000 handle and the 200-day MA. This is the first time USD/CAD trades above the 200-day MA since April 10, 2025. Funny enough this also coincided with USD/CAD breaking below the 1.4000 handle as is the case with the break above this time around.
This makes the 200-day MA key for me and thus if we are to see the bullish move continue, price needs to remain above the 200-day MA if we get any pullback in price.
USD/CAD Daily Chart, October 14, 2025
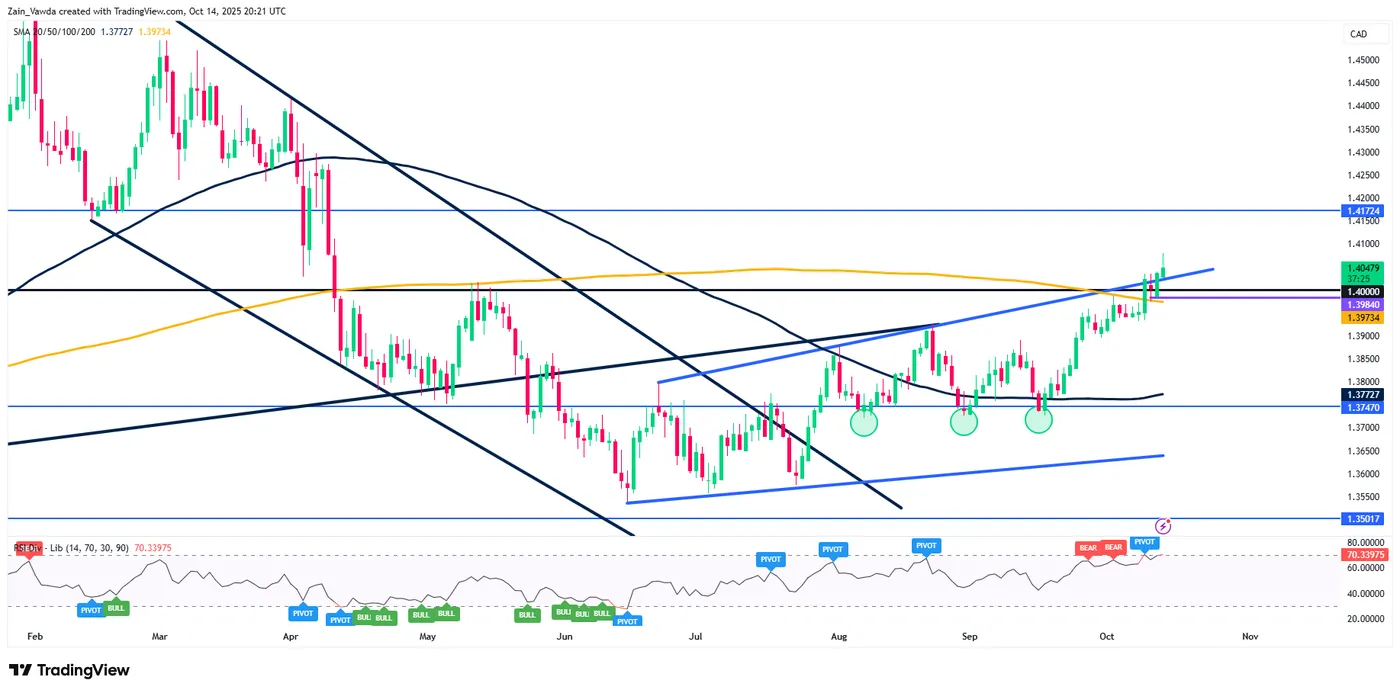
Source: TradingView.com (click to enlarge)
Dropping down to the four-hour chart and you can see that we have just had a bearish engulfing candle close.
Together with the daily hovering near overbought territory (it was in overbought territory when USD/CAD was at its daily high) could lead to a slightly deeper pullback.
If this does materialize, the swing low at 1.39840 is very close to the 200-day MA on the daily timeframe, which rests around
Thus a hold above this level may be the sign for those would be bulls looking to get involved.
USD/CAD Four-Hour Chart, October 14, 2025
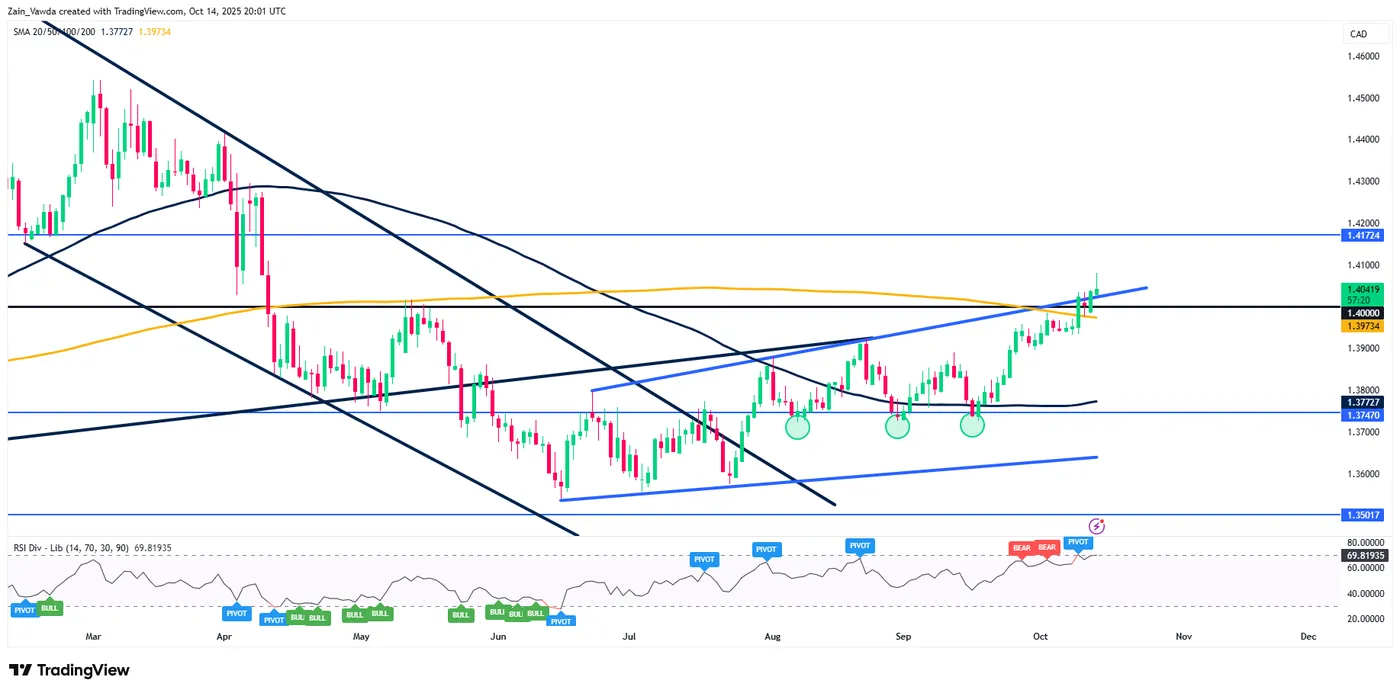
Source: TradingView.com (click to enlarge)
Economic Data Ahead
The US Government shutdown remains in effect and thus data from a US perspective remains out of reach. There is also a lack of high impact data from Canada this week with a speech by Bank of Canada Governor Tiff Macklem the highlight.
This could leave the technicals as a major driver for price moves while trade war developments between the US and China will also play a role.
Next week is much more interesting. We get the releases of key inflation data from the US & Canada.
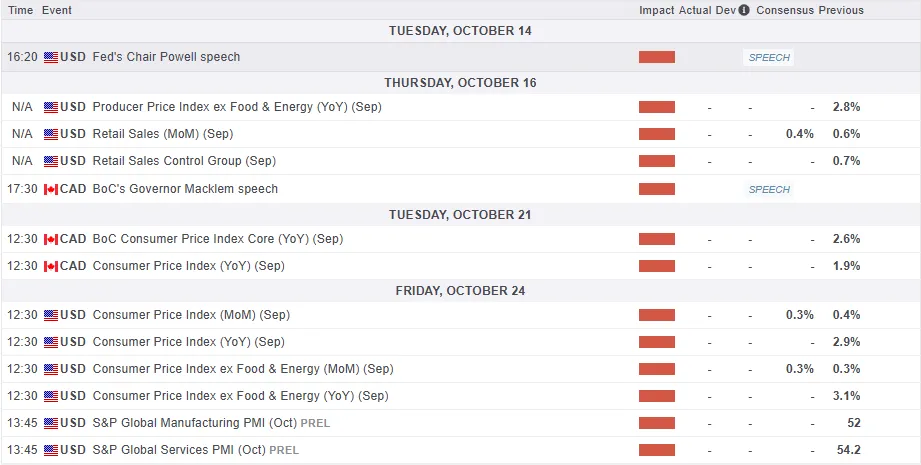
For all market-moving economic releases and events, see the MarketPulse Economic Calendar.
Client Sentiment Data - USD/CAD
Looking at OANDA client sentiment data and market participants are short on USDCAD with 75% of traders net-short. I prefer to take a contrarian view toward crowd sentiment and thus the fact that so many traders are short means USD/CAD prices could rise in the near-term.
WTI Oil Tumbles as US-China Trade Tensions Flare Up Again
A degrading sentiment took a pause yesterday as participants digested Trump’s remarks over a prolonged North American trading weekend , which initially signaled a possible de-escalation in trade tensions between the US and China.
However, optimism looks short-lived.
China reiterated its stance through multiple official channels — including its Commerce Ministry and state media — emphasizing its readiness to respond firmly to any tariff actions which comes after an initial Friday comment from Donald Trump in case you missed the story.
This is even leading to the EU and US looking to partner up again to fight the Chinese aggressive policy.
Adding pressure, US ships began paying duties at Chinese ports today, a measure long anticipated but now officially in effect.
This development has weighed heavily on global trade sentiment, extending the downtrend in Oil prices.
With easing Middle East tensions and steady Russian supply to fund its war in Ukraine, Oil fundamentals remain pointed to the downside except for the advent any black swan event.
WTI has now fallen below $60, and has been holding below the threshold since Trump's original post.
Let’s dive into Oil spot charts to see whether this decline is nearing exhaustion — or just beginning.
WTI Daily Chart
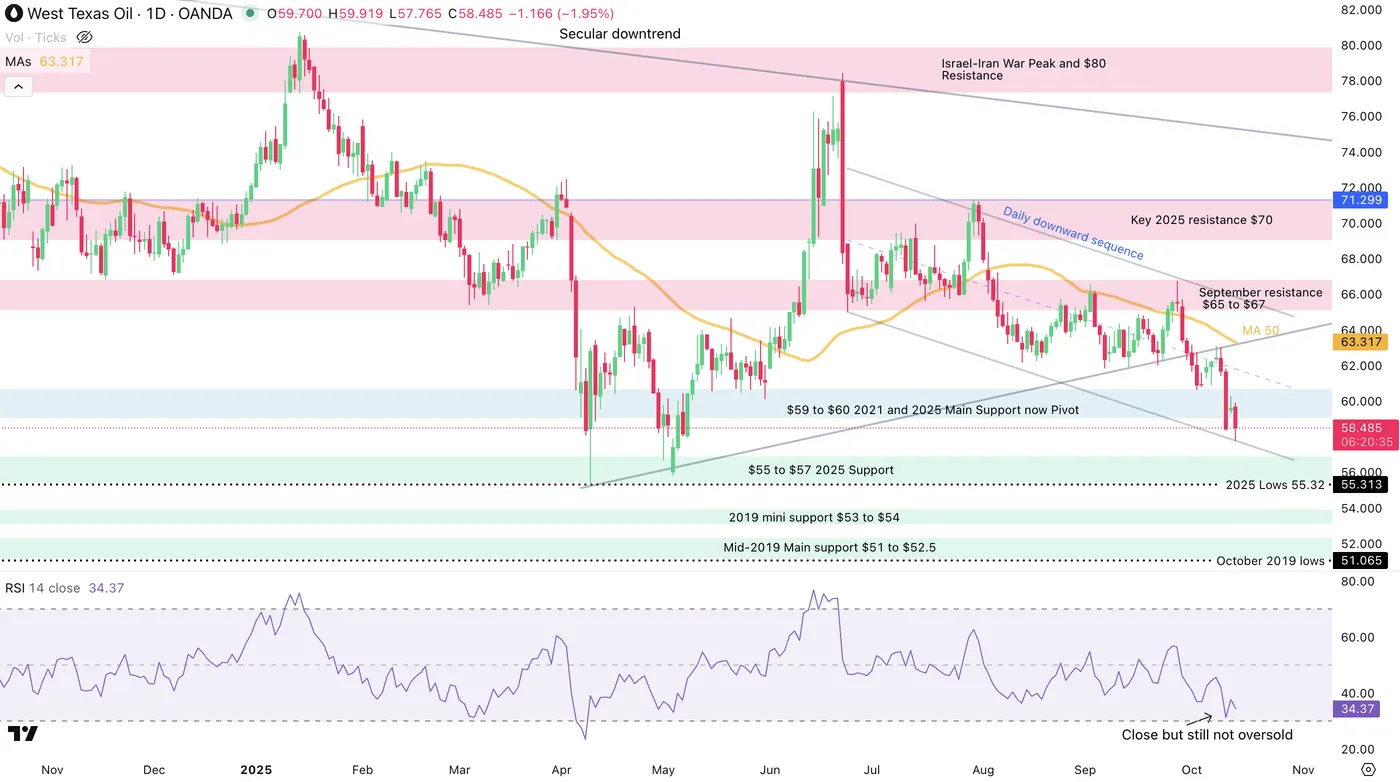
US Oil Daily Chart, October 14, 2025 – Source: TradingView
This year has seen many factors leading to downward revised global economic performance.
The most evident one is the Trump tariffs which added a widespread angst among economists, especially as they get imposed about a year after the conclusion of the fastest hike cycles, which aimed to dampen the fast growing economies from 2022 and 2023.
Even a few years after, economic deceleration still imposes its dominance on oil demand, particularly when looking at the slowing labor growth in OECD nations which generate a lot of demand.
For example, the UK just published weak data as seen in the overnight data report (more on this coming on MarketPulse today) and an also slowing US jobs market.
This combined with Chinese deflation doesn't help for bulls prospects.
There is some nuance however, with Chinese trade data coming in way better than expected and airlines projecting a solid outlook ahead.
The daily chart shows reactions at the lows of the daily downtrend after the overnight 1.50% drop.
The RSI is approaching the oversold territory but isn't quite there. Let's take a closer look.
WTI 4H Chart and levels
US Oil 4H Chart, October 14, 2025 – Source: TradingView
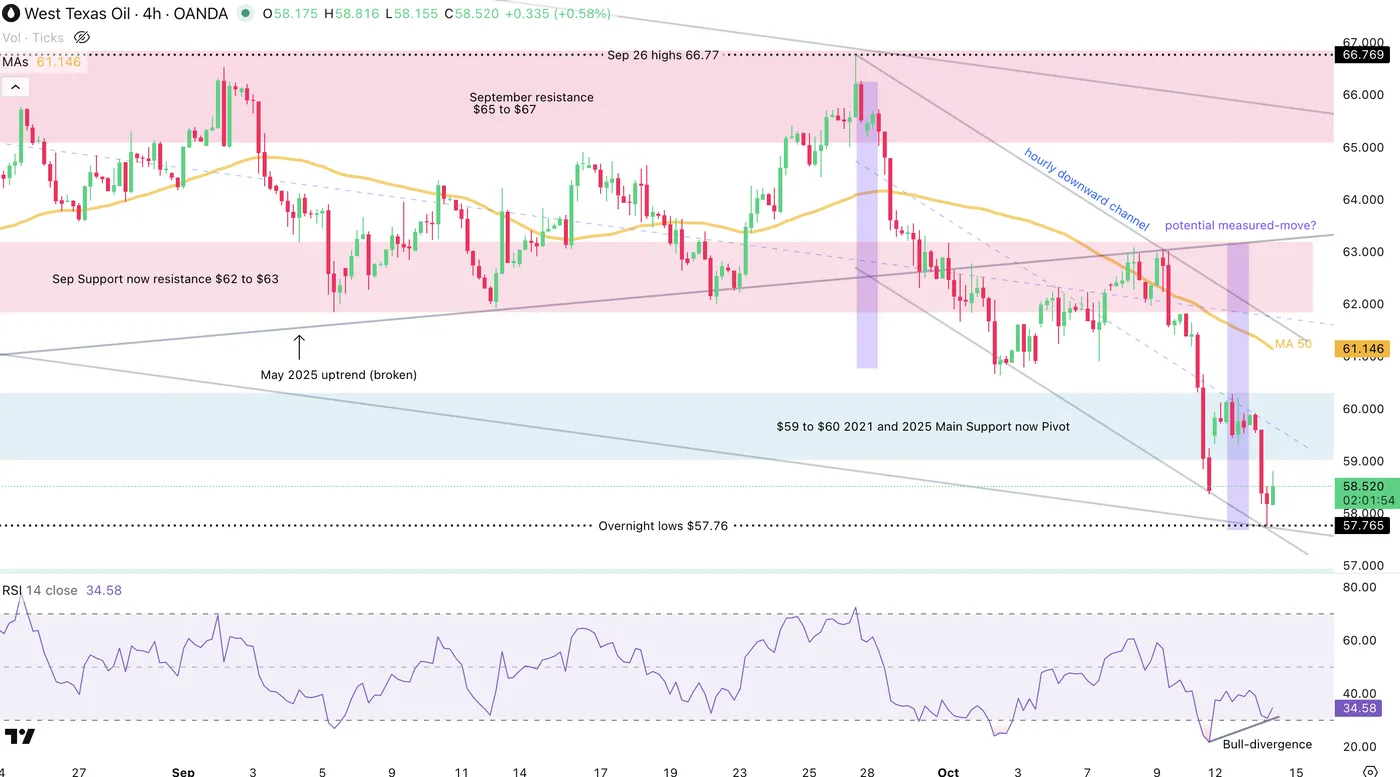
Since the end of September, Oil has firmly held its daily descending channel and even formed a steeper hourly trend.
This led to the overnight $57.75 lows, levels not seen since May 2025 and the Liberation Day troughs.
There has been some small mean-reversion however as prices reach a confluence bottom of the daily & hourly channels, combined with a bullish RSI divergence and an end to a measured-move.
Traders will have to look at the daily lows: any attempt to make new lows and any 4H close below would maintain the bearish trend and push towards the $55 2025 support zone.
Any rebound from here may point to the 4H 50-MA at $61.15 , at a confluence with the upper bound of Hourly Channel.
Levels to place on your WTI charts:
Resistance Levels
- $59 to $60 2021 and 2025 Main Support now Pivot
- MA 50 and upper bound of Hourly Channel $61.15 to $61.30
- September range Support now resistance $62 to $63
- September resistance $65 to $67
Support Levels
- Overnight lows $57.76
- $55 to $56.50 2025 Support
- 2019 mini support $53 to $54
- Mid-2019 Main support $51 to $52.5
Safe Trades!
EURCAD Wave Analysis
EURCAD: ⬆️ Buy
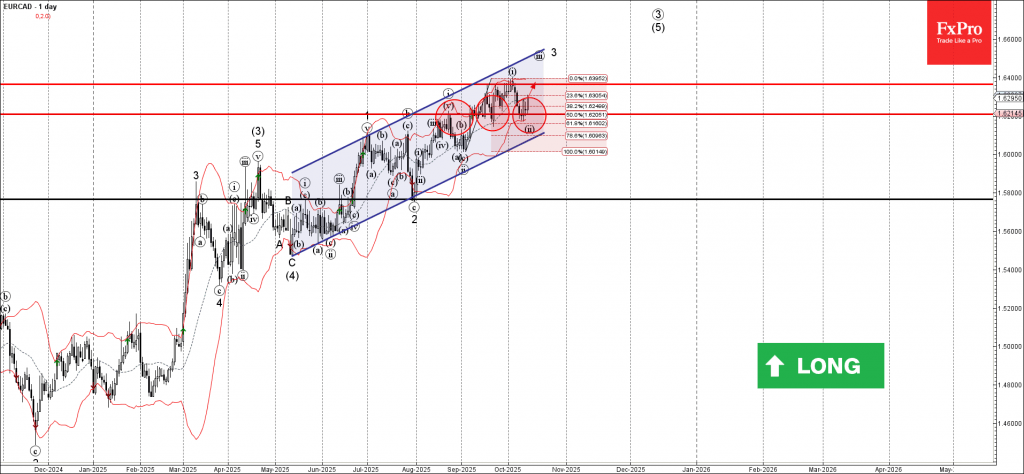
- EURCAD reversed the support level 1.6200
- Likely to rise to resistance level 1.6365
EURCAD currency pair recently reversed up from the support level 1.6200 (former monthly high from August, which has been reversing the price from the start of September, as can be seen below).
The support level 1.6200 was strengthened by the lower daily Bollinger Band and by the 50% Fibonacci correction of the upward impulse from September.
Given the clear daily uptrend, EURCAD currency pair can be expected to rise to the next resistance level 1.6365 (which reversed the previous impulse wave i).
Sunset Market Commentary
Markets
Market relevant data are rather scarce these days. UK labour market data in this respect at least provided some kind of ‘distraction’. Even so, the market reaction told least as much on reigning market sentiment as on a reassessment on the basis of the data content. The UK labour market report can be labelled as being soft. Monthly employment data declined 10k jobs in September, but indications over the previous months shows some signs of bottoming. August earnings data (3M/Y/) also were a bit mixed but markets apparently focused on private earnings excluding bonuses slowing from 4.7% Y/Y to 4.4%. It is seen as an indication of an easing of wage pressures (annex inflation). The unemployment rate also rose from 4.7% to 4.8%. ‘Optimists’ on the other hand could have pointed to revisions from data released earlier this year indicating that job losses after last year’s UK budget measures probably were less than feared. Even so, markets still saw the data as reinforcing the case for the BOE to maybe consider further easing sooner rather than later. Gilts outperform Bunds and Treasuries, declining between 6 bps (2-y) and 7 bps (10 & 30-y). In a congruent move, sterling is touching the lowest levels against the dollar since early August (Cable 1.326). EUR/GBP regains the 0.87 barrier (0.871).
On other markets, a risk-off sentiment again reigns after yesterday’s (equity) rebound as markets are pondering a new flaring up of trade tensions between the US and China. China retaliated against the US shipping sector after president Trump end last week threatened with additional tariffs and restrictions on US chips exports to China. US indices show losses between 1.3% (Dow) and 2% (Nasdaq) even as some major US reported stronger than expected/solid Q3 results. The EuroStoxx 50 is ceding 0.75%. In this risk-off context, US Treasuries only show modest gains, if any (2-y yield -1 bp, 30-y little changed). 2-y and the 10-y yields nearing key support at 3.5% and 4% respectively probably makes markets cautious on a stronger safe haven bid. Bunds outperform with yields declining between 2.5 bps (2-y) and 4 bp (30-y). We assume this move is also mainly due to the global risk-off sentiment rather than markets really positioning for additional ECB easing. Even so, EMU money markets now again see a >50% chance of one additional ECB rate cut next year. On FX markets, the trade-weighted dollar fails to maintain initial modest gains (DXY 99.3). The Aussie dollar is a major victim of escalating trade tensions between the US and China (AUD/USD 0.645). At the same time USD/JPY even drifts marginally lower just (152 area). EUR/USD tested the 1.1550 area. European markets are assessing the potential consequences of the budget speech of French PM Lecornu before Parliament. Amongst others, the PM apparently is prepared to suspend the pension reform to get support for some 2026 budget consolidation. At EUR/USD 1.158, the euro at least trades off the intraday lows and so do European equities. Markets apparently favour a French ‘kicking-the-can-down-the road’ scenario, rather than outright chaos.
News & Views
The International Energy Agency expects next year’s oil oversupply will be even bigger than previously thought. It now pencils in a record overhang of almost 4 mln barrels a day, or roughly 18% more than last month’s update. The revision came amid the oil producing cartel OPEC+ continuing to revive output. The IEA also assumes that non-OPEC output will increase by 1.2 mln a day next year, up 200k from the September projection. As far as demand is concerned, they forecast an increase by a well-below-trend 700k barrels a day for both this year and the next. The supply-demand mismatch led to a sharp rise in inventories by 1.9 mln barrels a day this year. While the impact on oil prices has been mitigated by China absorbing up the majority, the IEA warned that’s now beginning to change. Brent oil today drops to $62/b and is set to close at its lowest level since early May.
Chinese companies looking to operate in the European Union may soon be forced to hand over technology to EU firms, according to people familiar with the matter. The measures would apply to those seeking access to what it considers key digital and manufacturing markets such as cars and batteries. The rules would additionally require the firms to use a set amount of EU goods or labour and to create added value on EU soil. The people said they expect the measures to be applicable from November and to all non-EU firms. However, one said that the goal is to keep China’s manufacturing from overwhelming the European industry. Key to the proposal is the focus on the transfers of battery technology know-how, aimed at reducing reliance on China while strengthening the European EV industry.
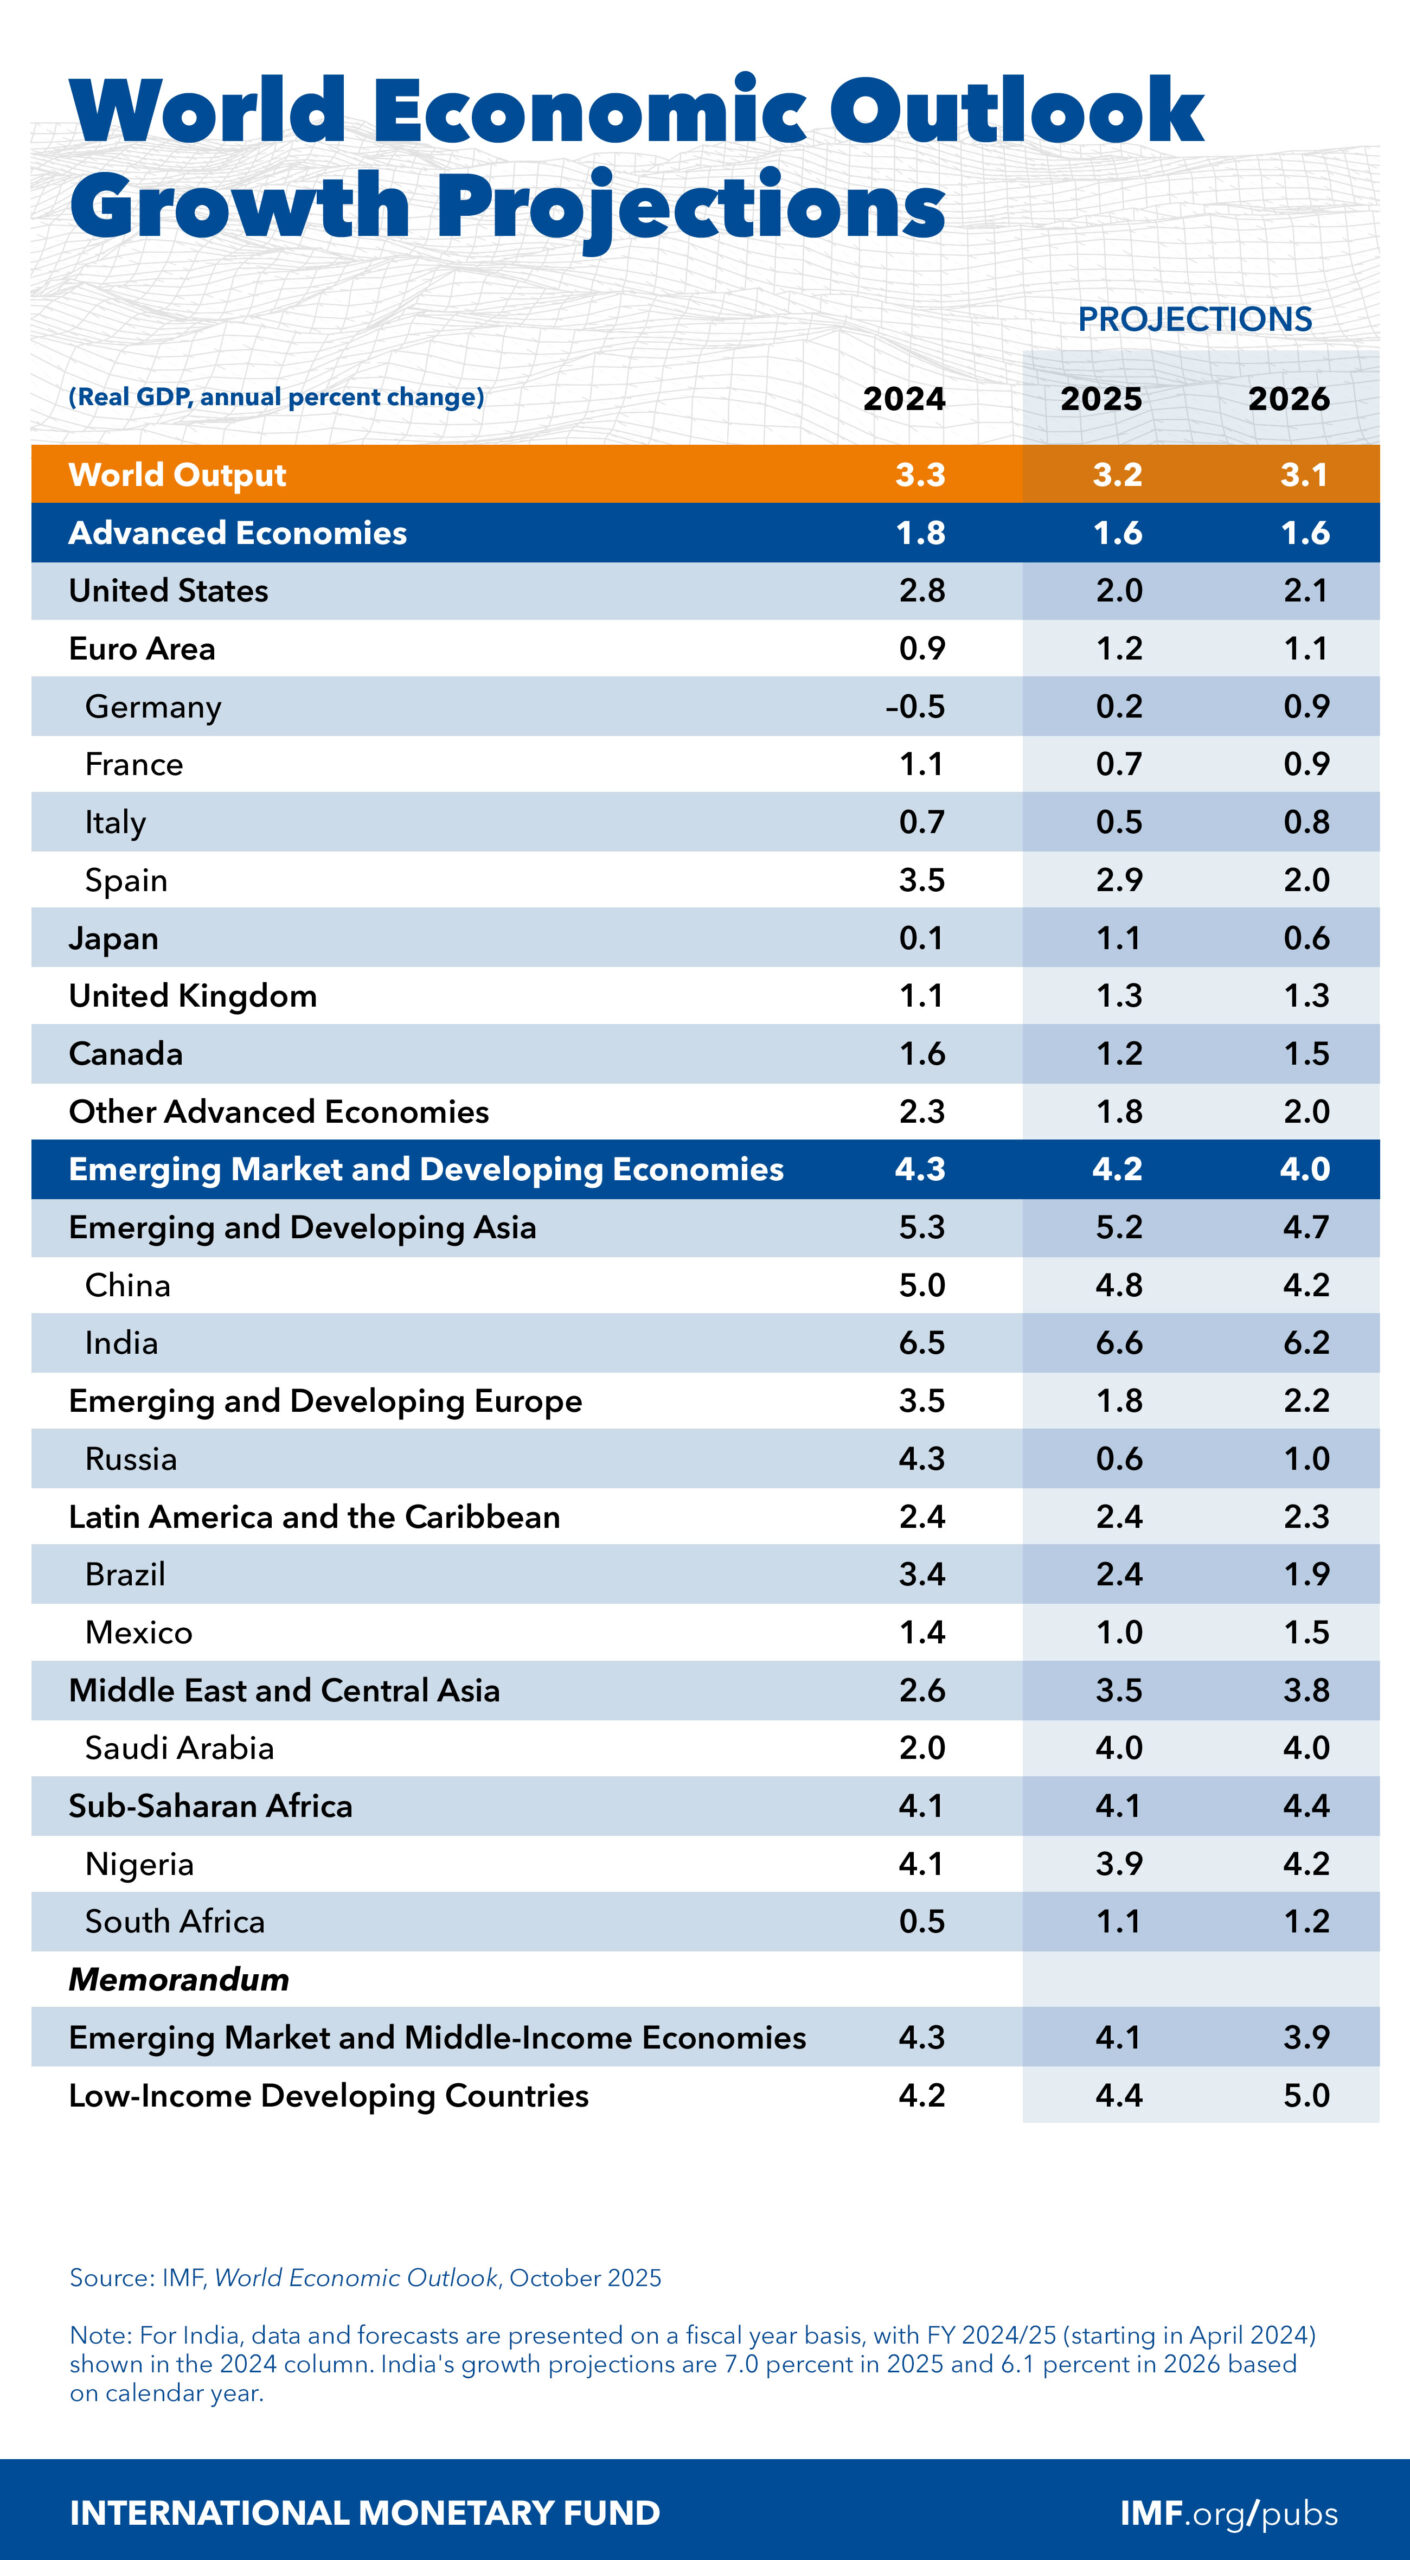
IMF: Global growth seen at 3.2% in 2025, risks tilted to downside
The IMF’s World Economic Outlook had global growth projections revised modestly higher from April. The Fund now expects global growth to ease from 3.3% in 2024 to 3.2% in 2025 and 3.1% in 2026.
The update shows mixed regional outlook. The U.S. economy is projected to grow 2.0% in 2025 and 2.1% in 2026. Eurozone is expected to grow only 1.2% in 2025 and 1.1% in 2026. The U.K. is forecast to expand at a steady 1.3% pace in both years, while Japan’s growth is seen slowing from 1.1% to 0.6%. Meanwhile, China’s output is expected to decelerate from 4.8% in 2025 to 4.2% in 2026.
Despite the incremental upgrades, the balance of risks remains tilted to the downside. The IMF warned that prolonged geopolitical uncertainty, rising protectionism, and labor supply shocks could further constrain growth, while fiscal vulnerabilities and potential market corrections pose threats to global financial stability. It also cautioned that a continued erosion of institutional credibility in several economies could weigh on investment and confidence.
On prices, the IMF said global inflation is set to continue moderating, but the pace will vary widely. Inflation is projected to remain above target in the US where upside risks persist.
US: Small Business Optimism Retreats in September
The NFIB's Small Business Optimism Index fell 2 points to 98.8 in September, marking the first decline in three months. As optimism declined, the level of uncertainty rose, with the corresponding index rising 7 points to 100 – the fourth-highest reading in about 50 years.
Five out of ten subcomponents fell on the month, two improved, and three remained unchanged. The largest pullbacks were in expectations about an improvement in the economy (-11 points to 23%), current inventory (-7 points to -7%), expected credit conditions (-3 points to -7%) and the belief that now is a good time to expand (-3 points to 11%).
Labor market indicators were mixed. The average change in employment per firm was negative for the fourth month in a row. The net share of businesses planning to increase employment rose one point for the fourth month in a row to 16%, while the share of firms with unfilled job openings remained unchanged at 32%. The latter has fallen notably over the last several quarters, though it remains comfortably above its long-term average of 22%.
Quality of labor concerns fell 3 points, with 18% of business owners identifying this as their top business problem – tied with the share of owners reporting taxes as their top business problem. Meanwhile, the share of firms reporting "few or no qualified workers for job openings" surged 7 points to 50%, completely reversing the decline of the two months prior.
Inflation concerns appeared to make a comeback, with 14% of businesses reporting this as their top problem (up 3 points on the month, and the first increase since mid-2024). The share of businesses 'raising' average selling prices rose 3 points to 24%, while the share of firms 'planning’ to raise average selling prices ahead rose 5 points 31% – both measures remain above their historical averages.
Key Implications
While a weaker showing, September's NFIB reading is basically in line with its historical average, but the subcomponents reveal a nuanced backdrop. In the absence of last month's (BLS) jobs report, today's NFIB report adds credence to the view that there was little progress made on the hiring front in September, with small business job creation stuck in shallow negative territory for several months now. On a more positive note, hiring intentions have trekked consistently higher in recent months. This could work in favor of a moderate turnaround in job creation, but the fact that uncertainty is near record highs is likely to take some wind out of these plans.
The Fed has put more of an emphasis on its 'maximum employment' mandate recently as it restarted rate cuts, and while recent labor market data lend support to this narrative, more work also remains to be done on the inflation front. The uptick in the NFIB price metrics and inflation concerns in September speak to difficulties that the Fed will continue to face as it leans toward additional rate cuts, at a time when inflation is still elevated. A recent rekindling to the U.S.-China trade conflict is likely to add to that difficulty.