Sample Category Title
British Pound Braces for Further Losses
The British pound remains under sustained pressure, driven by a weakening domestic economy and receding inflation concerns. Recent UK macroeconomic data indicate stagnation in the service sector and a continued decline in consumer spending.
At the same time, slowing wage growth is giving the Bank of England greater flexibility to adopt a more dovish stance. Market expectations now point to a high likelihood of a rate cut at one of the bank’s forthcoming meetings.
Political uncertainty is also weighing on the currency. The government’s fragile parliamentary position and deepening internal divisions over tax and fiscal policy are adding to sterling’s vulnerability. This is compounded by falling business confidence and subdued investment activity, raising concerns about the UK’s economic trajectory into the fourth quarter.
Externally, the US dollar continues to gain support. Recent remarks from Federal Reserve officials suggest a commitment to maintaining current interest rate levels through year-end, bolstering the greenback’s appeal. In addition, escalating geopolitical tensions in the Middle East and ongoing volatility in commodity markets are fuelling demand for safe-haven assets, including the dollar.
Overall, the fundamental backdrop remains tilted towards further GBP/USD depreciation in the near to medium term.
Technical Analysis: GBP/USD
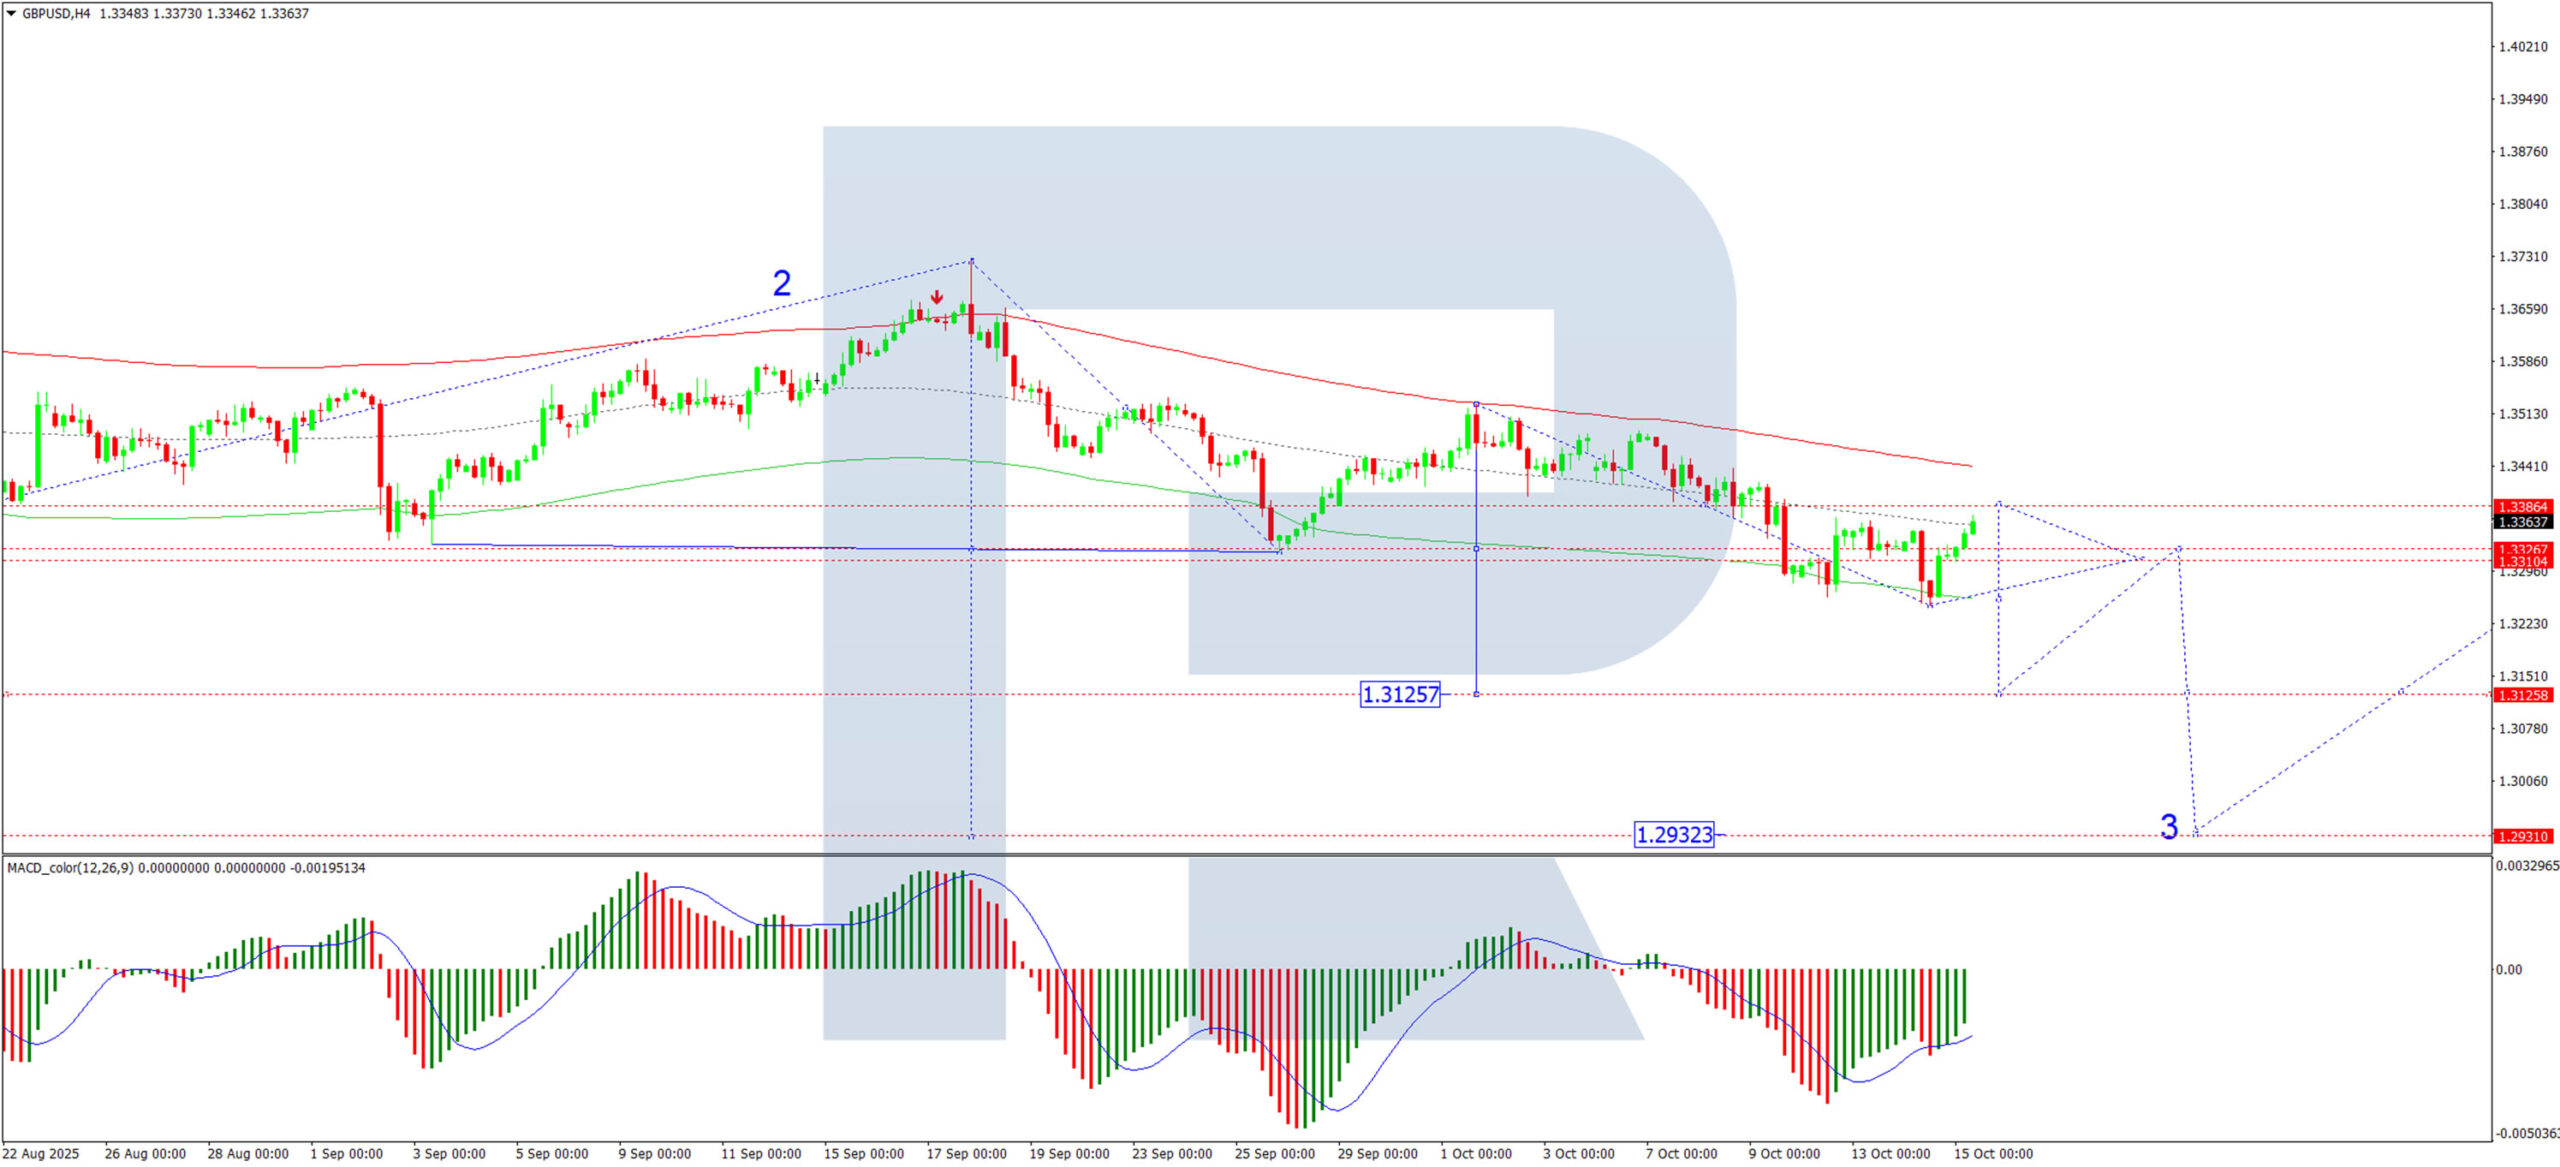
H4 Chart:
A consolidation range has formed around 1.3310. A downward breakout appears likely, signalling a continuation of the third declining wave towards a local target of 1.3125. This bearish outlook is supported by the MACD indicator, whose signal line lies below zero and is pointing firmly downward.
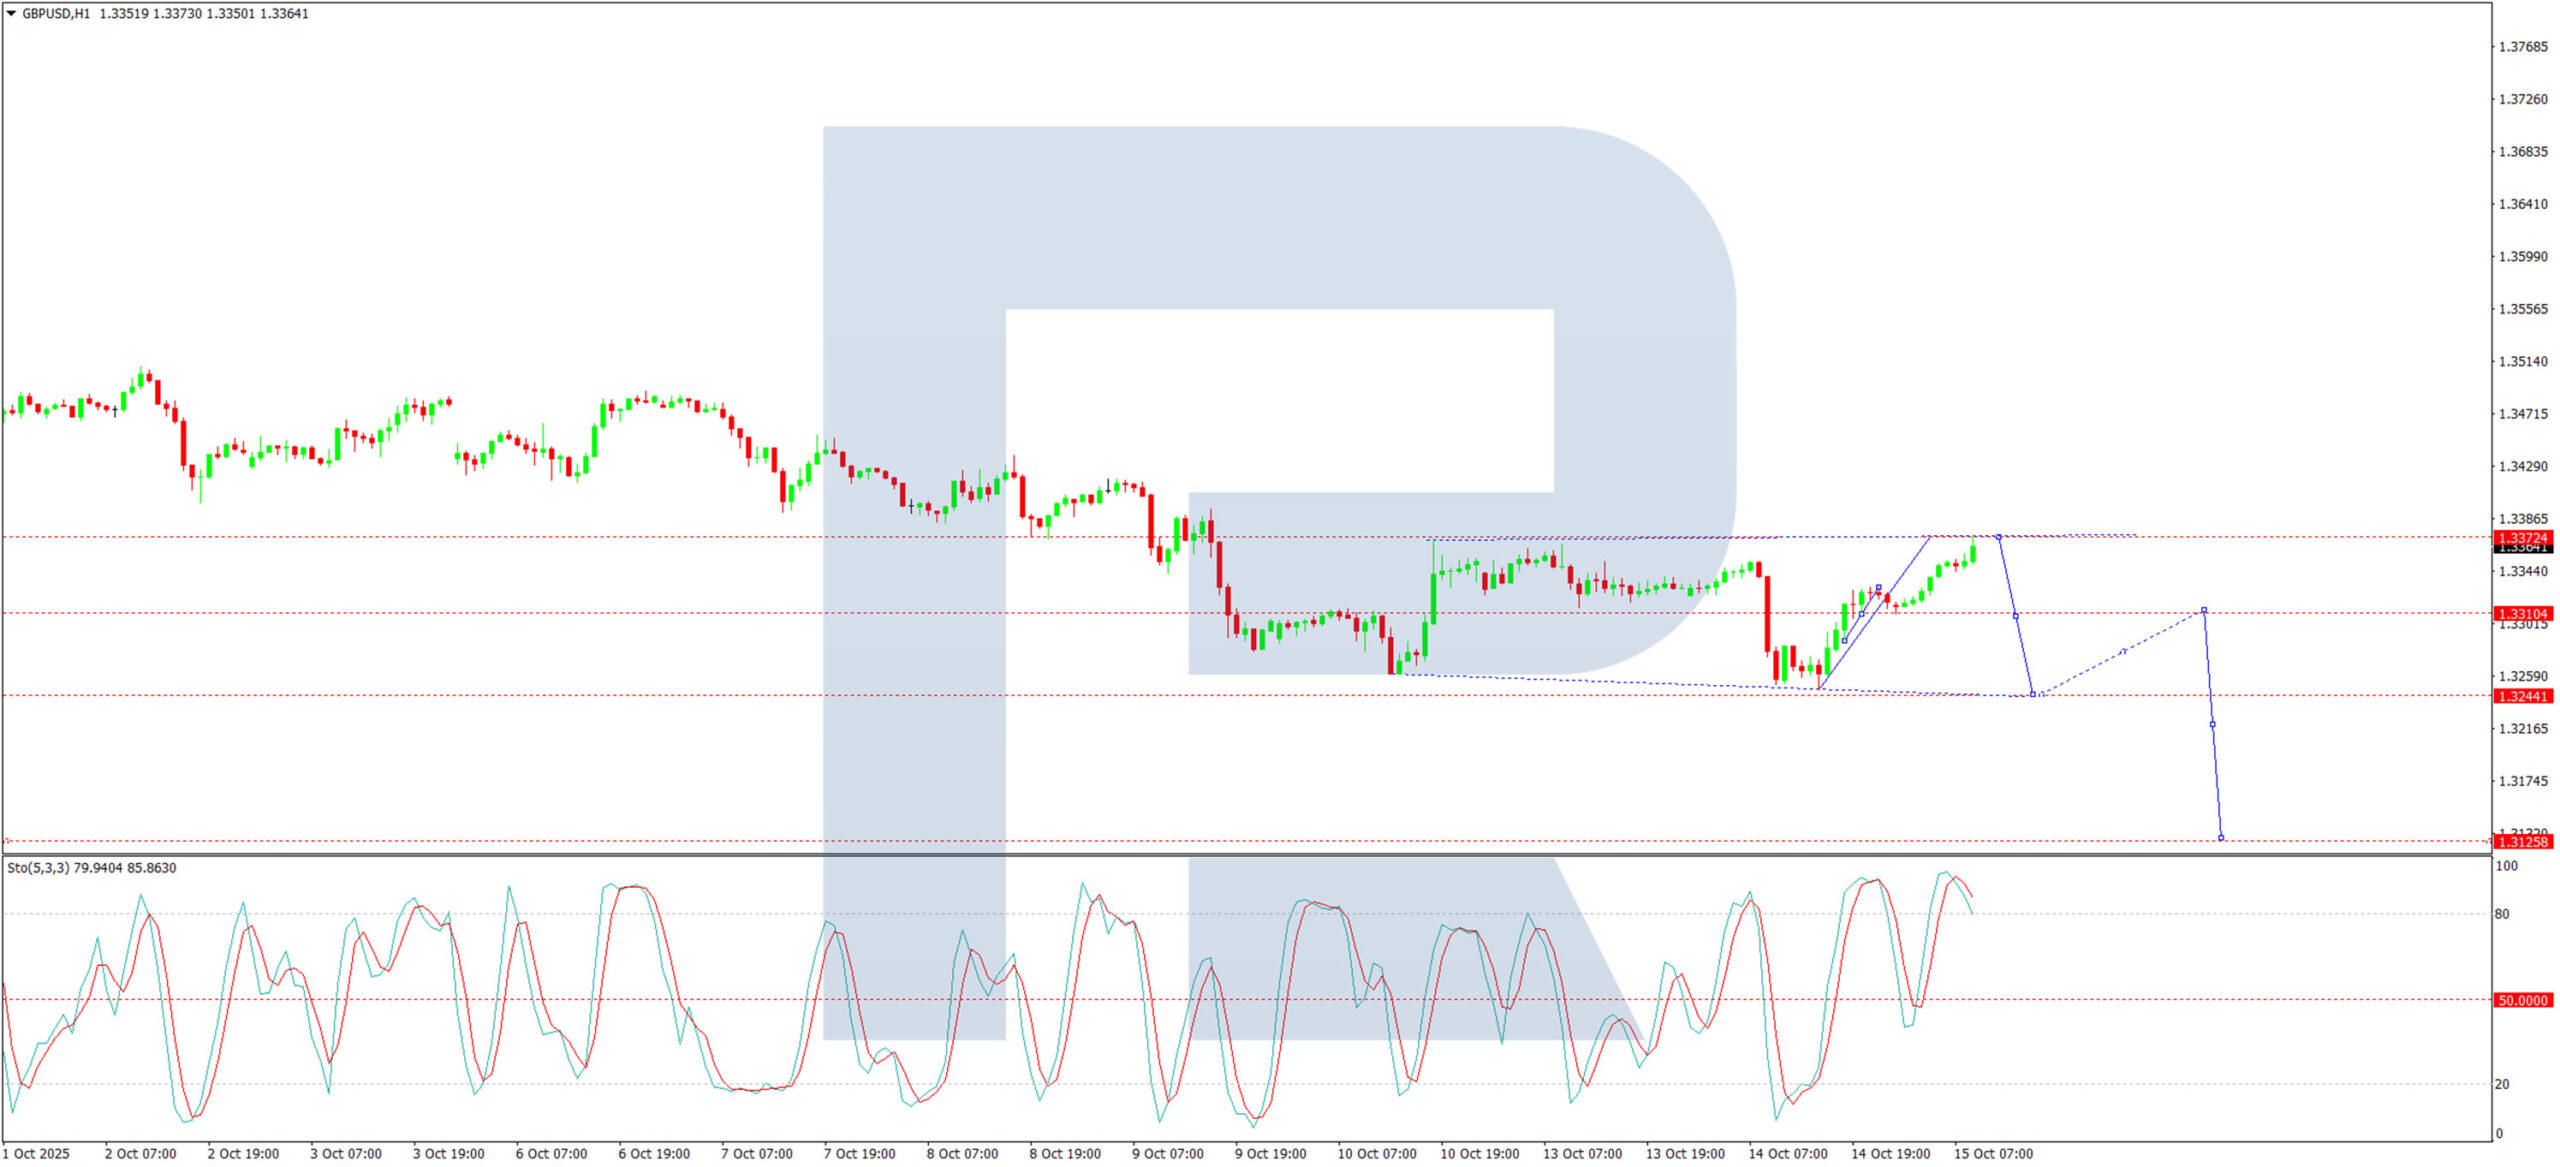
H1 Chart:
The pair has also formed a consolidation range around 1.3310, with the third wave of the broader downtrend now largely confirmed. The first leg of this wave reached 1.3252, followed by a correction to 1.3372. A further decline toward at least 1.3244 is anticipated, with an extension of the downward structure to 1.3125 also possible. The Stochastic oscillator confirms this scenario, with its signal line below 80 and trending downward towards 20.
Conclusion
Sterling continues to face significant headwinds from both domestic and external factors. With monetary and political dynamics aligned against it and technical structure favouring the downside, GBP/USD appears set for further declines in the sessions ahead.
Crypto Market Remains Stable But Has No Reason to Grow
Market Overview
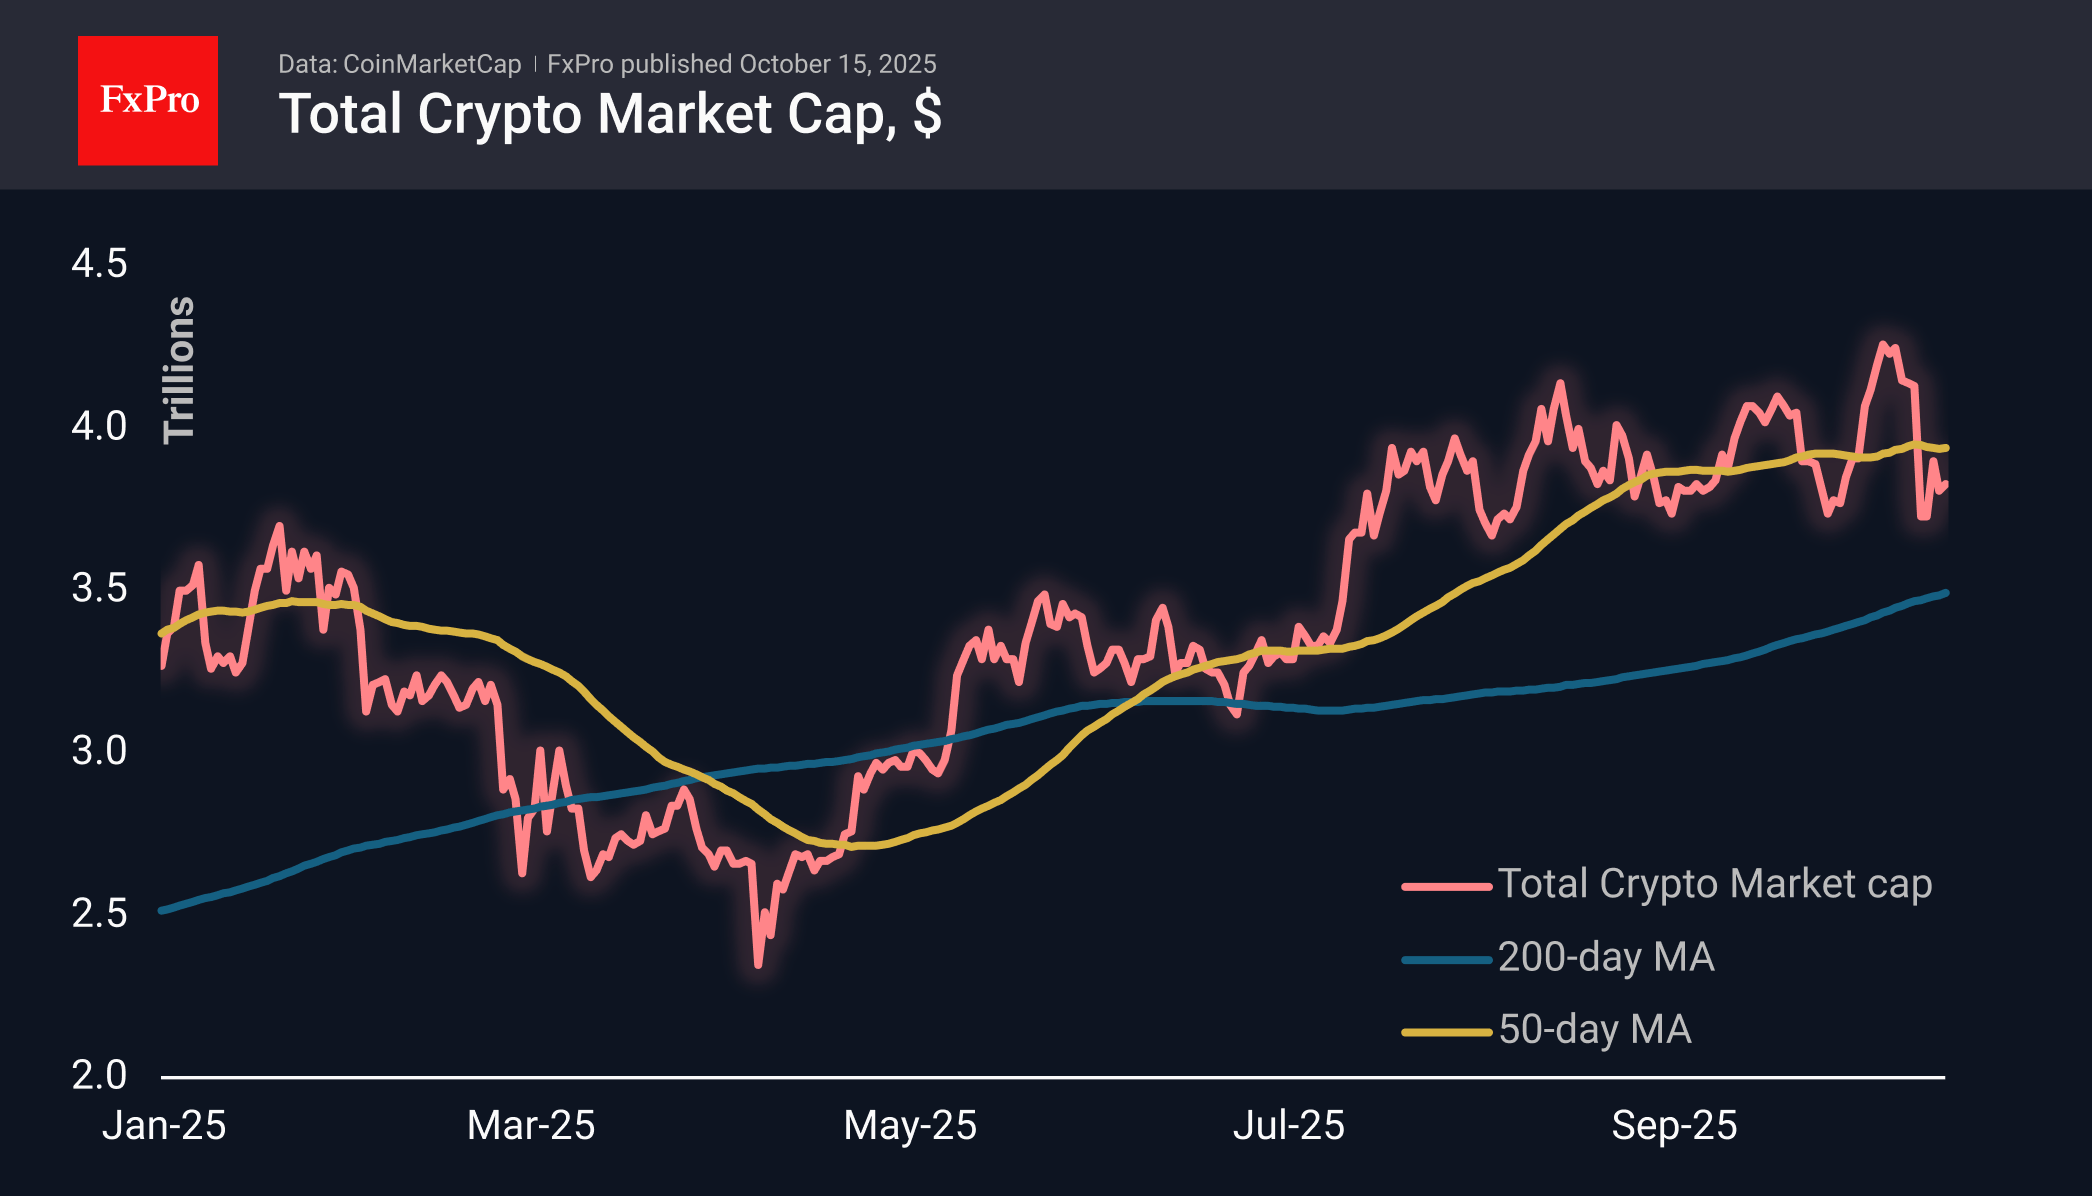
The crypto market capitalisation has changed slightly over the past day, adding 0.1% to $3.83 trillion. Monday’s recovery was interrupted by a new wave of sales, albeit less intense. The bears seem to have had their fill and are already losing some of their strength. However, potential buyers prefer to wait for a reason to buy, and trading disputes do not yet provide such a reason.
The sentiment index has fallen back to 34 (fear) from 38, where it had remained for the previous two days. Away from the ‘extreme fear’ zone, the market does not attract the most desperate speculators, leaving room for further decline.
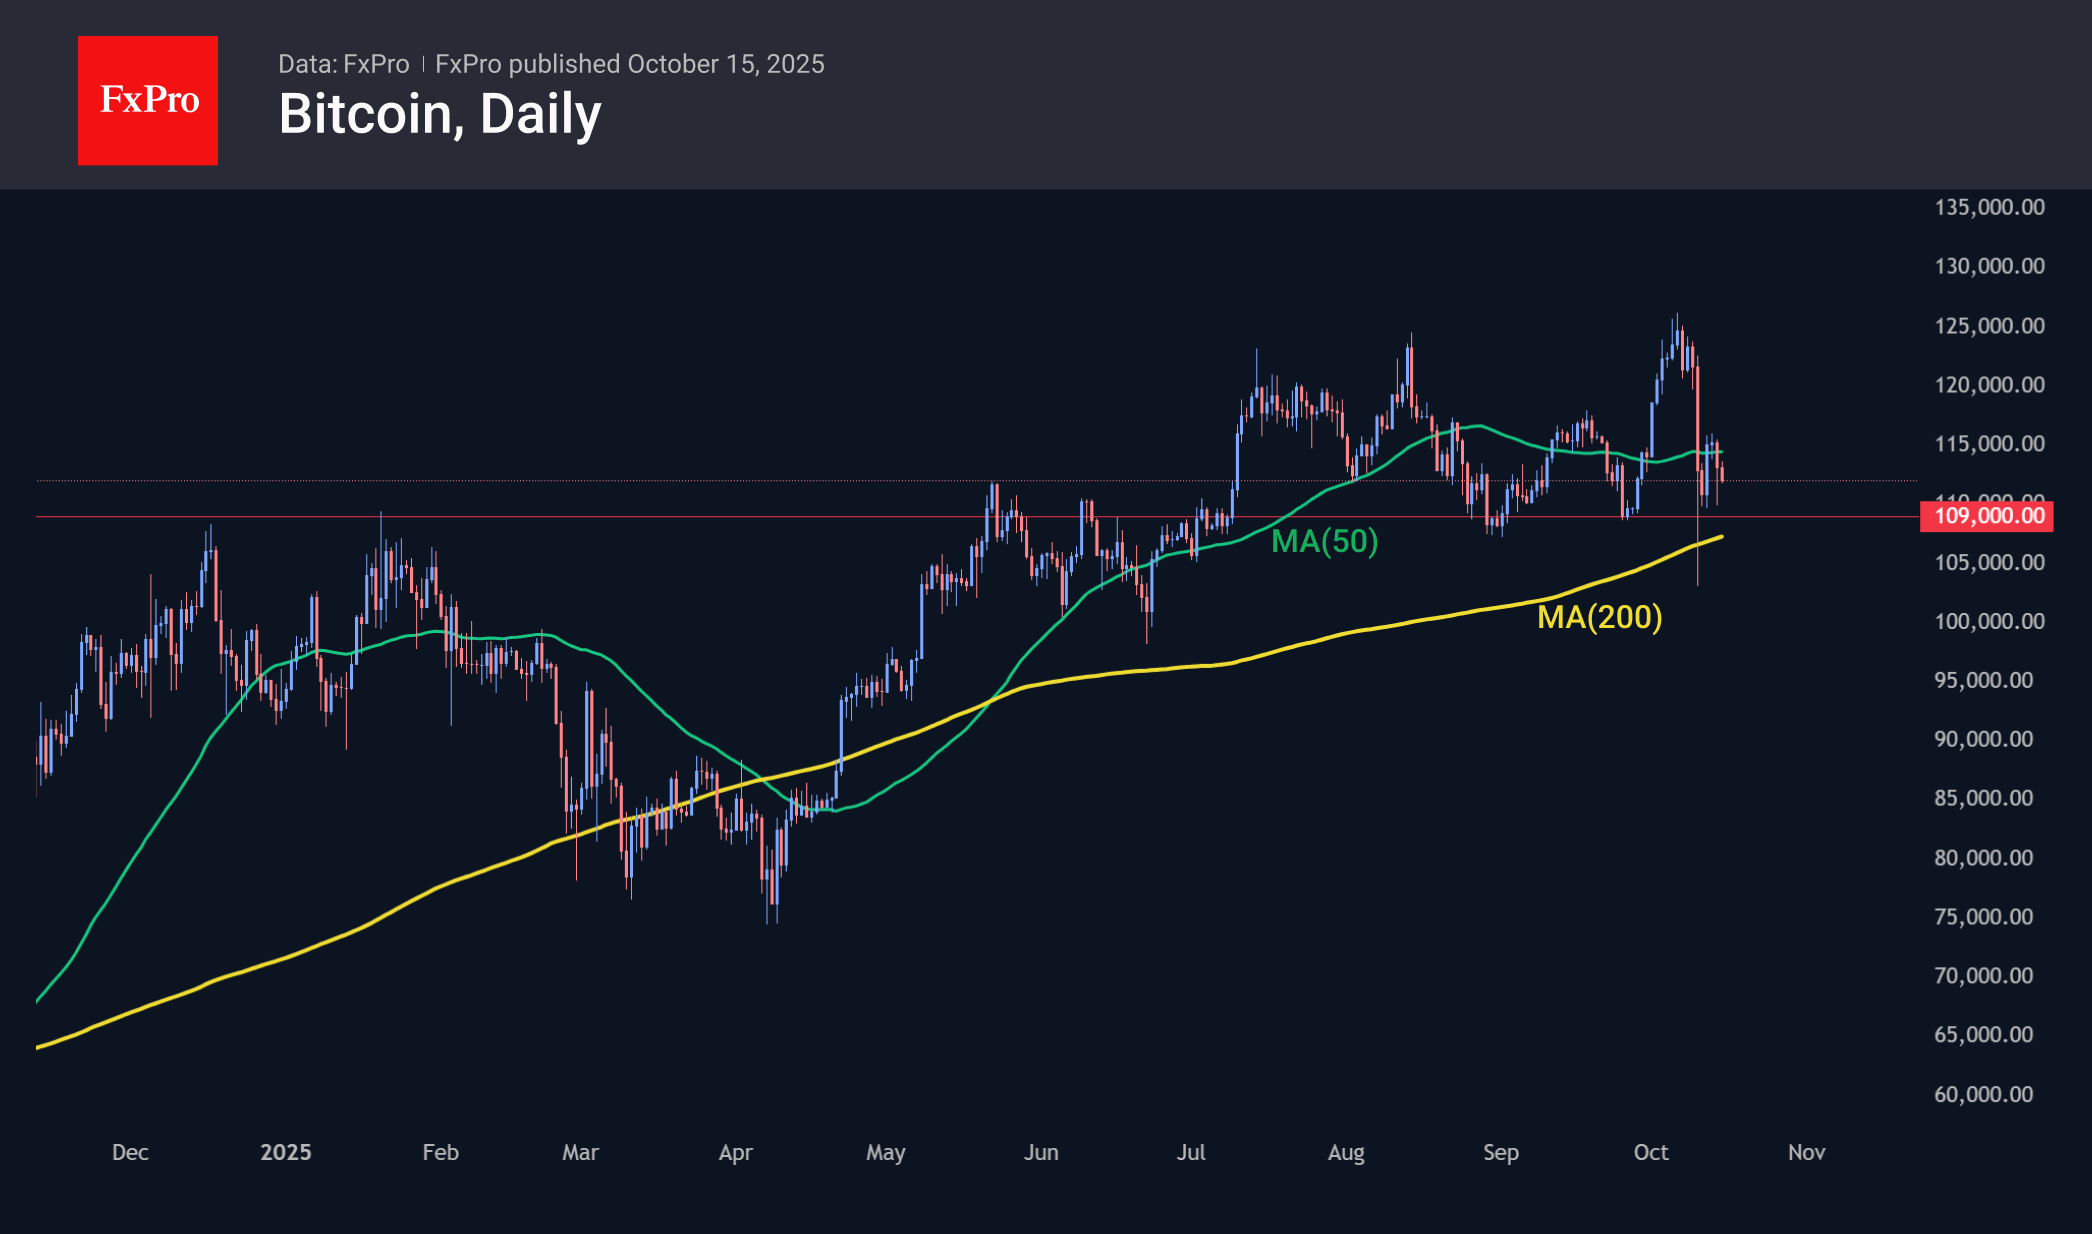
Bitcoin is trading at $112K, recovering some of Tuesday’s losses, during which the price fell from $115.6K to $110K. Since the start of the day on Wednesday, selling has prevailed again, but our focus remains on the $109–110K zone, where BTCUSD has found support in recent months. Has buyer interest remained at these levels, or has the balance of power shifted lower?
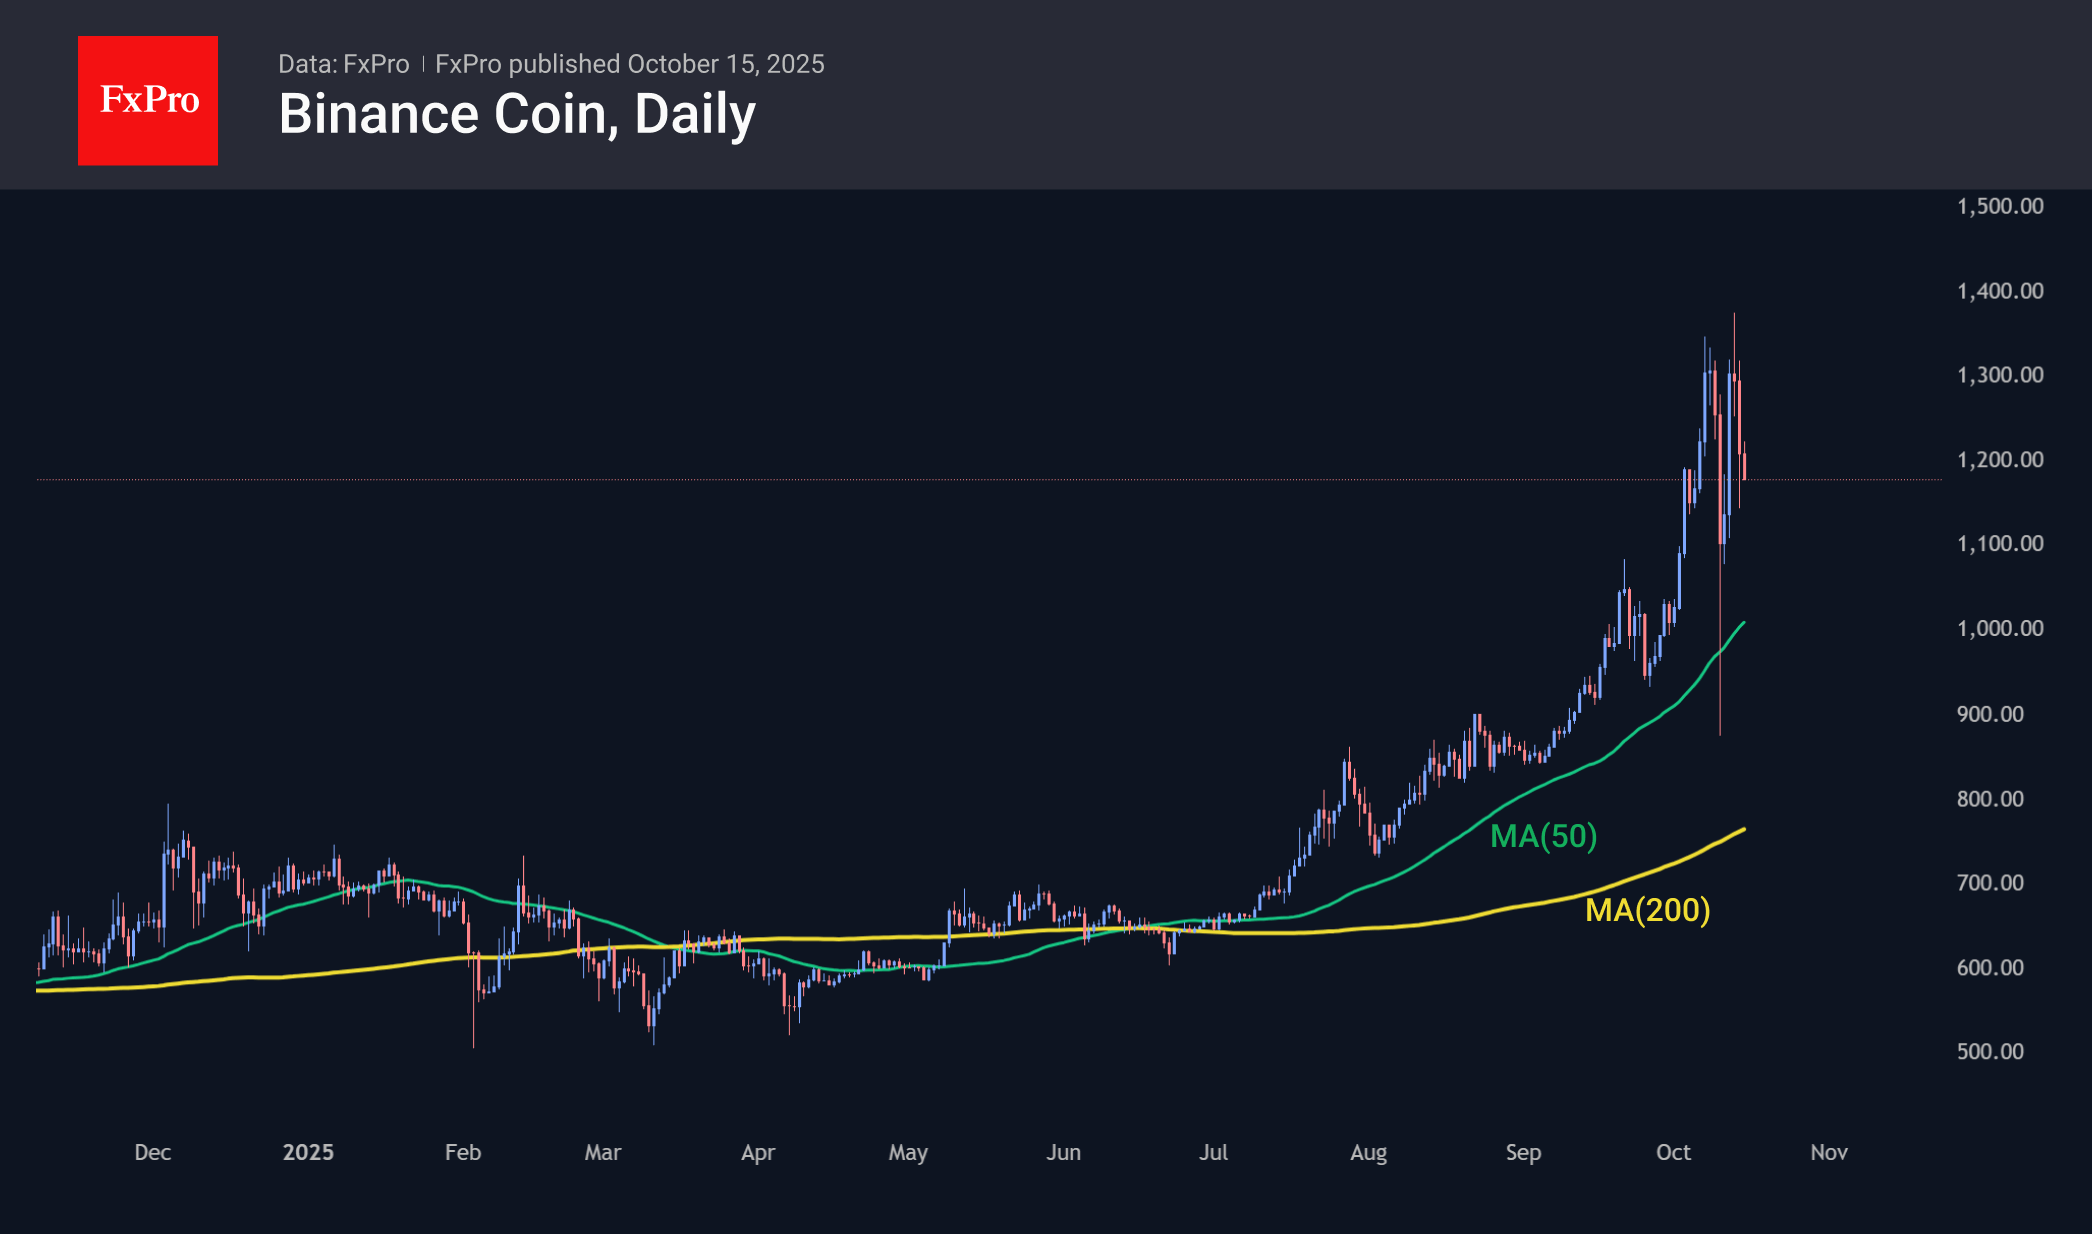
BNB is trading at $1180, almost 15% below Monday’s peak. This dynamic eloquently points to a change in cryptocurrency trading volumes, where a sustained decline is a sign of waning trading activity. From a technical analysis perspective, BinanceCoin has the potential to decline to the $1050-1100 range.
News Background
Fear and uncertainty among retail investors remain one of the most accurate signals for BTC accumulation, according to Santiment. Negative sentiment among small players has reached an annual high, which is often a signal of a reversal.
The recent market decline was not a panic sell-off, but rather a controlled deleveraging — the liquidation of leveraged positions, according to CryptoQuant.
Bitcoin’s correlation with gold has approached a historic high of 0.9. The narrative of digital gold is still alive, and the demand for protection against inflation has not disappeared, notes CryptoQuant CEO Ki Young Ju.
Ethereum developers have successfully deployed a test version of a major Ethereum update called Fusaka on the Sepolia network. The next step is to test the upgrade in Hoodi, scheduled for 28 October.
The Kingdom of Bhutan will migrate its national digital identity (NDI) system from Polygon to Ethereum to improve data security. The complete transition of the platform is expected by the first quarter of 2026.
Hang Seng Index: At Inflection Zone for Bullish Reversal, Medium-Term Uptrend Intact
Key takeaways
- The Hang Seng Index remains in a medium-term uptrend, despite a recent 9% pullback triggered by renewed US-China trade tensions.
- China’s core CPI rose to a 19-month high of 1% in September 2025, easing deflation fears and boosting market confidence.
- Technical indicators show bullish momentum, with key short-term support at 25,140 and upside resistance near 27,500.
- A sustained yuan appreciation continues to underpin Hong Kong’s equity market recovery.
The price actions of the Hong Kong 33 CFD Index (a proxy of the Hang Seng Index futures) have staged the expected bullish movement and rallied by 4.25% from 15 September 2025, surpassing the 26,940 resistance highlighted in our previous report, and hit an intraday high of 27,401 on 2 October 2025 (just whisker away from a major resistance of 27,500).
Thereafter, the Hong Kong 33 CFD Index tumbled by 9% (high to low) from 2 October 2025 to print an intraday low of 24,918 on Friday, 10 October 2025, due to renewed trade tensions between the US and China.
Let’s now examine the key macro factors that are likely to support the continuation of the medium-term bullish trends in the China and Hong Kong stock markets since April 2025 (ex-post US “Liberation Day” tariffs announcement).
China's core CPI continues to recover, reducing the risk of a deflationary spiral
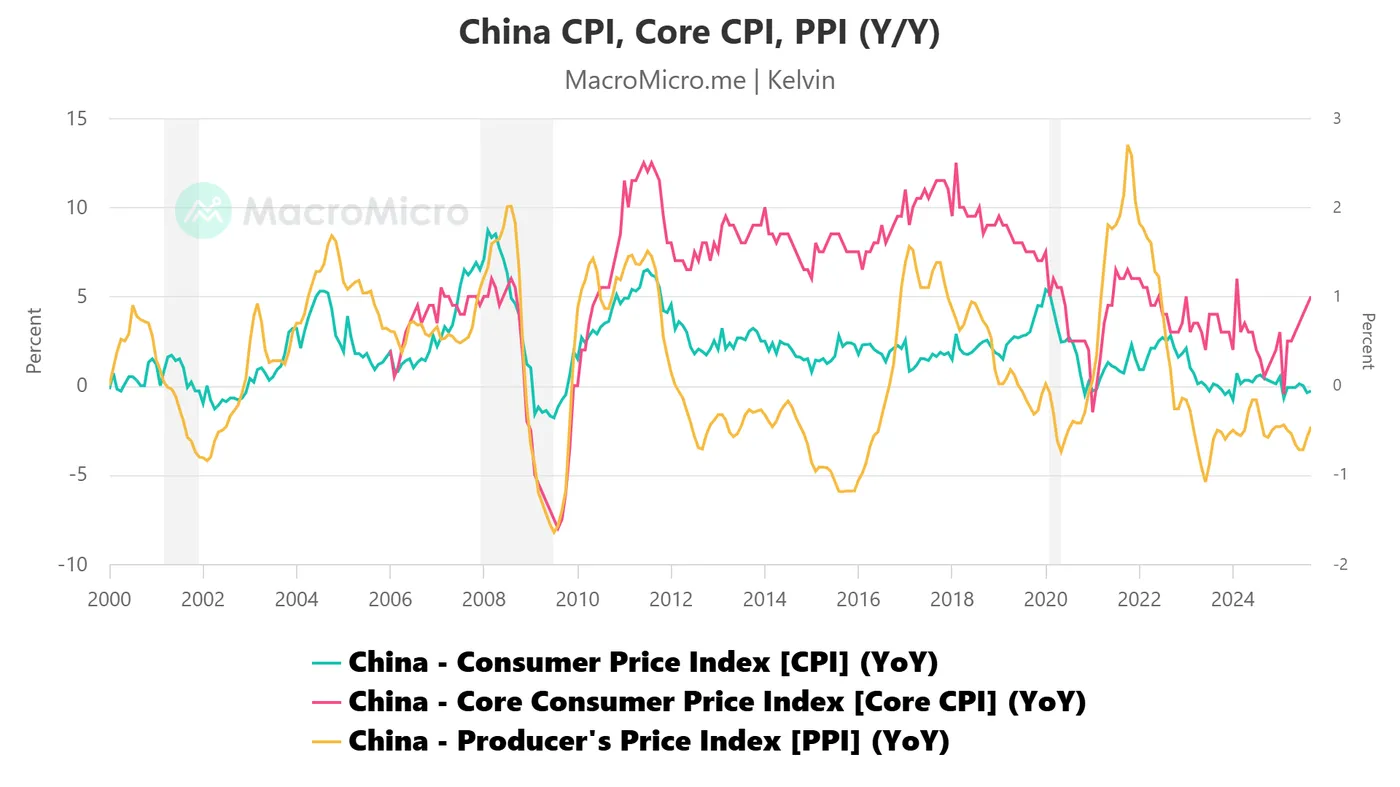
Fig. 1: China CPI, Core CPI & PPI as of Sep 2025 (Source: TradingView)
China’s headline CPI prices dropped by 0.3% y/y in September 2025, steeper than the consensus estimates of a 0.1% decline but slightly less than a 0.4% drop in August 2025.
However, China’s core CPI inflation rate (stripping out food and energy) has continued to increase; it rose by 1% year-over-year (y/y) in September 2025, from 0.9% in August 2025, marking the highest reading in 19 months (see Fig. 1).
Additionally, the deceleration in China’s producer prices (PPI) has begun to slow, as they fell 2.3% year-over-year (y/y) in September 2025, easing from a 2.9% drop in August 2025, in line with consensus estimates, marking the mildest contraction since February 2025.
These latest inflationary data prints have reduced the risk of a deflationary spiral in the Chinese economy; in turn, this may see an uptick in consumer confidence in Q4 2025, which can trigger a positive feedback loop back into the China and Hong Kong stock markets.
Now, let's turn our attention to decipher the latest short-term (1 to 3 days) trajectory, key levels, and elements to watch on the Hang Kong 33 CFD Index from a technical analysis perspective.
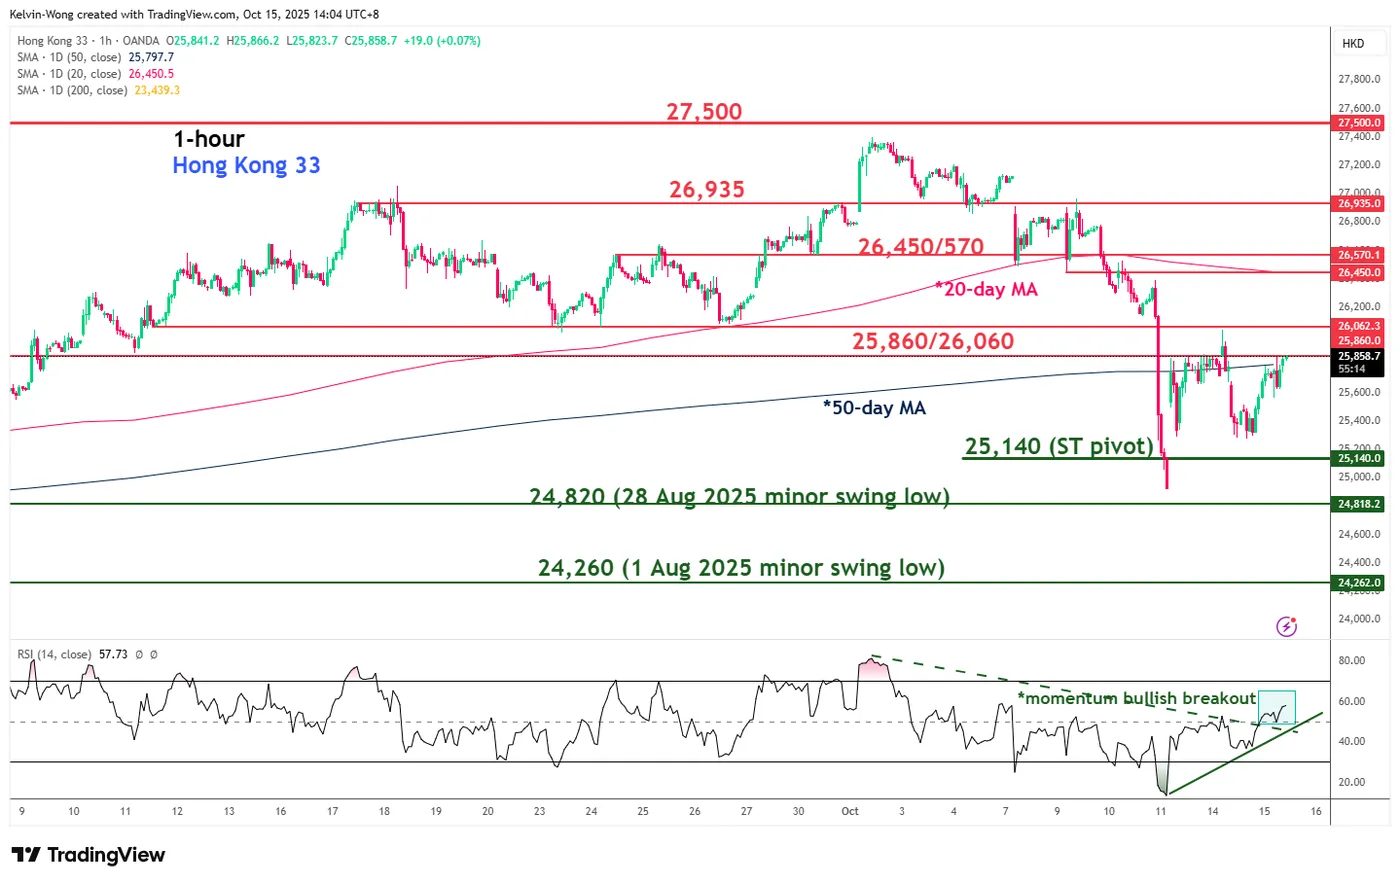
Hong Kong 33 CFD Index minor trend as of 15 Oct 2025 (Source: TradingView)
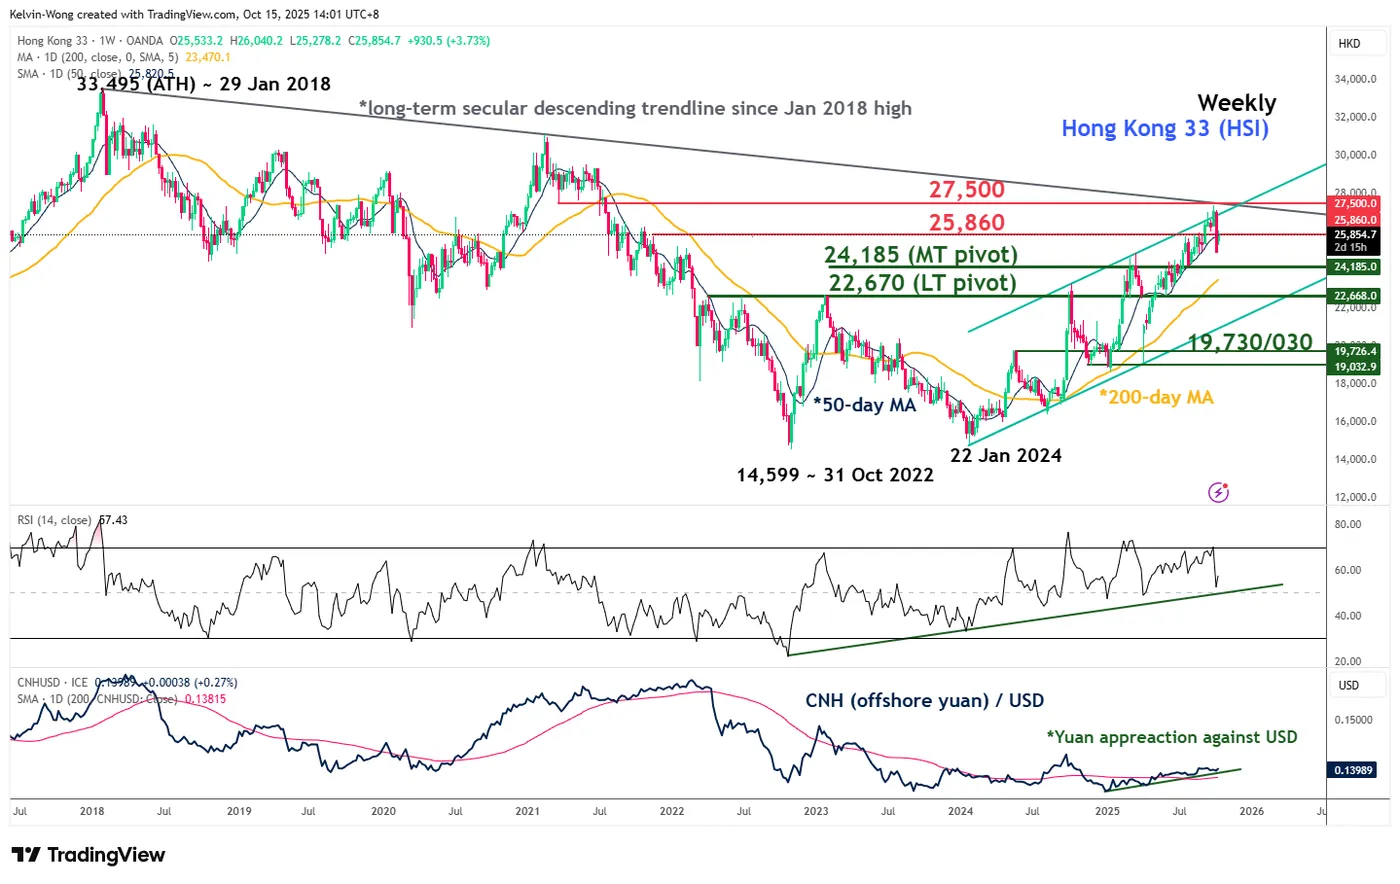
Fig. 3: Hong Kong 33 CFD Index medium-term & major trends as of 15 Oct 2025 (Source: TradingView)
Preferred trend bias (1-3 days) – Bullish reversal at gap support
Tuesday, 14 October 2025’s minor corrective decline of 2.9% (high to low) has stalled and reversed right at the gap support formed at the start of Monday’s 13 October 2025 Asia session.
Bullish bias above 25,140 key short-term pivotal support and a clearance above the 25,860/26,060 (upside trigger level) sees the next intermediate resistance coming in at 26,935 before a test on the 27,500 major resistance (see Fig. 2).
Key elements
- The hourly RSI momentum indicator of the Hong Kong 33 CFD Index has staged a bullish momentum breakout condition on Tuesday, 14 October 2025, US session (see Fig. 2).
- The major uptrend phase of the Hong Kong 33 CFD Index has been in place since 22 January 2024 low remaining intact, supported by a steady appreciation of the offshore yuan (CNH) against the US dollar (see Fig. 3)
- The major resistance of the Hong Kong 33 CFD Index stands at 27,860, defined by the major descending trendline from the 29 January 2018 all-time high, and the upper boundary of a major ascending channel from the 22 January 2024 low.
Alternative trend bias (1 to 3 days)
Failure to hold at the 25,140 key short-term support invalidates the bullish reversal scenario on the Hong Kong 33 CFD Index for the continuation of the corrective decline sequence to expose the next intermediate supports at 24,820 and 24,260.
EUR/USD Attempts Recovery While USD/JPY Corrects Gains
EUR/USD is recovering losses from 1.1540. USD/JPY is correcting gains from 153.20 and might decline further below 151.00.
Important Takeaways for EUR/USD and USD/JPY Analysis Today
- The Euro struggled to stay in a positive zone and declined below 1.1650 before finding support.
- There was a break above a connecting bearish trend line with resistance at 1.1590 on the hourly chart of EUR/USD at FXOpen.
- USD/JPY rallied significantly before the bears appeared near 153.20.
- There is a major bearish trend line forming with resistance near 151.55 on the hourly chart at FXOpen.
EUR/USD Technical Analysis
On the hourly chart of EUR/USD at FXOpen, the pair started a fresh decline from 1.1720. The Euro declined below 1.1650 and 1.1600 against the US Dollar.
The pair even declined below 1.1565 and the 50-hour simple moving average. Finally, it tested the 1.1540 zone. A low was formed at 1.1541, and the pair is now recovering losses. There was a move above 1.1600 and a connecting bearish trend line at 1.1590.
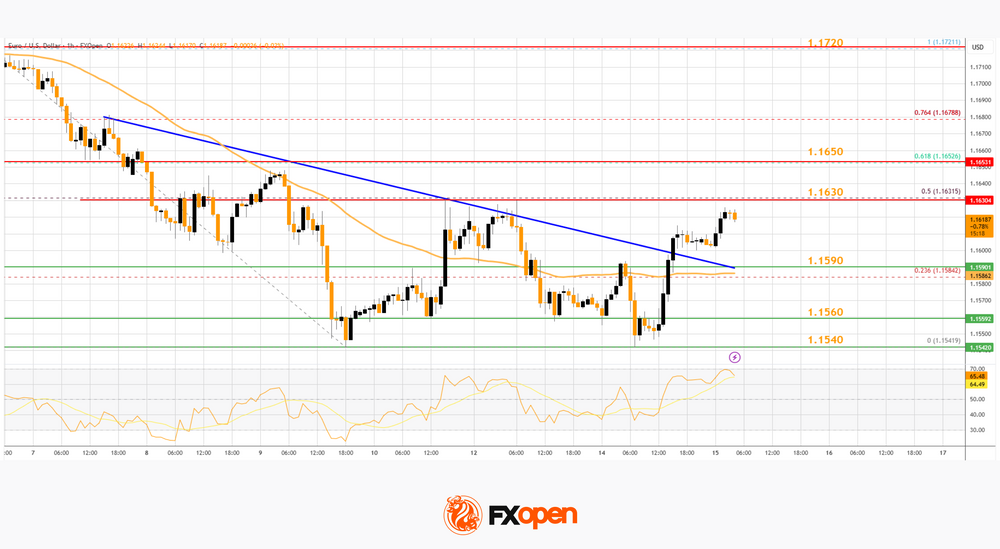
The pair surpassed the 23.6% Fib retracement level of the downward move from the 1.1721 swing high to the 1.1541 low. On the upside, the pair is now facing resistance near the 50% Fib retracement at 1.1630.
The first major hurdle for the bulls could be 1.1650. An upside break above 1.1650 could set the pace for another increase. In the stated case, the pair might rise toward 1.1720.
If not, the pair might drop again. Immediate support is near the 50-hour simple moving average and 1.1590. The next key area of interest might be 1.1540. If there is a downside break below 1.1540, the pair could drop toward 1.1500. The main target for the bears on the EUR/USD chart could be 1.1440, below which the pair could start a major decline.
USD/JPY Technical Analysis
On the hourly chart of USD/JPY at FXOpen, the pair started a steady decline from well above the 153.00 zone. The US Dollar gained bearish momentum below 152.50 against the Japanese Yen.
The pair even settled below 152.00 and the 50-hour simple moving average. A low was formed at 151.00, and the pair is now consolidating losses. On the downside, the first major support is near 151.00.
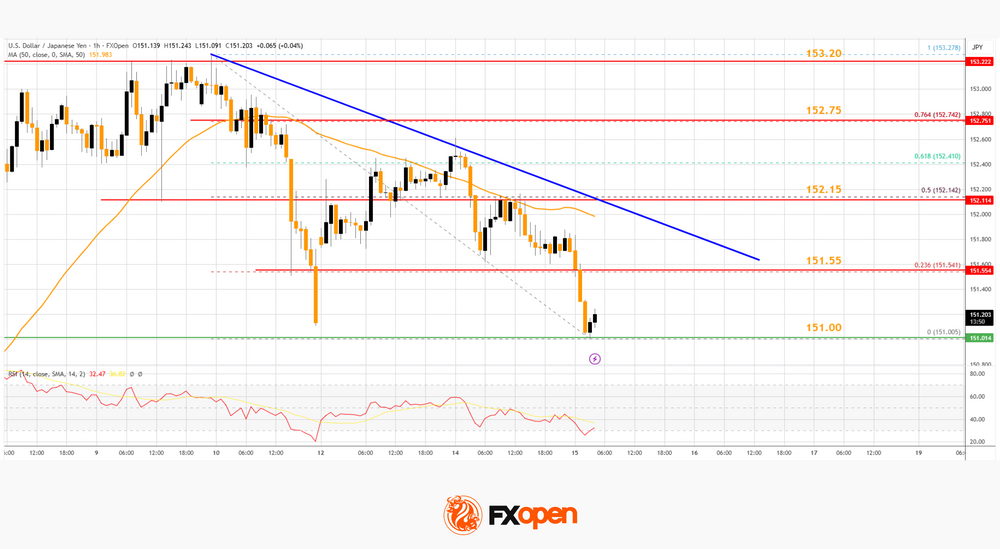
The next key region for the bulls might be 150.00. If there is a close below 150.00, the pair could decline steadily. In the stated case, the pair might drop toward 148.80. Any more losses might send the pair toward 148.00.
Immediate resistance on the USD/JPY chart is near the 23.6% Fib retracement level of the downward move from the 153.27 swing high to the 151.00 low at 151.55. There is also a major bearish trend line at 151.55.
If there is a close above the trend line and the hourly RSI moves above 50, the pair could rise toward 152.00 or the 50% Fib retracement level at 152.15. The next major barrier for the bulls could be 152.75, above which the pair could test 153.50 in the coming days.
Trade over 50 forex markets 24 hours a day with FXOpen. Take advantage of low commissions, deep liquidity, and spreads from 0.0 pips. Open your FXOpen account now or learn more about trading forex with FXOpen.
This article represents the opinion of the Companies operating under the FXOpen brand only. It is not to be construed as an offer, solicitation, or recommendation with respect to products and services provided by the Companies operating under the FXOpen brand, nor is it to be considered financial advice.
With the French Sting Removed, Euro Enjoying a Sigh of Relief
Markets
Speeches from the Fed, ECB and BoE chairs made up for the gap in the economic calendar yesterday. The one from Fed’s Powell rubberstamped another 25 bps rate cut on October 29. He said the economic outlook was largely unchanged since the September meeting. Powell highlighted growing labour market risks: “available evidence suggests that both layoffs and hiring remain low, and that both households’ perceptions of job availability and firms’ perceptions of hiring difficulty continue their downward trajectories.” The “available evidence” for the time being is a range of non-government data Powell said, adding that the lack of official data due to the shutdown could start to make things more challenging for the October month. The chair also clearly hinted quantitative tightening could end somewhere in the coming months. The Fed is approaching the point when reserves “are somewhat above the level we judge consistent with ample reserve conditions”. The amount recently dropped below $3tn. Fed’s Waller in early 2023 said 10-11% of GDP would be optimal, a level that back then corresponded to around $2.7tn reserves. ECB president Lagarde stuck to the message delivered last month: risks to the inflation and economic outlook are balanced and the ECB is well-positioned to respond to potential shocks. She would, however, never say the ECB is done cutting rates. While it’s a typical central bank strategy to keep all options open in an uncertain environment, markets could consider it a cue for further easing. They currently give it about a 50% chance for it to happen by 2026Q1. Bailey from the Bank of England, finally, warned of the competing risks from above-target inflation and a weakening labor market. The IMF in its outlook update cautioned the UK may suffer the fastest price growth over the next two years. Bailey did note that below-potential growth could drag down inflation over time and said he saw signs of a softening labour market appearing in yesterday’s report. None of the speeches had a material impact on bond markets though. Gilts outperformed after the labour market report, showing yield declines of -4.9 to -6.9 bps in a bull flattener. German rates dropped up to 3.2 bps at the long end while those in the US changed between -2.1 bps (2-yr) to +1.3 bps (30-yr). French OATs outperformed peers, narrowing the swapspread after the key Socialist Party said they won’t vote to oust premier Lecornu in a vote of no confidence. Two motions will be debated tomorrow. Comments from the other kingmaker party, Les Républicains, suggest they won’t vote against Lecornu either. With the French sting removed for the time being, the euro is enjoying a sigh of relief. EUR/USD bounced back north of 1.16, with some help of a weaker dollar this morning too. Stock futures suggest a strong opening in the green. The trade theme serves as the important wild card here with the topic back at the center of attention and proven capable of disrupting sentiment in a heartbeat.
News & Views
Chinese prices didn’t fall for a third consecutive month in September. They rose by 0.1% M/M following a 0.4% increase in July and stabilization in August. On an annual level, they are nevertheless 0.3% lower. A steeper drop in food prices (-4.4% Y/Y) was the main drag on the headline CPI. Details showed a slower pace of goods deflation (-0.8% Y/Y from -1% Y/Y) while services inflation remained steady at 0.6% Y/Y. Core CPI (excluding food and energy) accelerated from 0.5% Y/Y to 1% Y/Y (19-month high). Produces prices were unchanged for a second consecutive month with the annual PPI index 2.3% lower compared with last year (from -2.9% Y/Y). Statistical effects and measures to curb price competition rather than a surge in demand was behind the September price dynamics.
RBA assistant governor Hunter sounded hawkish in an interview this morning. She warns that underlying inflation in the three months through September is likely to be stronger than the Reserve Bank of Australia anticipated. She specifically mentioned housing construction and market services. Crucial Q3 CPI numbers are due October 29 with the RBA meeting one week later. Together with stubborn core inflation, Hunter notes that the labor market and broader economic conditions remain tight. Her comments suggest that the bar to cut the policy rate from the current 3.6% in November might be higher than currently discounted by money markets (40% probability). Since the central bank starting lowering its policy rate in February this year, they stuck with quarterly cuts (May & August) suggesting this pattern could break. AUD/USD is slightly stronger this morning at 0.6515 after being pulled lower in recent days over the intensifying US-Chinese trade dispute.
French Premier Wins Backing by Suspending Pension Reform
In focus today
In Norway, the fiscal budget for 2026 is published, where we expect a slightly expansionary effect, with an oil-adjusted deficit around 2.8% of the Petroleum Fund. This would be in line with Norges Bank's assumption from the monetary policy report in September and should therefore be neutral for monetary policy outlook. Remember that Norway has a minority government and is dependent on four other parties to get the budget through Parliament.
In Sweden, the details for September inflation will be published today. The preliminary outcome showed CPIF excluding energy at 2.70%, CPIF at 3.09%, and CPI at 0.89% for September. The preliminary outcome was in line with our forecast and close to the Riksbank's forecast.
Economic and market news
What happened overnight
In China, consumer prices fell 0.3% y/y in September (cons: -0.2%, prior: -0.4%) amidst weak demand, with food prices seeing their sharpest contraction since January 2024, while core inflation rose to a 19-month high of 1.0% y/y. Producer prices dropped 2.3% y/y, the mildest decline since February, reflecting Beijing's efforts to curb excess capacity. Easing declines in mining and raw materials supported the result, while consumer goods prices remained weak.
What happened yesterday
In France, Prime Minister Lecornu presented the draft budget for 2026 and announced a suspension of the 2023 pension reform until the presidential elections in 2027. Suspending the pension reform was a key demand from the Socialists to ensure the government's survival in the two no-confidence votes scheduled tomorrow. The Socialists' leader said that the party would not vote to oust the government, which significantly increases the chances that Lecornu survives. The yield spread against Germany narrowed by three basis points to 80, reflecting increased optimism about the government's stability, the likelihood of reaching a 2026 budget, and avoiding snap elections. The draft budget proposed a EUR 30bn deficit reduction next year to 4.7% of GDP. However, the final deficit is expected to be closer to 5% of GDP, as Lecornu stated he would secure parliamentary approval with a majority rather than resorting to article 49.3. While we see these developments as positive in the short term, a complete reversal of the pension reform would place additional strain on France's already weak public finances, which rating agencies would see as negative. The suspension is projected to cost EUR 400m in 2025 and EUR 1.7bn in 2026, while a permanent suspension by 2030 potentially costing EUR 13.5bn.
In Germany, investor confidence in October came in weaker than expected according to the ZEW survey. The assessment of the current economic situation fell to -80.0 (cons: -74.2) from -76.4, while expectations rose to 39.3 (cons: 41.1) from 37.3. The large decline in the current situation suggests that the German economy is still broadly stagnating, meaning that fiscal easing is needed to drive growth as private demand cannot do it alone now. Hence, we expect the German to continue stagnating until early next year when fiscal easing kicks in.
In the US, NFIB offered some interesting details on how small businesses see the outlook, while we wait for the official US data. Optimism declined as the index fell from 100.8 in August to 98.8 in September, even though hiring and capex plans remained mostly steady. Instead, tariff-related issues were a rising concern, with 64% of respondents saying supply chain disruptions were affecting their businesses (Aug. 54%). Inventory satisfaction declined sharply, and price plans edged higher. It is worth noting as this has historically led changes in the official CPI by few months.
In a dovish statement, Fed Chair Powell noted that although that the economy might be on firmer footing than expected, the labour market remains weak and "downside risks to employment have increased". Powell confirmed the Fed's meeting-by-meeting approach to rate decisions, balancing above-target inflation with job market concerns. He highlighted that tariffs, rather than broader pressures, are driving elevated goods prices. Markets took his speech as a signal that he could be ready to support an interest rate cut in October. Our call aligns with markets in expecting a 25bp rate cut at the upcoming meeting.
President Trump announced he is considering terminating certain trade ties with China, including cooking oil imports, as a response to reduced US soybean purchases by China. The move highlights escalating trade tensions, with Washington and Beijing already at odds over tariffs, supply chains, and broader geopolitical issues.
In the ECB, despite the lack of tier 1 data, there has recently been a slight dovish twist from key ECB members with Villeroy (dovish, voter at the upcoming meeting) noting that he sees "more downside than upside inflation risks" and that "the next rate move more likely cut than hike". This underscores the dovish tone from the September minutes, which highlighted that several members view inflation risks as tilted to the downside and that "a further rate cut in the coming months would better protect the inflation target both under the baseline and across a range of adverse scenarios, the materialization of upside risks would instead warrant maintaining the current level of the policy rate". Our call is that the ECB is done cutting interest rates, but we do recon the downside risks of a cut in December or one of the following meetings, although it is not our base case.
In the UK, data came in on the weak side of expectations yesterday with particularly the unemployment rate edging higher to 4.8% and private sector wage growth declining to 4.4 % 3M/YoY from 4.7%. At the same time, retail sales eased significantly from 2.9% in August to 2.0% in September, as consumers are bracing for tax increases in the upcoming November budget. The data was not all dire though, with job loss at a modest 10K in September and a revision for less steep payroll decline over recent months. In sum, data to the weak side keeps the chance of a November BoE rate cut alive, even if one of the following meetings is starting to look more likely. BoE governor Bailey also expressed concern about the jobs market in a public appearance yesterday.
Equities: Equities were mixed yesterday in a quite volatile session following Monday's bounce. Markets were highly sensitive to Trump news, with a slightly confrontational Truth Social post tempering risk appetite. S&P 500 declined -0.2% while Stoxx 600 was -0.4% lower. In the US, breadth was positive with 1pp performance difference between market cap- and equal weighted and value cyclicals topped AI/growth. In Europe, it was a bit of the reverse with lower long end yields triggering buying in real estate. Futures are higher this morning, primarily in Europe.
FI and FX: Yesterday, the Federal Reserve Chairman Powell indicated that the Federal Reserve would lower rates at the meeting on 29 October given the weakness in the labour market. This is fully priced by the market as well as the second rate cut in December. Powell also hinted that they may slow the balance sheet reduction in coming months to maintain liquidity in the short-term money market. This sent bond yields modestly lower, and the curve steepened. This has continued in Asian trading this morning.
There was also a bullish sentiment in the European fixed income market yesterday, but the curves flattened, and spreads tightened between France and Germany as the French PM propose suspending the pension reform law and won support for his plan from the Socialist opposition such that he may survive the vote of confidence expected on Thursday.
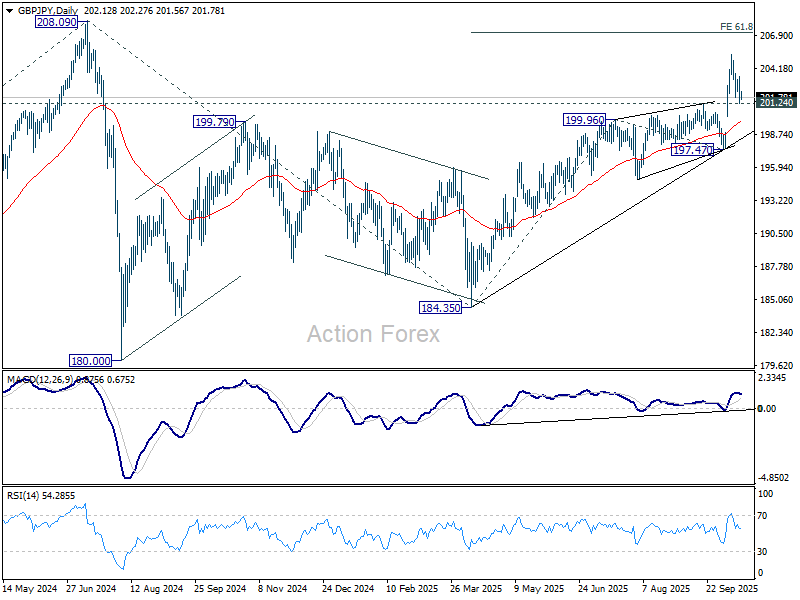
GBP/JPY Daily Outlook
Daily Pivots: (S1) 201.19; (P) 202.35; (R1) 203.37; More...
Outlook in GBP/JPY is unchanged and intraday bias remains neutral. With 201.24 resistance turned support intact, further rally is still in favor. Break of 205.30 will target 61.8% projection of 184.35 to 199.96 from 197.47 at 207.11. However, firm break of 201.24 will confirm short term topping and bring deeper fall back to 197.47 support instead.
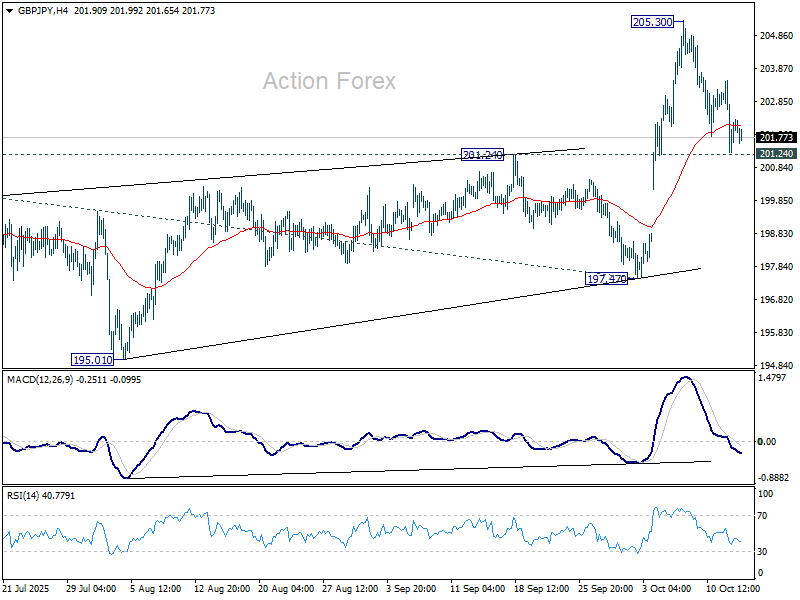
In the bigger picture, price actions from 208.09 (2024 high) are seen as a corrective pattern which might have completed at 184.35. Firm break of 208.09 high will resume the up trend from 123.94 (2020 low). Next target is 61.8% projection of 148.93 to 208.09 from 184.35 at 220.90. However, firm break of 197.47 will dampen this view and could extend the corrective pattern with another fall.
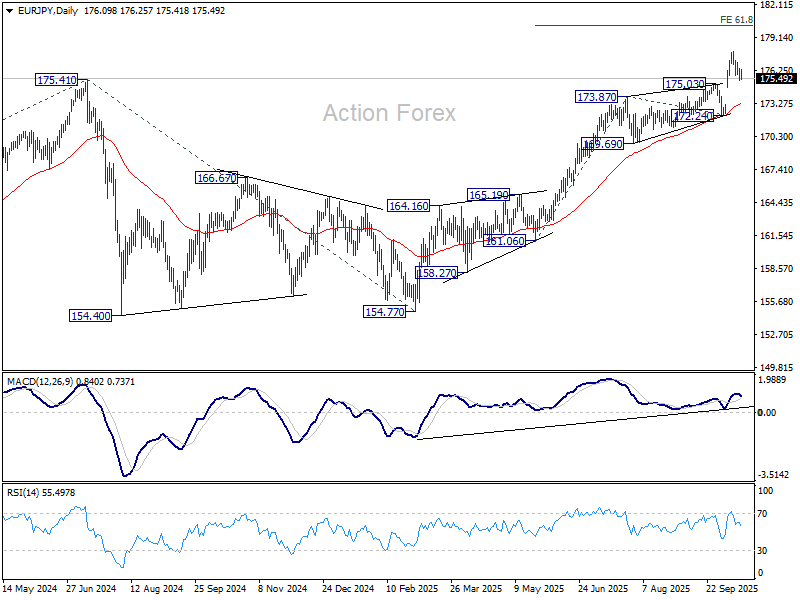
EUR/JPY Daily Outlook
Daily Pivots: (S1) 175.55; (P) 176.01; (R1) 176.65; More...
No change in EUR/JPY's outlook. Intraday bias stays neutral and more consolidations could be seen. Further rise is expected as long as 175.03 resistance turned support holds. On the upside, break of 177.91 will target 61.8% projection of 161.06 to 173.87 from 172.24 at 180.15 next. However, firm break of 175.03 will confirm short term topping and bring deeper fall back to 172.24 support.
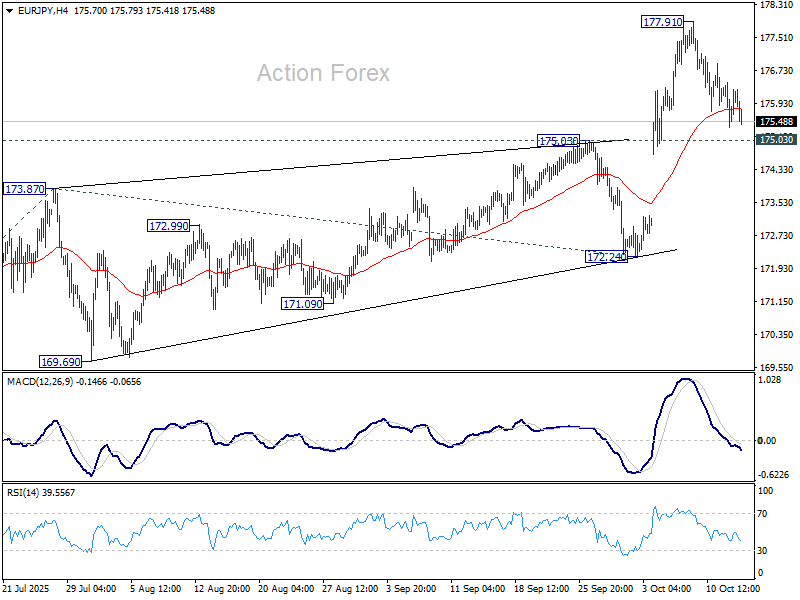
In the bigger picture, up trend from 114.42 (2020 low) is in progress and should target 61.8% projection of 124.37 to 175.41 from 154.77 at 186.31. Firm break of 172.24 support will suggests that it has turned into consolidations again. But still, outlook will continue to stay bullish as long as 55 W EMA (now at 167.16) holds, even in case of deep pullback.
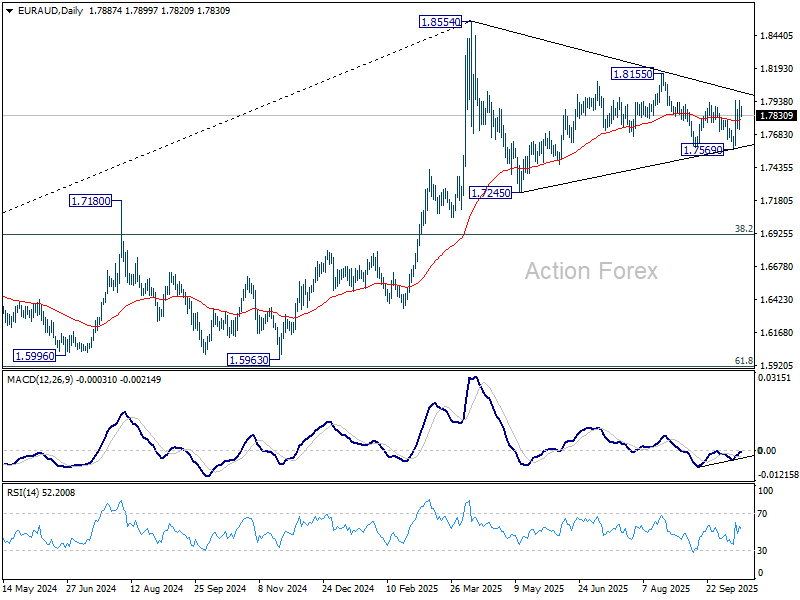
EUR/AUD Daily Outlook
Daily Pivots: (S1) 1.7764; (P) 1.7856; (R1) 1.7987; More...
Intraday bias in EUR/AUD is turned neutral as rebound from 1.7569 lost momentum. Outlook is unchanged that fall from 1.8155 could have completed at 1.7569 already. Above 1.7943 will target 1.8155 resistance. Firm break there will argue that whole corrective pattern from 1.8554 has also completed and bring retest of this high. However, break of 1.7721 support will break deeper decline towards 1.7569 instead.
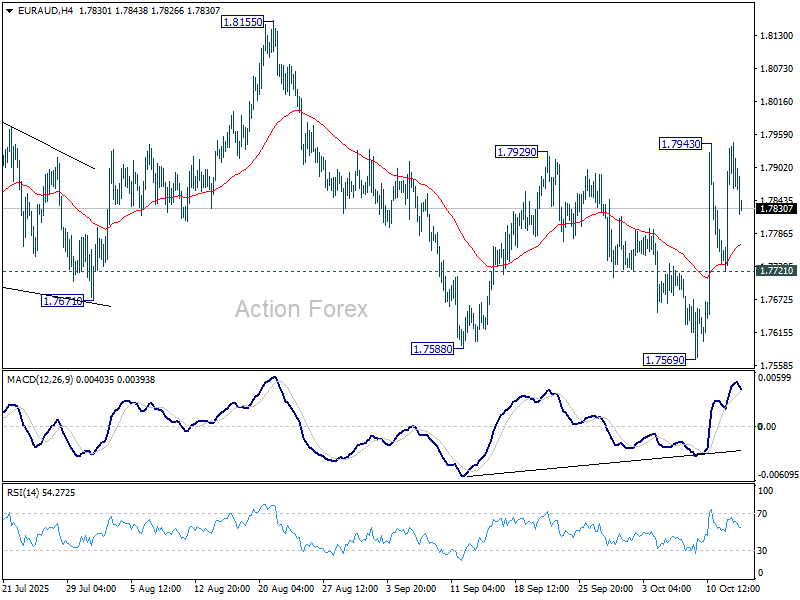
In the bigger picture, price actions from 1.8554 medium term top are seen as a corrective pattern. Deeper fall could be seen as the pattern extends, but downside should be contained by 38.2% retracement of 1.4281 (2022 low) to 1.8554 at 1.6922 to bring rebound. Uptrend from 1.4281 is expected to resume at a later stage.
EUR/CHF Daily Outlook
Daily Pivots: (S1) 0.9284; (P) 0.9296; (R1) 0.9311; More...
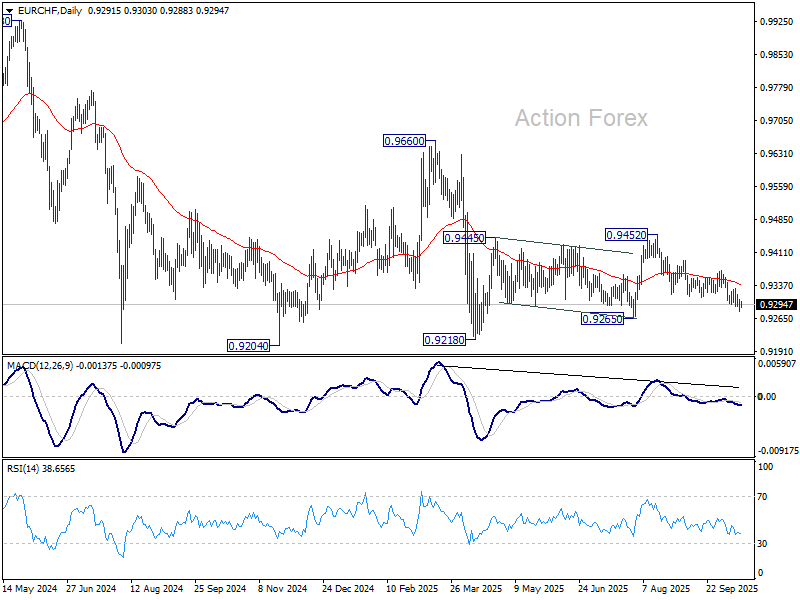
No change in EUR/CHF's outlook and intraday bias remains on the downside. Fall from 0.9452 is in progress for 0.9265 support. Firm break there should confirm that whole corrective rebound from 0.9218 has completed at 0.9452, and deeper fall should be seen to 0.9204/18 support zone. For now, risk will stay on the downside as long as 0.9330 resistance holds, in case of recovery.
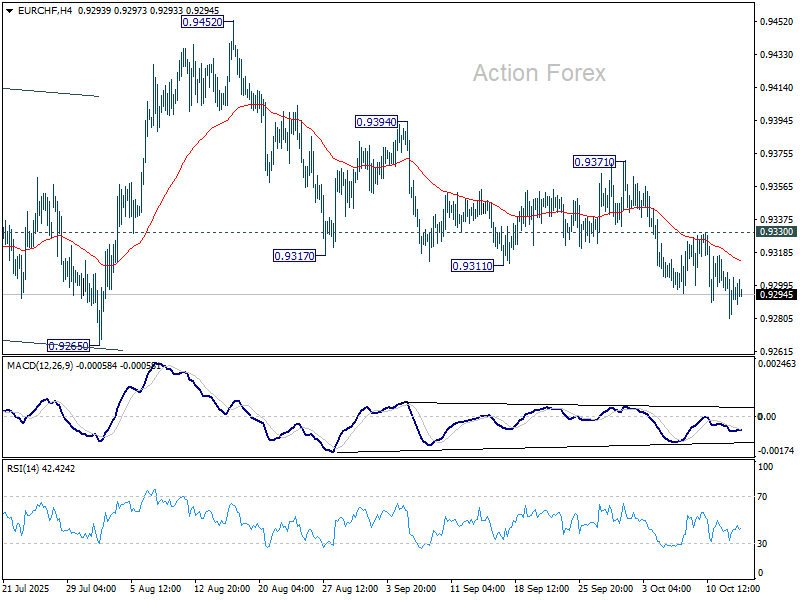
In the bigger picture, the down trend from 0.9204 (2018 high) might still be in progress considering that EUR/CHF is staying well inside the long term falling channel. Bearishness is reaffirmed by rejection at 55 W EMA (now at 0.9405). Firm break of 0.9204 will confirm down trend resumption. On the upside, break of 0.9452 resistance is needed to be the first sign of bullish reversal, and break of 0.9660 is needed to confirm.