Sample Category Title
Bullish on Silver: Why Upside Potential Looks Promising
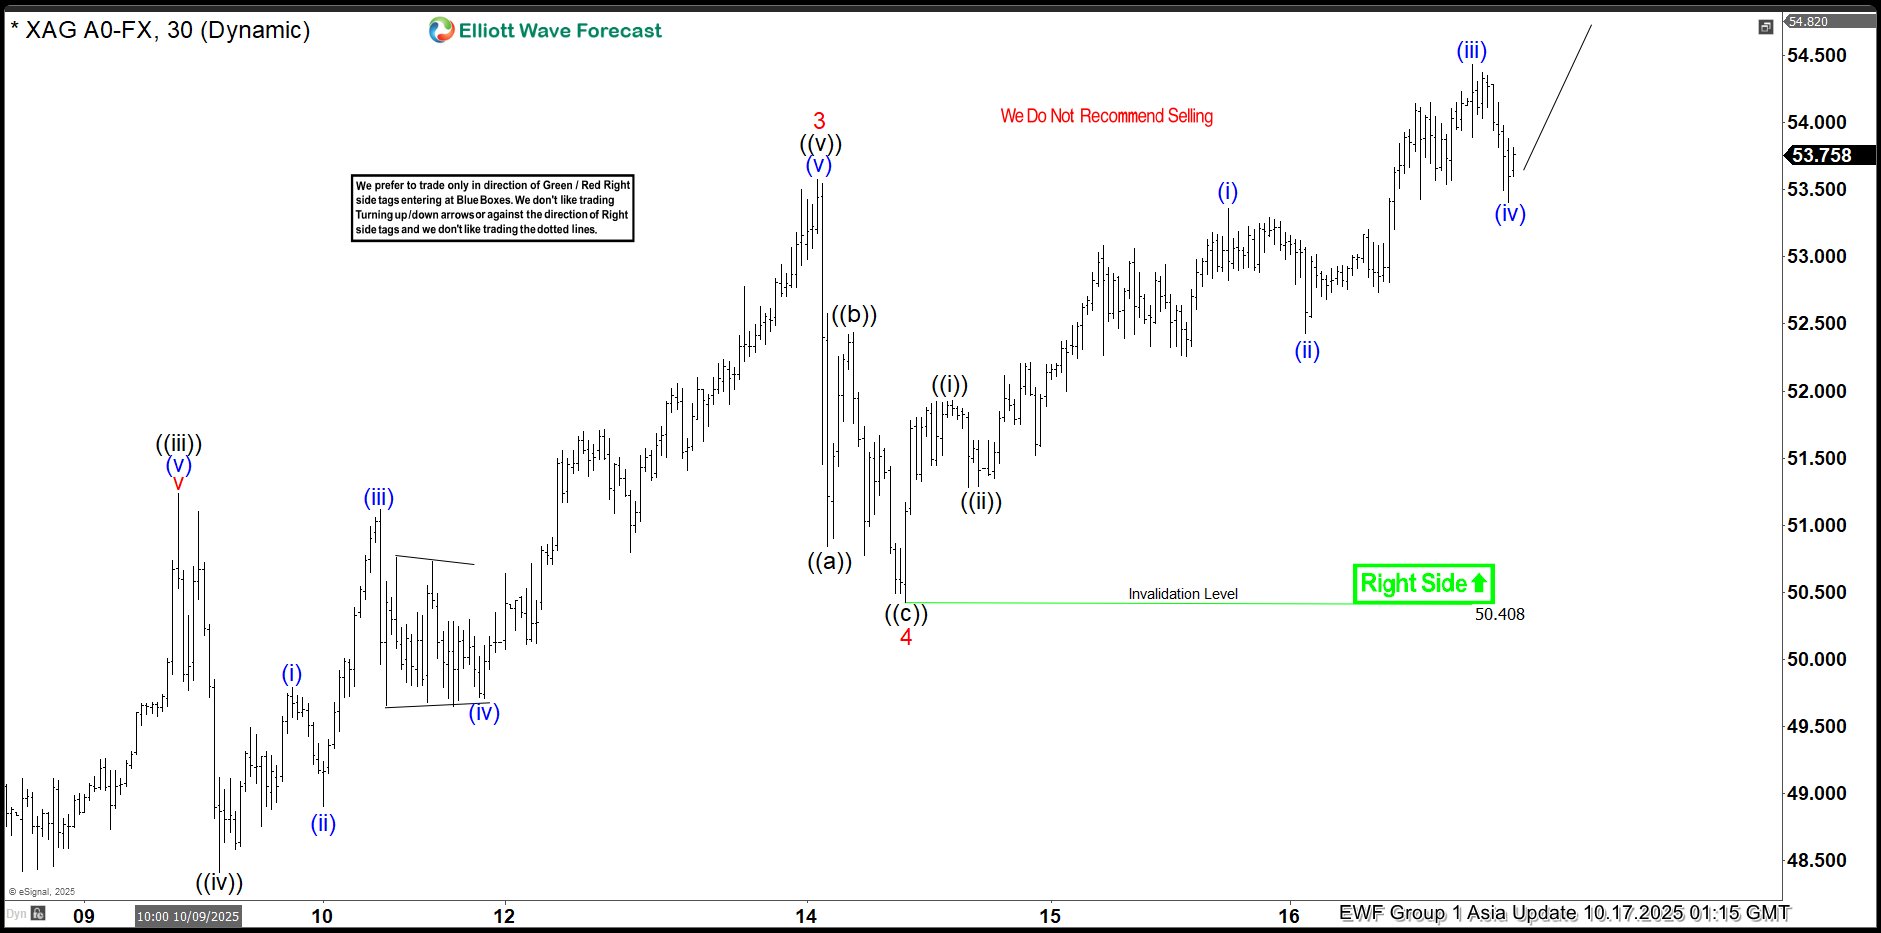
According to short-term Elliott Wave analysis, Silver (XAGUSD) has been in a strong impulsive rally since July 31. The metal initially surged to $38.73 in wave (1), pulled back to $36.94 ended wave (2), and then resumed its upward momentum in wave (3) higher. Whereas wave 1 of (3) ended at $39.06 high, wave 2 pullback ended at $38.06 low. Then a rally to $53.57 high ended wave 3. A subsequent corrective phase, wave 4, formed a zigzag pattern with a final low at $50.42, completing the wave 4.
Silver then launched into wave 5, characterized by a five-wave internal structure. From the wave 4 low, the metal advanced in waves ((i)) to $51.93 and ((ii)) to $51.28 low, with minor sub-waves in waves (i) ended at $53.36 high and (ii) ended at $52.42 low. Up from there, wave (iii) ended at $54.42 high and wave (iv) at $53.40 low. Now as long as Silver stays above $50.40, dips are likely to attract buyers, potentially in a 3, 7, or 11-swing sequence, supporting further upside. This outlook suggests the bullish trend remains intact, with potential for additional gains as the impulsive structure unfolds.
Silver Latest 1-Hour Elliott Wave Chart From 10.17.2025
Silver Elliott Wave Video:
https://www.youtube.com/watch?v=Dl23zcBHHB0
Safe Haven Flows Flocked into US Bonds
Markets
Treasuries rallied yesterday, dragging yields 4.1 to 7.3 bps lower with the front end of the curve outperforming. Safe haven flows flocked into US bonds on reports of two regional banks (Zions & Western Alliance) saying they were the victim of collateral-related fraud on loans to funds that invest in distressed commercial mortgages. Both banks fell more than 10%, dragging the broader regional bank index significantly lower too. This index got to the center of attention back in March 2023, when other regional lenders including Silicon Valley Bank failed and caused tremors across other markets. The current matter is different from the underlying issues back then (Treasuries deeply under water due to the Fed’s tightening cycle) and it remains to be seen if this is an isolated, one-off event. Being in a late cycle economy, however, it does trigger investor concerns of wider spread cracks emerging in the credit market. The lack of other news puts a magnifier on the topic, potentially exacerbating the moves. A yet again empty economic calendar just might do the same for today, especially going into the weekend and considering yesterday’s technical break lower. The US 10-yr yield dropped below the 4% barrier and is now eying support at 3.88%, where the 76.4% retracement on the Sep 2024 – Jan 2025 rally coincides with the temporary lows seen in the aftermath of president Trump’s April 2 tariff announcements. The 2-yr yield already surpassed that mark. The 3.4% is currently the lowest level since September 2022. Money markets for the first time since the September meeting are mulling the possibility of a jumbo cut at one of the two remaining meetings this year. The cumulative amount of easing priced in rose to 55 bps. In the ultra-short yield segment we’re looking very closely at the SOFR fixing. Yesterday’s 4.29% was higher than the Fed’s upper bound of the 4.-4.25% target range. Net TBill supply was one of the reasons said to have stretched liquidity but the mere fact that it did is reason enough to follow up on the matter. German bunds underperformed Treasuries yesterday but they missed out on a second risk-off leg happening after European closing hours. Bund futures marched higher yesterday evening and this morning. Wall Street contained losses to around 0.6% but futures suggest a further decline, including for Europe (-0.9%). We expect the US dollar to remain under pressure, just as it did yesterday. US-related risk-off (for now at least) appears to hurt the greenback more than the euro, allowing EUR/USD to rebound to 1.173 currently after its recent correction lower. French PM Lecornu surviving two votes of no confidence eases some of the most acute risk for new elections but we remain skeptical. The hard part, budget talks, has only just begun. Belgium is facing a similar daunting task. It dodged rating agency Moody’s bullet last week but S&P is lining up (review next Friday). S&P has a AA rating with a negative outlook (since April this year). The Japanese yen outperforms in these risk aversion circumstances, pushing USD/JPY back below 150 for the first time since early October.
News & Views
Bank of Japan governor Ueda kept the door open for a rate hike when the central bank convenes at the end of the month. He said that there’s no change in the central bank’s stance that they will adjust the degree of monetary easing if confidence in hitting the outlook increases. Japanese money markets currently attach only a 15% probability to a 25 bps rate hike. Speeches by BoJ Takata and BoJ Himino are still scheduled on Monday and on Tuesday with national CPI numbers out on Friday. Takata was one of two BoJ-members who already though that a rate hike was justified at the September meeting. BoJ governor Ueda didn’t touch on domestic politics as a potential source of volatility which could impact monetary policy. The Japanese parliament is scheduled to vote on the next PM on Tuesday. The ruling LDP party is still searching for a new coalition partner after its junior partner Komeito ended the collaboration in the aftermath of LDP leadership election. They have been courting the Japan Innovation Party (Ishin). One of Ishin’s co-leaders called it a 50/50 toss-up this morning whether they’d back LDP’s Takaichi or whether they join forces with main opposition parties in supporting the leader of the Democratic Party for the People, Tamaki. USD/JPY dives back below the 150-handle this morning on a combination of USD-weakness and JPY strength in the risk-off market climate.
The UK’s Institute for Fiscal Studies (IFS) released its annual “Green Budget” report ahead of the Autumn Budget. The very extensive report, in collaboration with Barclays, provides and in-depth analysis of the UK’s economic and fiscal outlook. One of the chapters looks at risks and challenges for public finances. The IFS warns for example for a lower productivity forecast by the OBR. A 0.1 ppt drop could increase borrowing by £7bn in 2029-2030. Under Barclays’ central scenario, Chancellor Reeves’ Autumn budget would need £12bn in tightening for a current budget surplus, £17bn is she wants to meet her second fiscal rule related to debt (PSNFL falling as a share of national income) and £22bn to restore her current £10bn fiscal buffer (headroom). The IFS adds that the headroom is extremely small, increasing risks of political instability and economic uncertainty. If she restores the £10bn, they attach a 2/3rd probability of meeting borrowing rules next spring and only a 1/5 probability of meeting them over three years without policy changes.
EUR/USD Daily Outlook
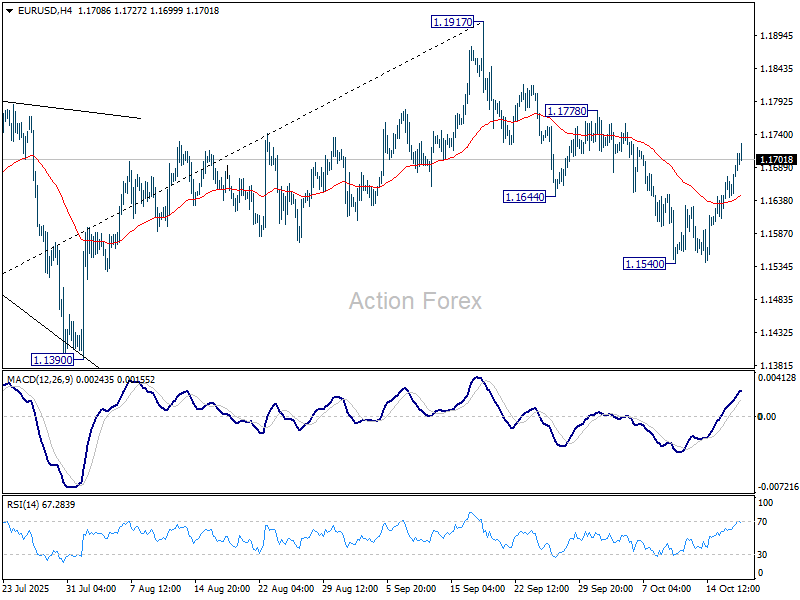
Daily Pivots: (S1) 1.1655; (P) 1.1675; (R1) 1.1706; More…
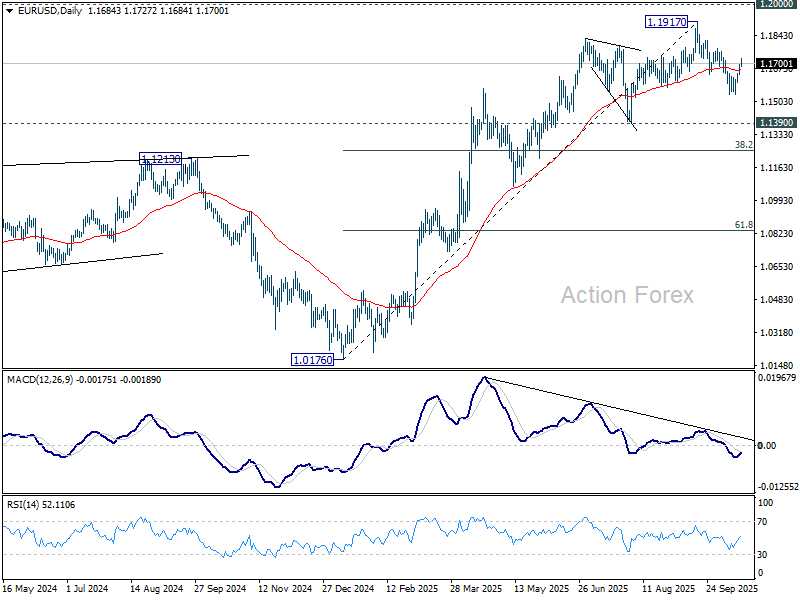
Intraday bias in EUR/USD remains neutral for the moment. Further decline is still expected with 1.1778 resistance intact. On the downside, break of 1.1540 will resume the fall from 1.1917 to 1.1390 , or further to 38.2% retracement of 1.0176 to 1.1917 at 1.1252. However, firm break of 1.1778 will suggest that pullback from 1.1917 has completed, and bring retest of this high.
In the bigger picture, considering bearish divergence condition in D MACD, a medium term top is likely in place at 1.1917, just ahead of 1.2 key psychological level. As long as 55 W EMA (now at 1.1274) holds, the up trend from 0.9534 (2022 low) is still extended to continue. Decisive break of 1.2000 will carry larger bullish implications. However, sustained trading below 55 W EMA will argue that rise from 0.9534 has completed as a three wave corrective bounce, and keep outlook bearish.
USD/JPY Daily Outlook
Daily Pivots: (S1) 149.97; (P) 150.68; (R1) 151.16; More...
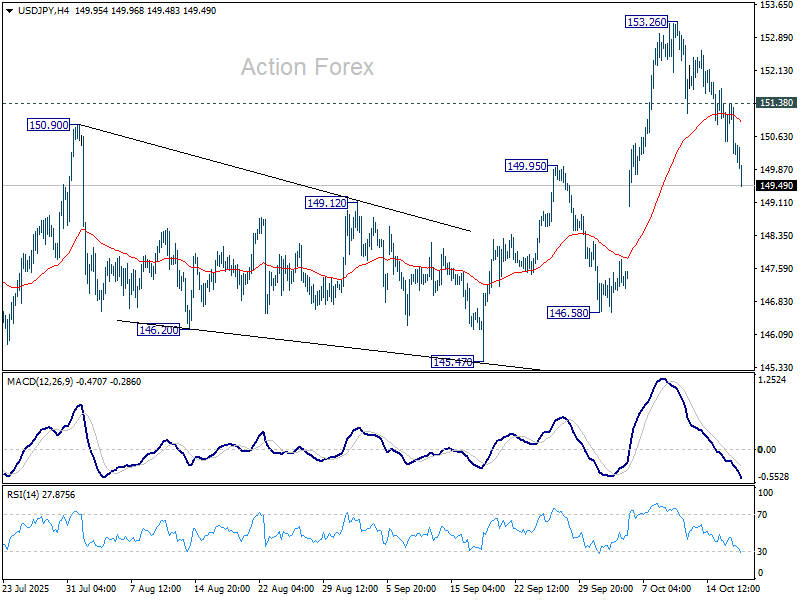
USD/JPY accelerates lower today and the break of 149.95 resistance turned support indicates that a short term top was already formed at 153.26. Intraday bias is now on the downside for 55 D EMA (now at 148.58) instead. Sustained break there will raise the chance of bearish reversal and target 145.47 structural support next. On the upside, above 151.38 minor resistance will turn intraday bias neutral again first.
In the bigger picture, current development suggests that corrective pattern from 161.94 (2024 high) has completed with three waves at 139.87. Larger up trend from 102.58 (2021 low) could be ready to resume through 161.94 high. On the downside, break of 145.47 support will dampen this bullish view and extend the corrective pattern with another falling leg.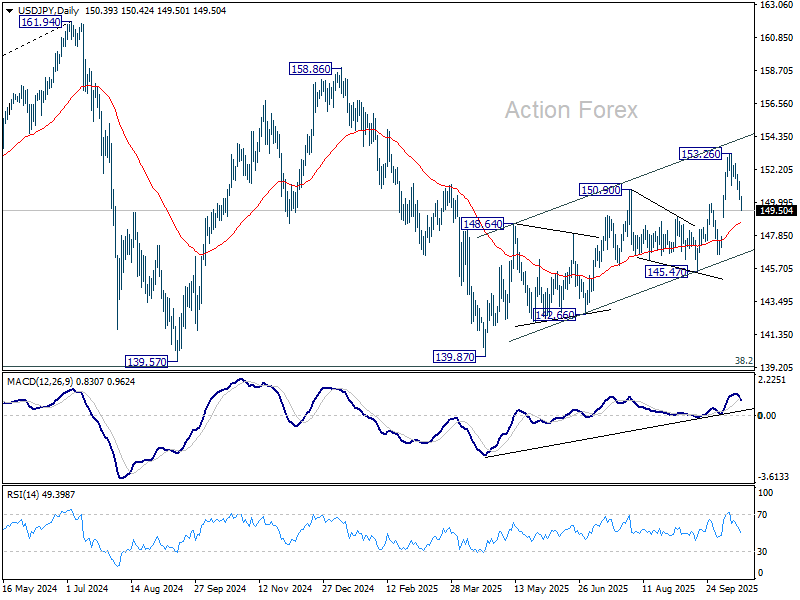
GBP/USD Daily Outlook
Daily Pivots: (S1) 1.3399; (P) 1.3427; (R1) 1.3462; More...
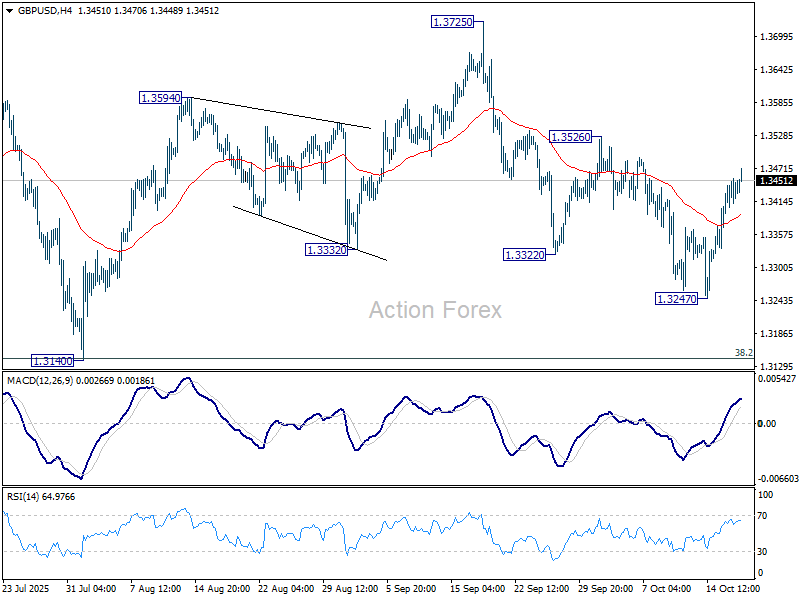
Intraday bias in GBP/USD stays neutral and outlook is unchanged. Fall from 1.3725 could still extend lower through 13247. But even in that case, strong support is expected from 1.3140 cluster (38.2% retracement of 1.2099 to 1.3787 at 1.3142) to complete the corrective pattern from 1.3787. On the upside, break of 1.3526 will bring stronger rally back to 1.3725/87 resistance zone.
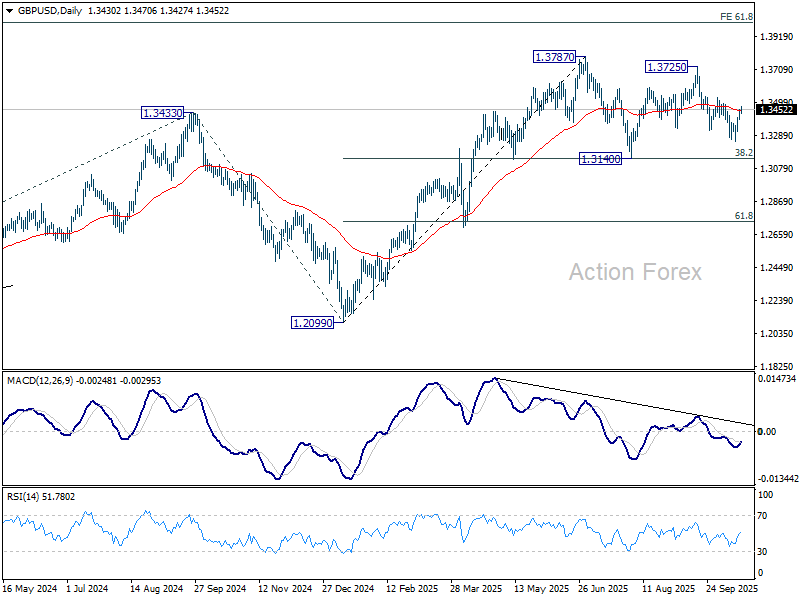
In the bigger picture, rise from 1.0351 (2022 low) is still seen as a corrective move. Further rally could be seen to 61.8% projection of 1.0351 to 1.3433 (2024 high) from 1.2099 (2025 low) at 1.4004. But strong resistance could emerge from 1.4248 (2021 high) to limit upside. Sustained break of 55 W EMA (now at 1.3173) will argue that a medium term top has already formed and bring deeper fall back to 1.2099.
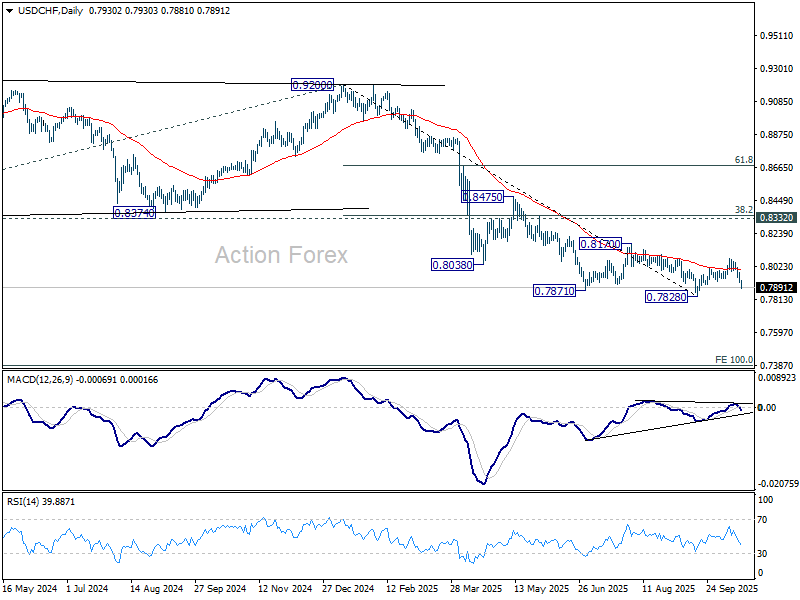
USD/CHF Daily Outlook
Daily Pivots: (S1) 0.7907; (P) 0.7946; (R1) 0.7968; More…
USD/CHF's fall from 0.8075 accelerates lower today and intraday bias stays on the downside for retesting 0.7828 low. Decisive break there will resume larger down trend. For now, risk will stay on the downside as long as 0.7984 minor resistance holds, in case of recovery.
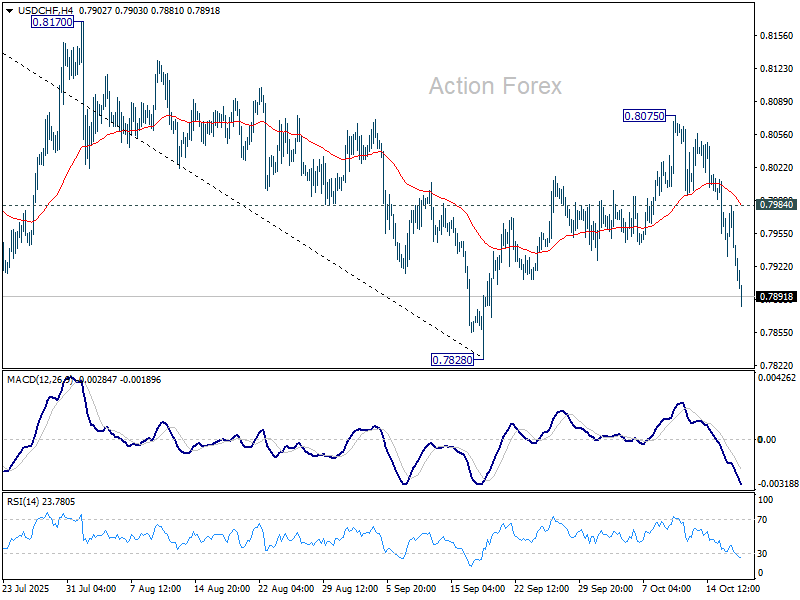
In the bigger picture, long term down trend from 1.0342 (2017 high) is still in progress. Next target is 100% projection of 1.0146 (2022 high) to 0.8332 from 0.9200 at 0.7382. In any case, outlook will stay bearish as long as 0.8332 support turned resistance holds (2023 low).
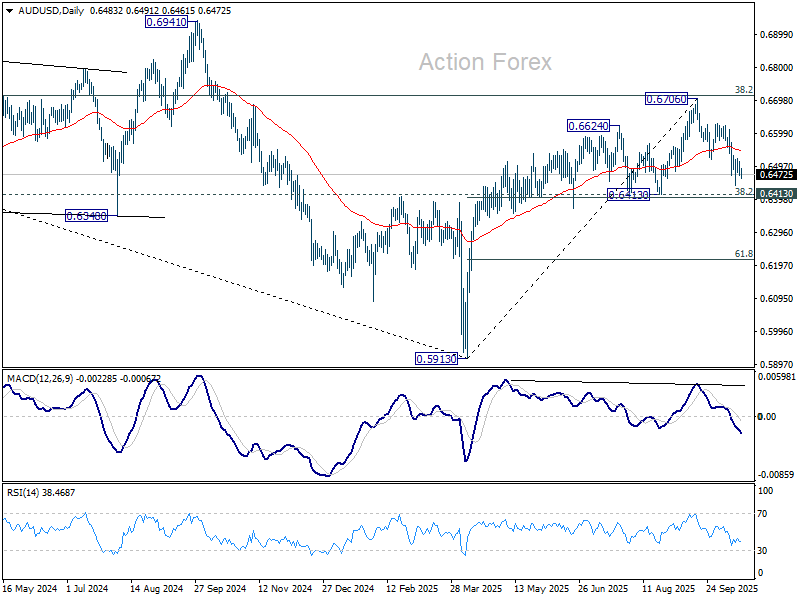
AUD/USD Daily Report
Daily Pivots: (S1) 0.6465; (P) 0.6491; (R1) 0.6510; More...
Intraday bias in AUD/USD remains neutral for the moment. On the downside, break of 0.6439 will target 0.6413 cluster support (38.2% retracement of 0.5913 to 0.6706 at 0.6403). Sustained break there will pave the way to 61.8% retracement at 0.6216. Nevertheless, break of 0.6628 resistance will retain near term bullishness, and bring retest of 0.6706 high.
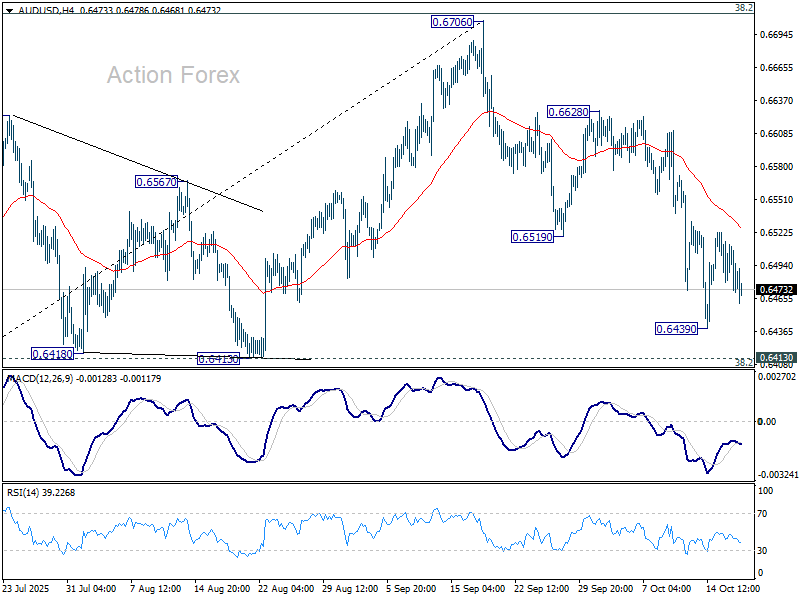
In the bigger picture, there is no clear sign that down trend from 0.8006 (2021 high) has completed. Rebound from 0.5913 is seen as a corrective move. Outlook will remain bearish as long as 38.2% retracement of 0.8006 to 0.5913 at 0.6713 holds. Nevertheless, considering bullish convergence condition in W MACD, sustained break of 0.6713 will be a strong sign of bullish trend reversal, and pave the way to 0.6941 structural resistance for confirmation.
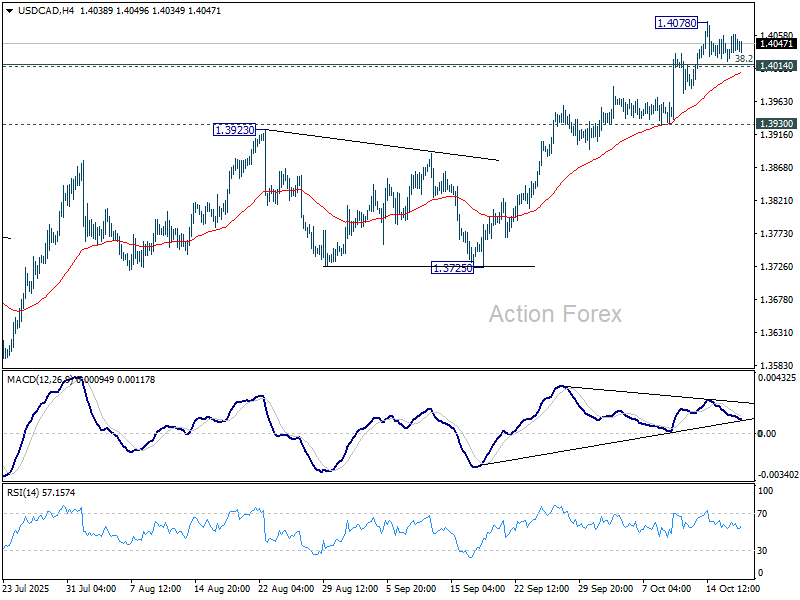
USD/CAD Daily Outlook
Daily Pivots: (S1) 1.4032; (P) 1.4046; (R1) 1.4070; More...
Intraday bias in USD/CAD remains neutral and more consolidations could be seen below 1.4078. Further rally is expected as long as 1.3930 support holds. Sustained trading above 1.4014/7 will suggest that USD/CAD is already reversing the whole fall from 1.4719, and target 61.8% retracement at 1.4312. However, break of 1.3930 support will indicate short term topping, and turn bias back to the downside for 1.3725 instead.
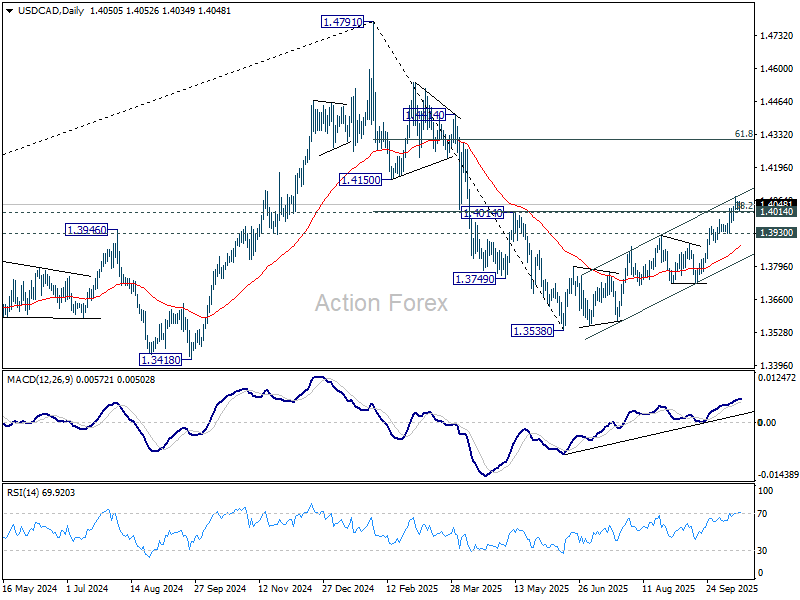
In the bigger picture, price actions from 1.4791 medium term top could either be a correction to rise from 1.2005 (2021 low), or trend reversal. In either case, further decline is expected as long as 1.4014 cluster resistance (38.2% retracement of 1.4791 to 1.3538 at 1.4017) holds. However sustained trading above 1.4014 will suggest that it's more likely just a correction, and the larger up trend would be in favor to resume through 1.4791 at a later stage.
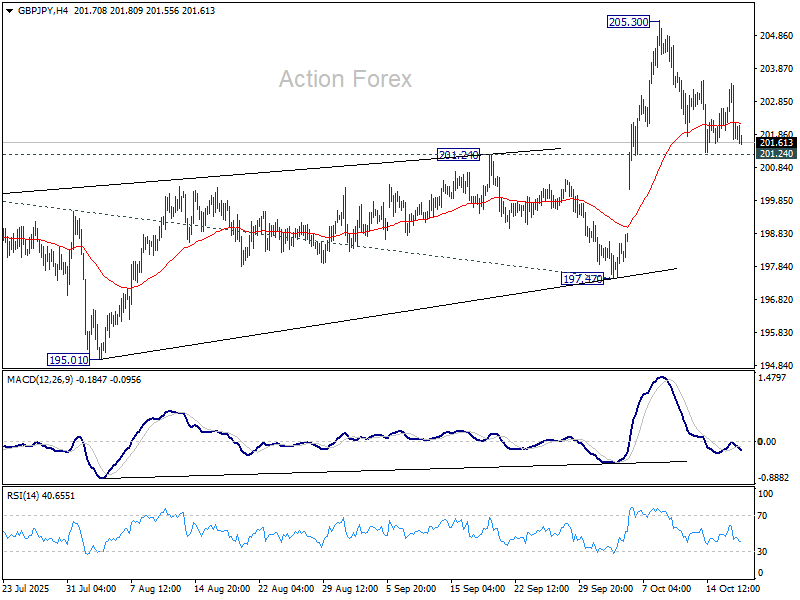
GBP/JPY Daily Outlook
Daily Pivots: (S1) 201.42; (P) 202.43; (R1) 203.14; More...
GBP/JPY is still bounded in range of 201.24/205.30 and intraday bias stays neutral. With 201.24 resistance turned support intact, further rally is still in favor. Break of 205.30 will target 61.8% projection of 184.35 to 199.96 from 197.47 at 207.11. However, firm break of 201.24 will confirm short term topping and bring deeper fall back to 197.47 support instead.
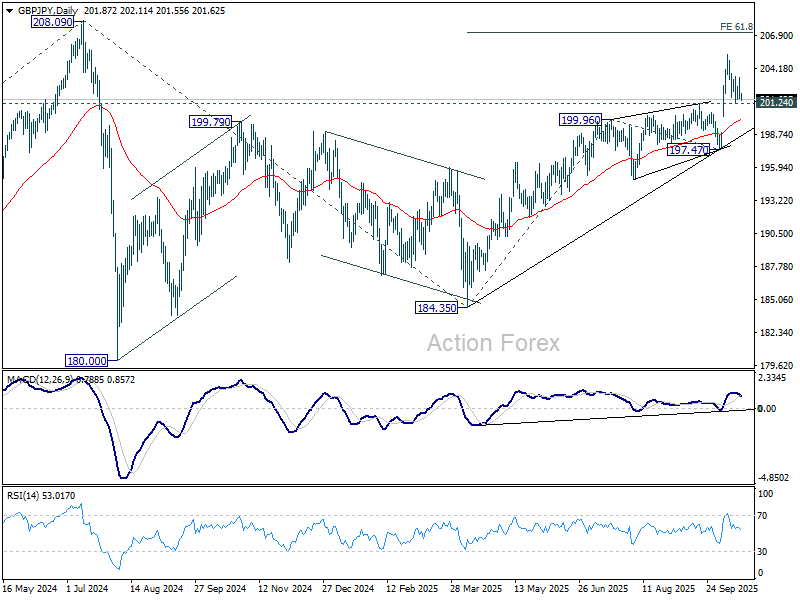
In the bigger picture, price actions from 208.09 (2024 high) are seen as a corrective pattern which might have completed at 184.35. Firm break of 208.09 high will resume the up trend from 123.94 (2020 low). Next target is 61.8% projection of 148.93 to 208.09 from 184.35 at 220.90. However, firm break of 197.47 will dampen this view and could extend the corrective pattern with another fall.
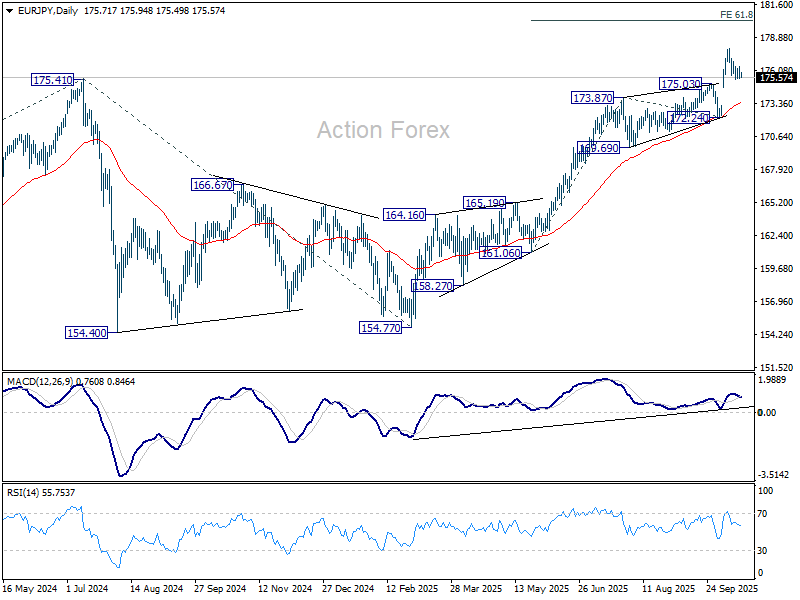
EUR/JPY Daily Outlook
Daily Pivots: (S1) 175.36; (P) 175.91; (R1) 176.37; More...
EUR/JPY is still bounded in range of 175.03/177.91 and intraday bias stays neutral. Further rise is expected as long as 175.03 resistance turned support holds. On the upside, break of 177.91 will target 61.8% projection of 161.06 to 173.87 from 172.24 at 180.15 next. However, firm break of 175.03 will confirm short term topping and bring deeper fall back to 172.24 support.
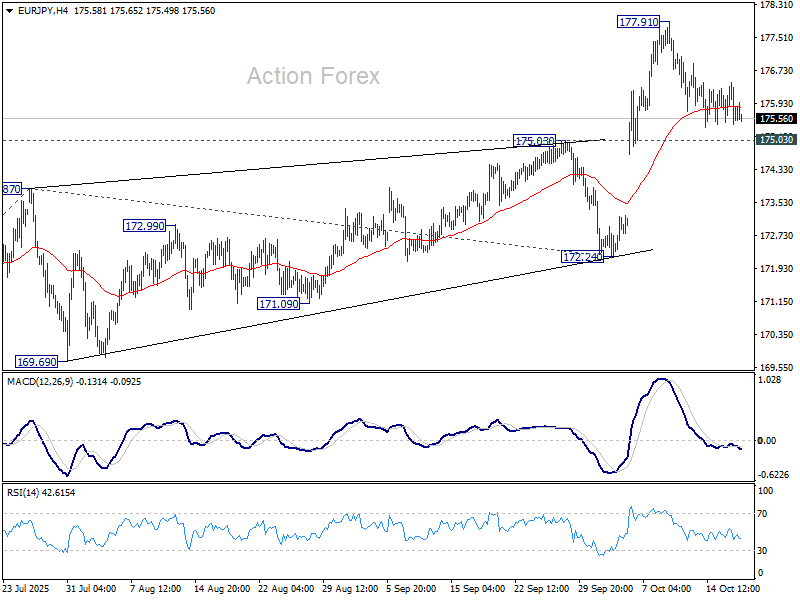
In the bigger picture, up trend from 114.42 (2020 low) is in progress and should target 61.8% projection of 124.37 to 175.41 from 154.77 at 186.31. Firm break of 172.24 support will suggests that it has turned into consolidations again. But still, outlook will continue to stay bullish as long as 55 W EMA (now at 167.16) holds, even in case of deep pullback.