
Sample Category Title
USD/CHF Mid-Day Outlook
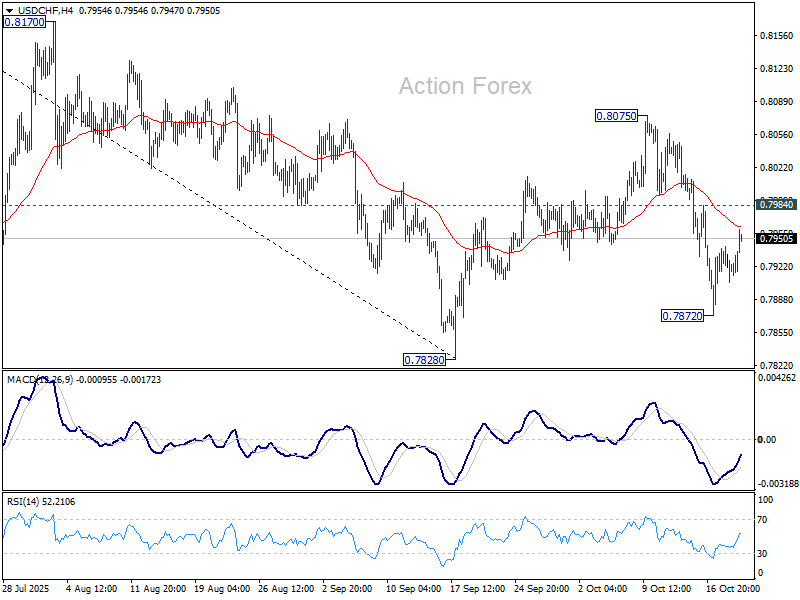
Daily Pivots: (S1) 0.7907; (P) 0.7925; (R1) 0.7945; More…
USD/CHF's recovery from 0.7872 extends higher today, but stays below 0.7984 minor resistance. Intraday bias remains neutral and further decline is in favor. On the downside, below 0.7872 will bring retest of 0.7828. Firm break there will resume larger down trend. However, break of 0.7984 will suggest that corrective pattern from 0.7828 is extending with another rising leg, and target 0.8075 again.
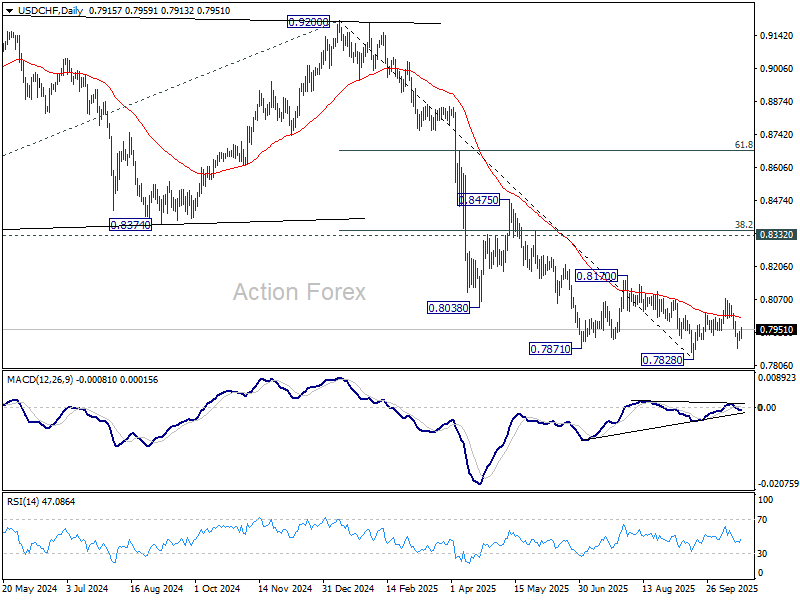
In the bigger picture, long term down trend from 1.0342 (2017 high) is still in progress. Next target is 100% projection of 1.0146 (2022 high) to 0.8332 from 0.9200 at 0.7382. In any case, outlook will stay bearish as long as 0.8332 support turned resistance holds (2023 low).
GBP/USD Mid-Day Outlook
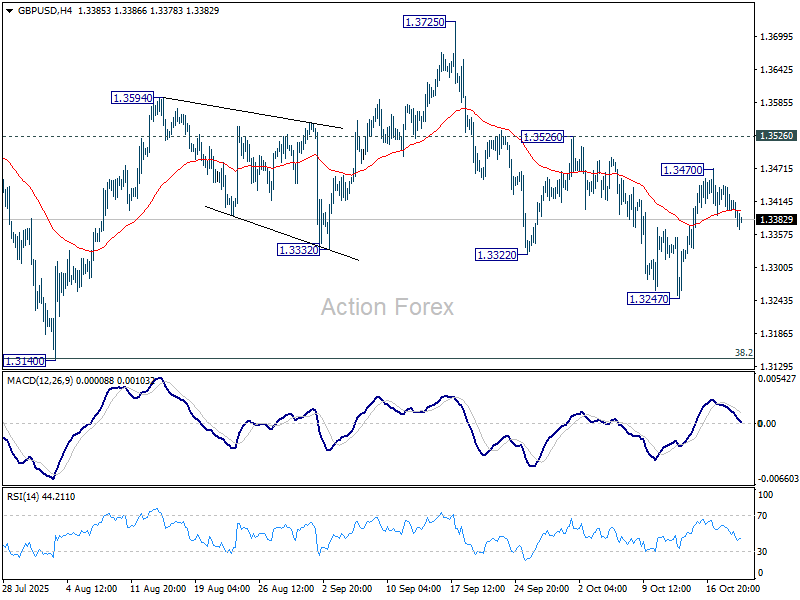
Daily Pivots: (S1) 1.3389; (P) 1.3416; (R1) 1.3432; More...
Intraday bias in GBP/USD remains neutral. Another fall is mildly in favor as long as 1.3526 resistance holds. Break of 1.3247 will target 1.3140 cluster (38.2% retracement of 1.2099 to 1.3787 at 1.3142). Strong support is expected there to contain downside to complete the corrective pattern from 1.3787. On the upside, break of 1.3526 will target 1.3725/87 resistance zone.
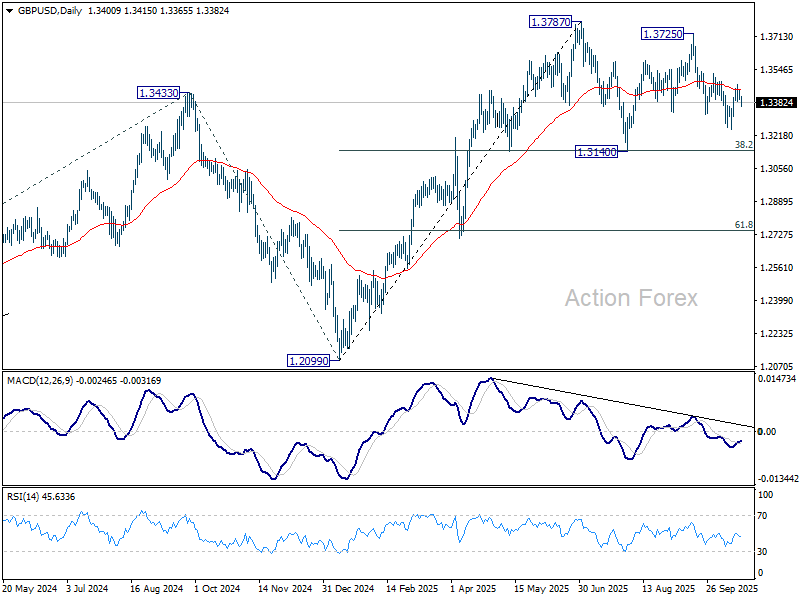
In the bigger picture, rise from 1.0351 (2022 low) is still seen as a corrective move. Further rally could be seen to 61.8% projection of 1.0351 to 1.3433 (2024 high) from 1.2099 (2025 low) at 1.4004. But strong resistance could emerge from 1.4248 (2021 high) to limit upside. Sustained break of 55 W EMA (now at 1.3191) will argue that a medium term top has already formed and bring deeper fall back to 1.2099.
EUR/USD Mid-Day Outlook
Daily Pivots: (S1) 1.1629; (P) 1.1652; (R1) 1.1666; More…
Intraday bias in EUR/USD remains neutral and fall from 1.1917 is expected to resume sooner or later. Break of 1.1540 will target 1.1390 support, or even further to 38.2% retracement of 1.0176 to 1.1917 at 1.1252. On the upside, through, break of 1.1778 will target retest of 1.1917 high instead.
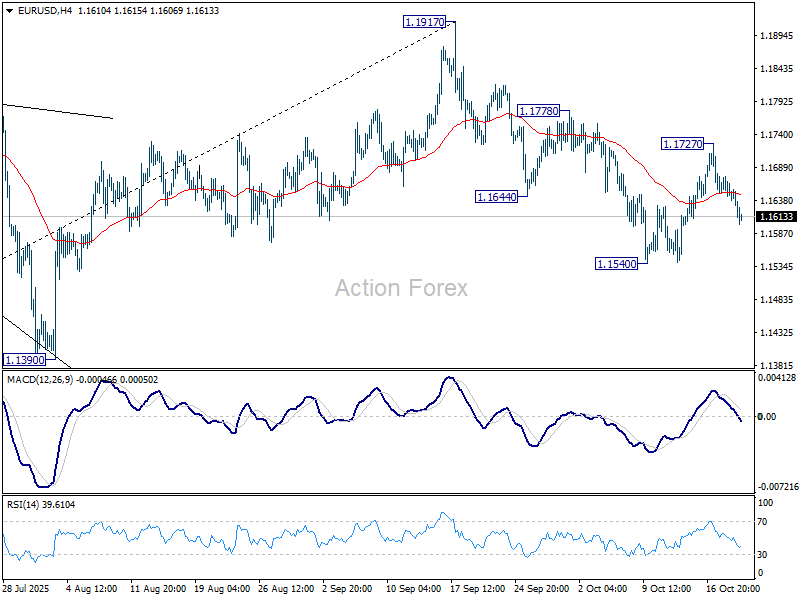
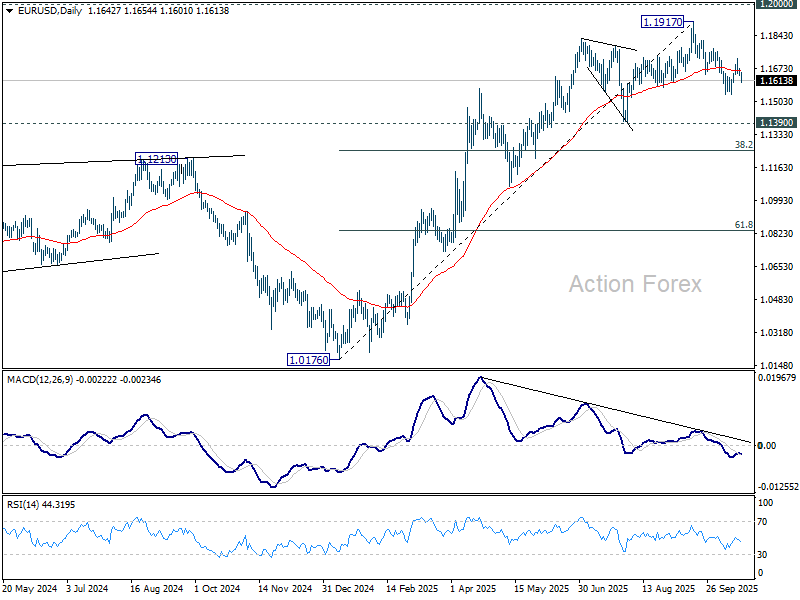
In the bigger picture, considering bearish divergence condition in D MACD, a medium term top is likely in place at 1.1917, just ahead of 1.2 key psychological level. As long as 55 W EMA (now at 1.1290) holds, the up trend from 0.9534 (2022 low) is still expected to continue. Decisive break of 1.2000 will carry larger bullish implications. However, sustained trading below 55 W EMA will argue that rise from 0.9534 has completed as a three wave corrective bounce, and keep outlook bearish.
USD/CAD Mid-Day Outlook
Daily Pivots: (S1) 1.4014; (P) 1.4032; (R1) 1.4059; More...
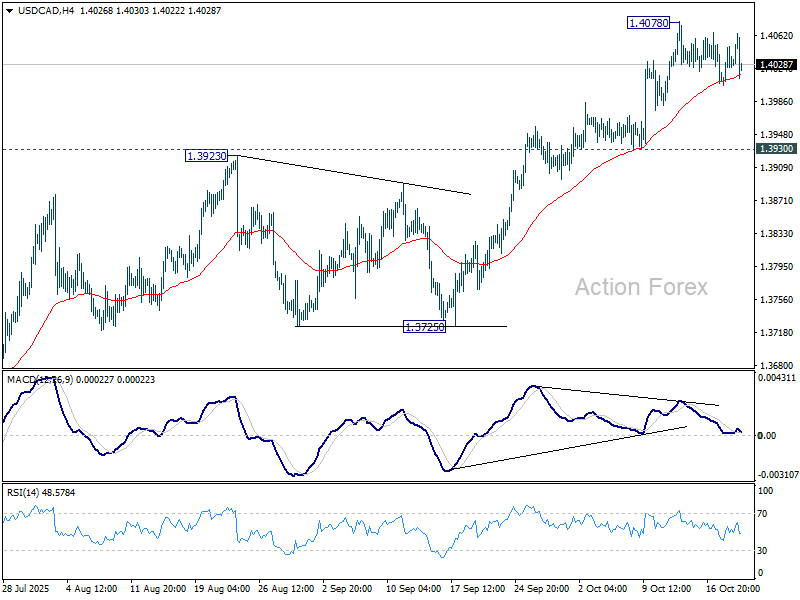
USD/CAD dips mildly in early US session, but stays well above 1.3930. Intraday bias remains neutral for more consolidations below 1.4078. But further rally is still expected as long as 1.3930 support holds. Current development suggest that rise from 1.3538 is reversing whole fall from 1.4791. Above 1.4078 will target 61.8% retracement of 1.4791 to 1.3538 at 1.4312.
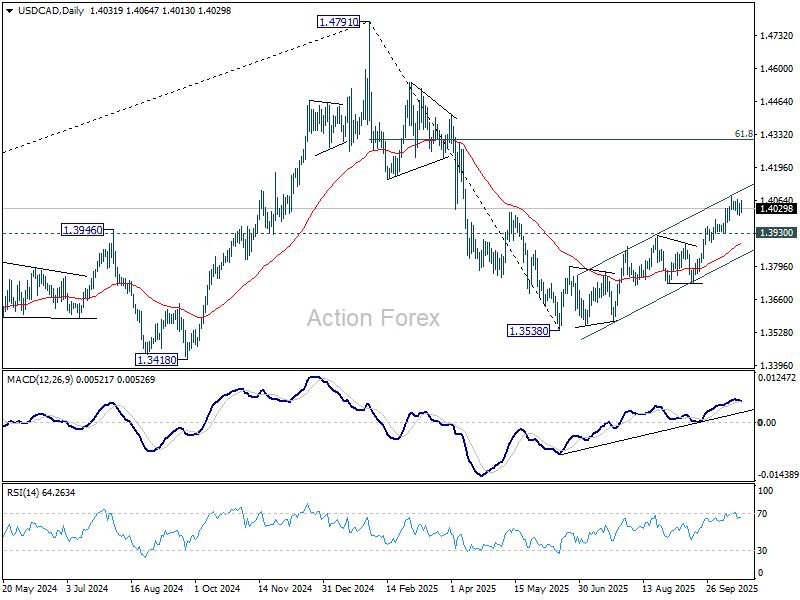
In the bigger picture, price actions from 1.4791 medium term top is likely just unfolding as a correction to up trend from 1.2005 (2021 low). Based on current momentum, rise from 1.3538 is the second leg, and a third leg should follow before up trend resumption. That is, range trading is set to extend for the medium term. For now, this will remain the favored case as long as 1.3725 support holds.
Stronger Canada CPI Narrows Odds of Back-to-Back BoC Easing
Canadian Dollar climbed across the board as markets enter into U.S. session, leading major currencies higher after domestic inflation data came in hotter than expected. Combined with this month’s firm employment figures, the data have made the case for a rate cut at the October 29 meeting a close call.
While the BoC maintain an easing bias and markets still expect more cuts ahead, the latest figures may prompt the BoC to pause this month and reserve ammunition for December, especially with signs that the domestic economy remains more resilient than feared.
Meanwhile, Yen stayed under sustained selling pressure. In a landmark parliamentary vote, Sanae Takaichi, leader of the ruling Liberal Democratic Party, was formally elected as Japan’s first female prime minister. The LDP’s new coalition partner, the Japan Innovation Party, helped deliver a comfortable win as opposition parties failed to field a unified challenger.
Takaichi swiftly unveiled her new Cabinet, naming Ryosei Akazawa, Japan’s chief tariff negotiator with the U.S., as trade minister to maintain momentum in bilateral talks. The new administration faces an immediate diplomatic challenge — the upcoming visit by U.S. President Donald Trump, which will test Japan’s approach to the ongoing tariff discussions and its broader defense cooperation with Washington.
Trade tensions between the U.S. and China remain another focal point. Chinese customs data showed rare earth magnet exports to the U.S. fell -28.7% mom in September to 420.5 tonnes — nearly 30% below last year’s levels. Reports suggest China tightened licensing procedures for rare earth exports in September, ahead of a broader regulatory expansion implemented in October. The move underscores Beijing’s intention to use resource controls as leverage in trade disputes, while Washington continues to forge strategic mineral alliances with partners such as Australia.
In currency markets, Loonie stands out as the day’s top performer, followed by Dollar and Sterling. Yen remains the weakest, trailed by the Swiss franc and Kiwi. Aussie and Euro trade in the middle of the pack.
In Europe, at the time of writing, FTSE is up 0.31%. DAX is up 0.17%. CAC is up 0.44%. UK 10-year yield is down -0.022 at 4.492. Germany 10-year yield is down -0.007 at 2.573. Earlier in Asia, Nikkei rose 0.27%. Hong Kong HSI rose 0.65%. China Shanghai SSE rose 1.36%. Singapore Strait Times rose 1.20%. Japan 10-year JGB yield fell -0.006 to 1.663.
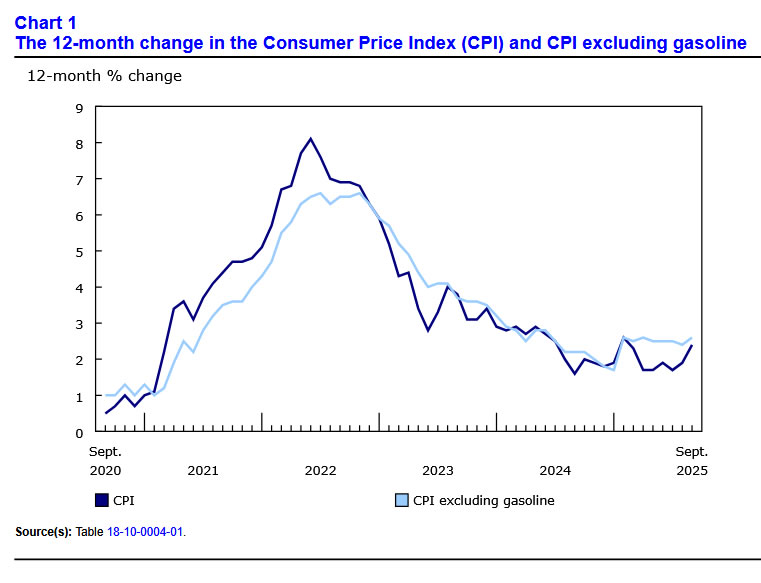
Canada CPI surges to 2.4% in September, core measures accelerate too
Canada’s consumer prices accelerated more than expected in September. Headline CPI rose 2.4% yoy, up sharply from 1.9% in August and above consensus of 2.3%. The rebound was largely driven by a smaller year-ago decline in gasoline prices — down -4.1% compared with -12.7% in August — which created a notable base effect in the annual calculation.
Even so, underlying inflation momentum also firmed. Excluding gasoline, CPI rose 2.6% yoy, up from 2.4% in the previous month, signaling broader price pressures beyond energy. All three core inflation measures came in hotter than anticipated. CPI median held steady at 3.2%, beating expectations of 3.0%. CPI trimmed ticked up from 3.0% to 3.1%. CPI common accelerated from 2.5% yoy to 2.7%.
New Zealand trade deficit widens NZD -14B despite strong 19% export growth
New Zealand recorded another sizeable trade deficit in September 2025, as import growth outstripped exports despite solid overseas demand. Statistics NZ data showed goods exports rose 19% yoy to NZD 5.8B. Imports increased 1.6% yoy to NZD 7.2B. The result was a monthly deficit of NZD -1.4B, versus expectation of NZD -6B and prior month's NZD -1.2B.
Export strength was broad-based, led by double-digit gains to all major partners. Shipments to China jumped 24% yoy, Australia 28%, and Japan 23%, while sales to the U.S. and EU rose 10% and 15%, respectively.
On the import side, purchases from China climbed 16% yoy, while inflows from the EU and Australia rose 7.3% and 6.4%. Offsetting that, imports from the U.S. slumped -30%, and South Korea fell -4.8%.
USD/CAD Mid-Day Outlook
Daily Pivots: (S1) 1.4014; (P) 1.4032; (R1) 1.4059; More...
USD/CAD dips mildly in early US session, but stays well above 1.3930. Intraday bias remains neutral for more consolidations below 1.4078. But further rally is still expected as long as 1.3930 support holds. Current development suggest that rise from 1.3538 is reversing whole fall from 1.4791. Above 1.4078 will target 61.8% retracement of 1.4791 to 1.3538 at 1.4312.
In the bigger picture, price actions from 1.4791 medium term top is likely just unfolding as a correction to up trend from 1.2005 (2021 low). Based on current momentum, rise from 1.3538 is the second leg, and a third leg should follow before up trend resumption. That is, range trading is set to extend for the medium term. For now, this will remain the favored case as long as 1.3725 support holds.
Canada CPI surges to 2.4% in September, core measures accelerate too
Canada’s consumer prices accelerated more than expected in September. Headline CPI rose 2.4% yoy, up sharply from 1.9% in August and above consensus of 2.3%. The rebound was largely driven by a smaller year-ago decline in gasoline prices — down -4.1% compared with -12.7% in August — which created a notable base effect in the annual calculation.
Even so, underlying inflation momentum also firmed. Excluding gasoline, CPI rose 2.6% yoy, up from 2.4% in the previous month, signaling broader price pressures beyond energy. All three core inflation measures came in hotter than anticipated. CPI median held steady at 3.2%, beating expectations of 3.0%. CPI trimmed ticked up from 3.0% to 3.1%. CPI common accelerated from 2.5% yoy to 2.7%.
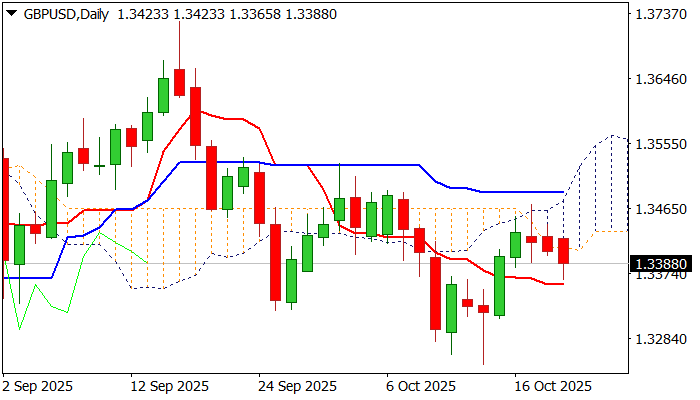
GBPUSD – Biased Lower While Below Thickening Daily Cloud
Cable remains in red for the third straight day with fresh weakness on Tuesday, pointing to negative signals developing on daily chart.
Friday’s false break above daily cloud, left Doji candle with longer upper shadow and subsequent drop returned below cloud base, adding to negative signals.
Fresh bears need repeated close below the cloud base as minimum requirement, with thickening cloud providing pressure.
Violation of daily Tenkan-sen (1.3360) to confirm and expose last week’s spike low at 1.3248.
Negative momentum studies on daily chart contribute to scenario.
Cloud base (1.3406) marks solid resistance, although return and close within the cloud would sideline downside prospects.
Dily Kijun-sen reinforces cloud top (1.3487) which marks upper trigger, break of which would bring bulls in play.
Res: 1.3406; 1.3471; 1.3487; 1.3527
Sup: 1.3360; 1.3323; 1.3311; 1.3261
EUR/USD Under Downward Pressure
The euro is facing sustained selling pressure, primarily driven by a robust US dollar. The greenback is being bolstered by rising Treasury yields and fading market expectations for an early start to the Federal Reserve’s easing cycle.
Further weighing on the single currency are disappointing macroeconomic releases from Germany, coupled with ongoing uncertainty over US–EU trade disputes, which have been reignited by new initiatives from the Trump administration.
Additionally, investors are beginning to price in fiscal risks within the eurozone, fuelled by budgetary disagreements involving Italy and France. Collectively, these factors create an unfavourable backdrop for the euro in the near term.
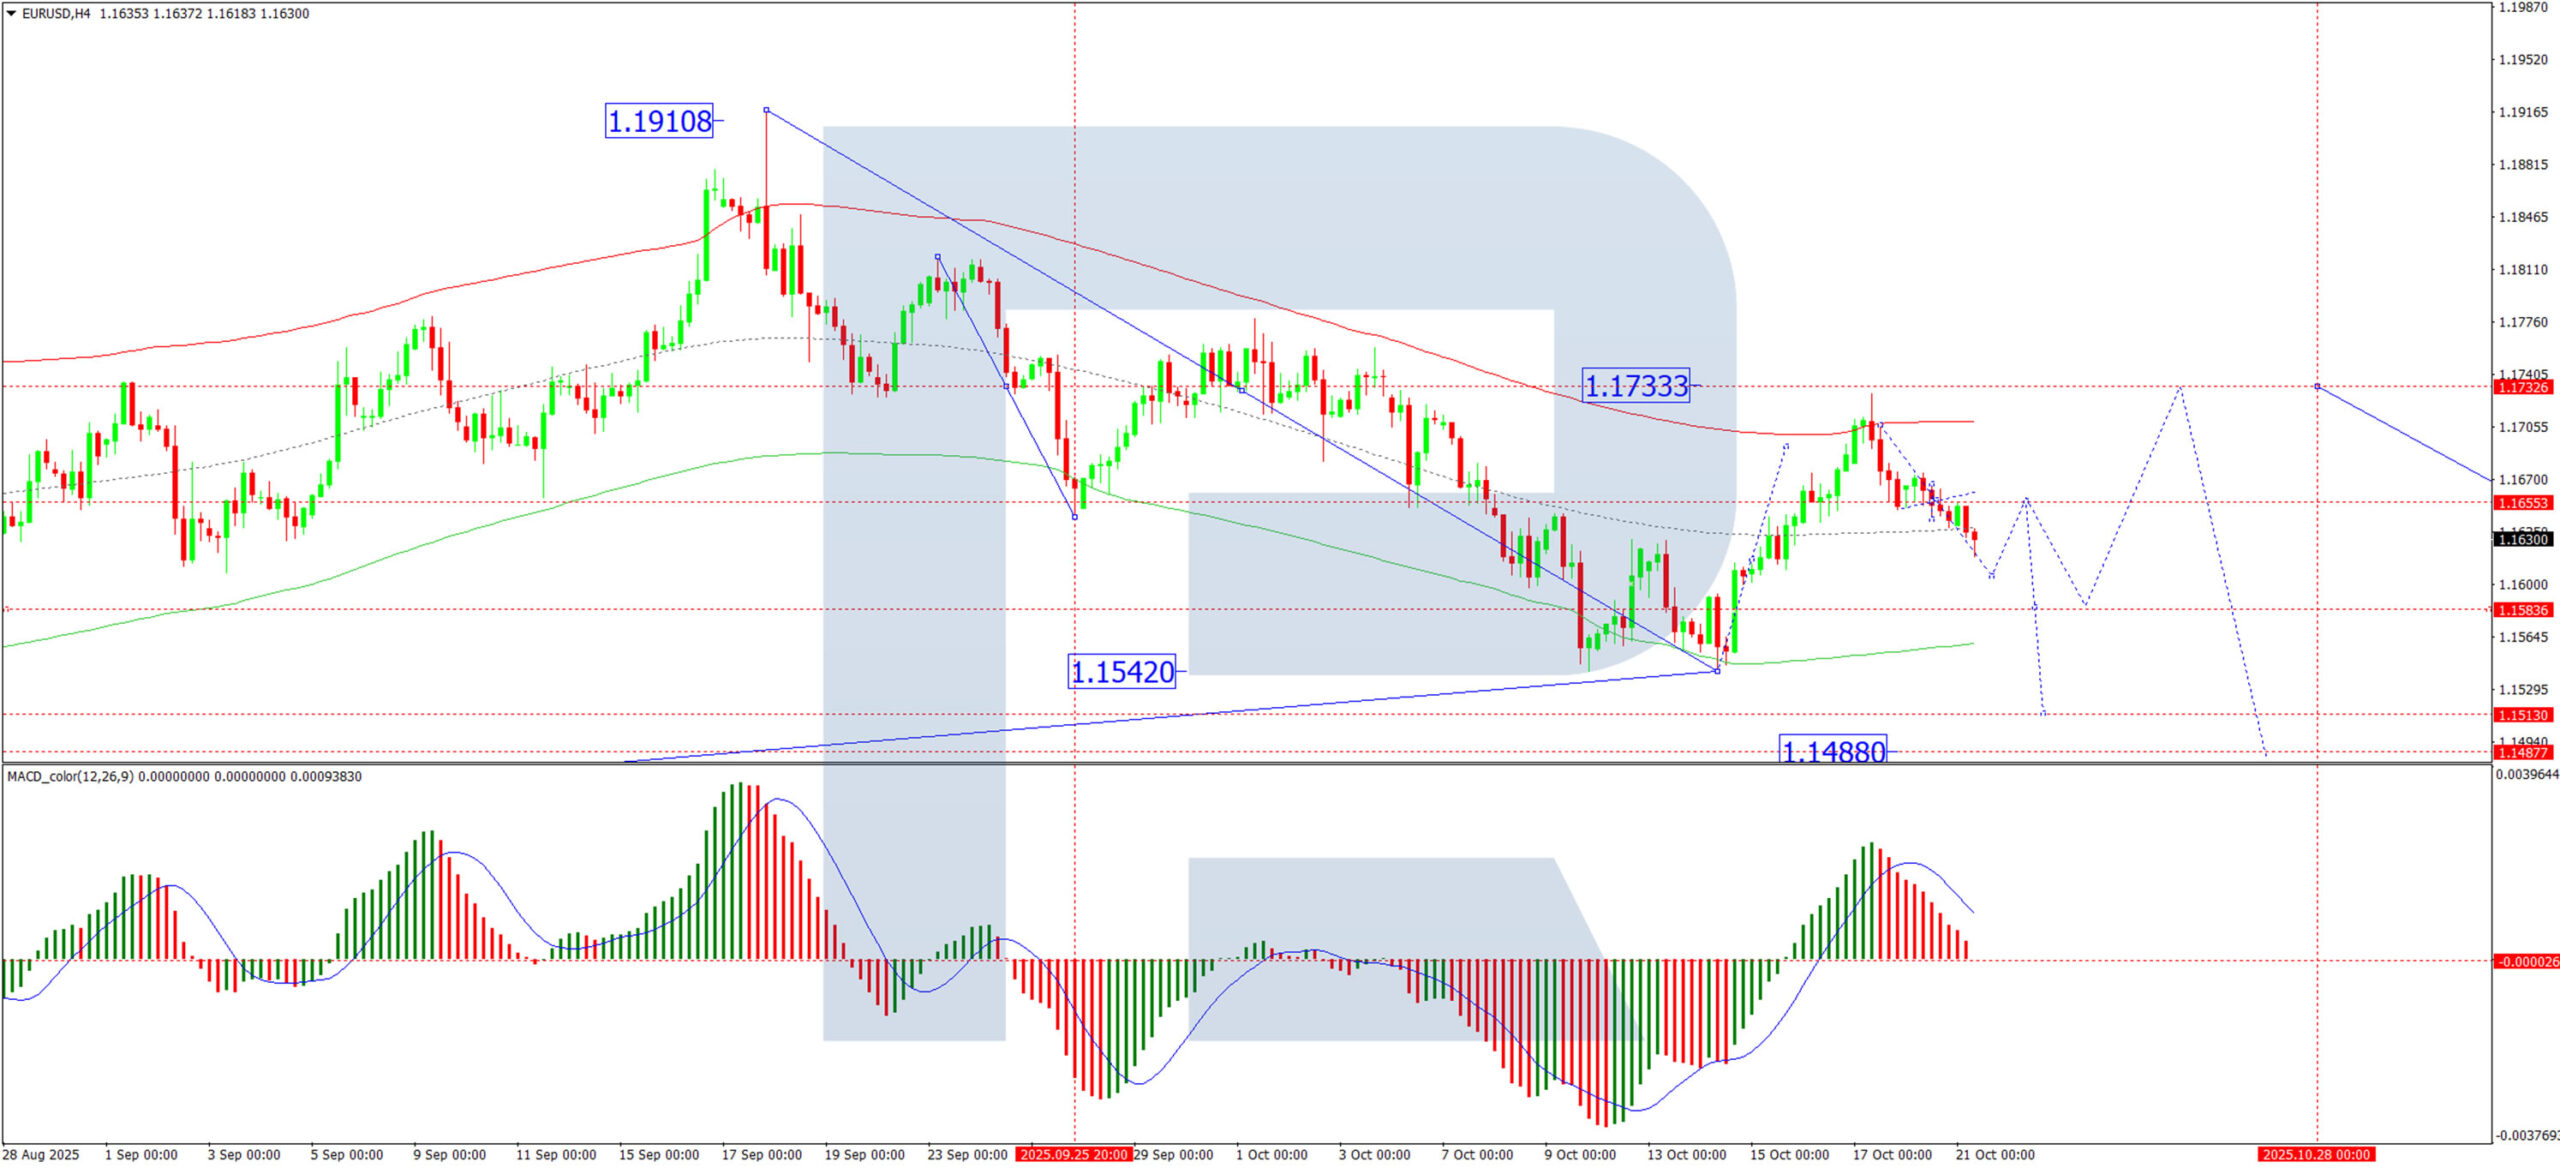
Technical Analysis: EUR/USD
H4 Chart:
On the H4 chart, EUR/USD has been forming a broad consolidation range around the 1.1656 level. The pair is currently trading below this pivot, with initial bearish targets at 1.1606 and 1.1568. A retest of the range’s upper boundary towards 1.1733 remains a possibility. However, a decisive break below the current consolidation would open the potential for a deeper decline towards 1.1488, with a subsequent extension to 1.1400. This bearish technical picture is confirmed by the MACD indicator, whose signal line, while above zero, is pointing decisively downwards, indicating that bearish momentum is prevailing.
H1 Chart:
The H1 chart shows the pair breaking downwards from a tight consolidation around 1.1655. This move signals the likely completion of a corrective phase and the start of a fresh leg lower. The initial downside target is at least 1.1584. This view is supported by the Stochastic oscillator, whose signal line is below 50 and is holding near the 20 level, reflecting strong near-term bearish momentum.
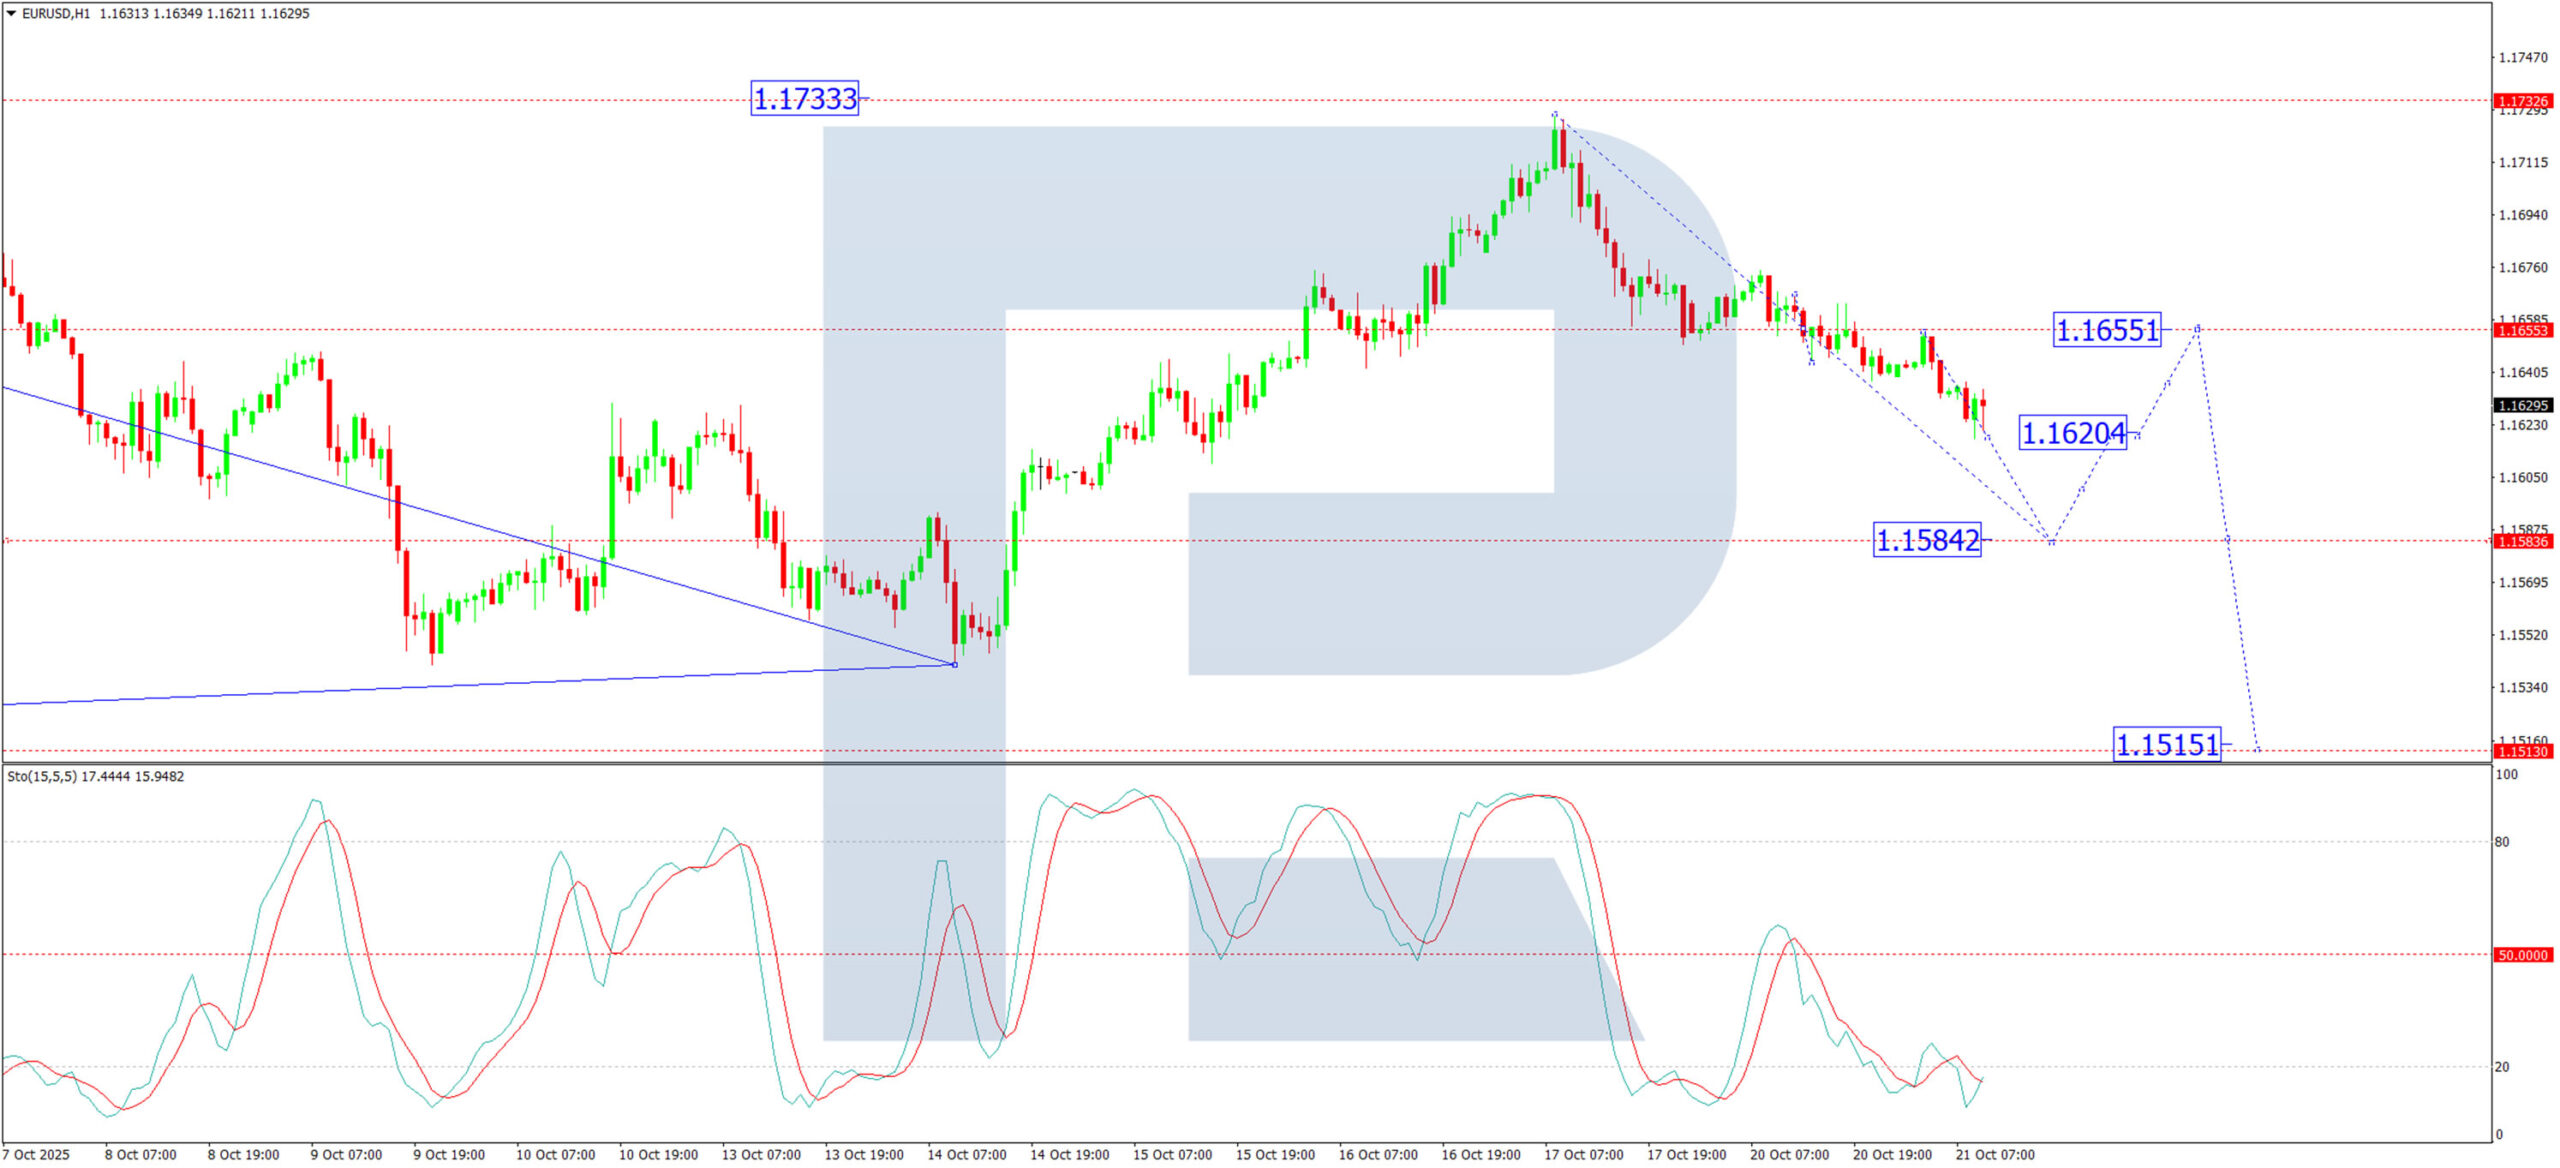
Conclusion
The fundamental and technical outlook for EUR/USD both point to further downside. While a technical correction is always possible, the path of least resistance appears lower, with key support levels at 1.1584 and 1.1488 in focus.
Natural Gas: How Sellers Booked Profits Amid Imminent Resurgence
Hello traders. Welcome to another blog post where we discuss trade setups shared with Elliottwave_Forecast members. In this one, the spotlight will be on Natural Gas.
On the weekly chart, Natural Gas completed the third wave of a long-term bearish cycle in March 2024, forming an impulse wave that started in August 2022. As a result, from the March 2024 low, a new long-term bullish cycle began. This cycle could last for several years and may push prices well above the $10 mark. However, while an impulse sequence is expected from March 2024, traders and investors should anticipate at least a three-wave bounce. The first sub-wave — an impulse structure — started at the March 2024 low and completed at the 2025 peak.
According to Elliott Wave Theory, a three-wave correction usually follows a five-wave advance. That’s exactly what is happening now. The pullback from the March 2025 top appears corrective and should end above the March 2024 low. Therefore, our focus over the past few months has been on this corrective cycle from March 2025.
From our weekly and daily chart updates, we identified a double zigzag corrective pattern unfolding from the March 2025 high. Wave (W) ended in April 2025, and wave (X) ended in June 2025. Thus, we expect wave (Y) to extend toward 2.10–1.619 to complete the entire bearish cycle.
Wave A of (Y) ended with a five-wave structure below the April 2025 low (wave (W) low). Then, a corrective bounce followed. When that bounce began, we explained in the live trading room why we preferred to sell at the extreme for wave B of (Y). Once the bounce matured, we shared the H4 chart update on October 6, 2025.
Natural Gas Trade Setup – 10-06-2025
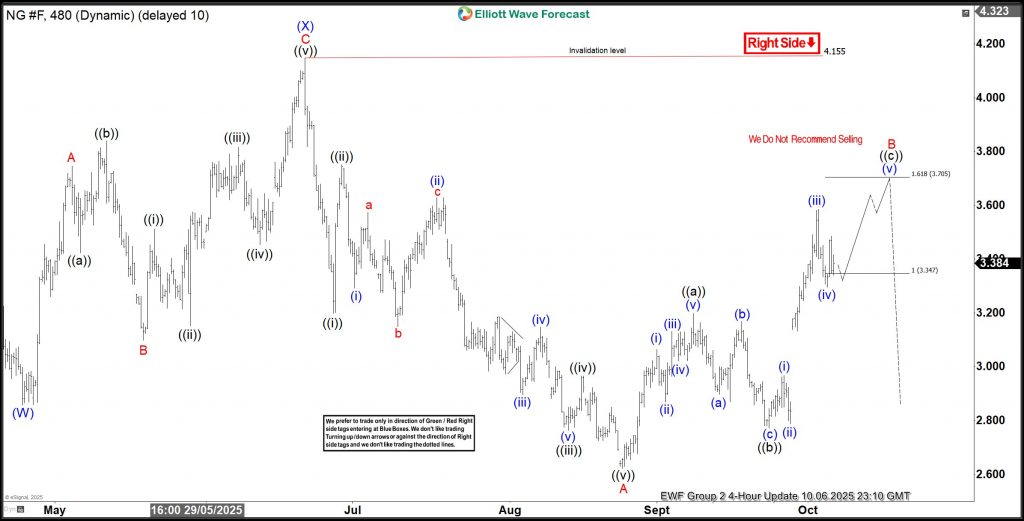
On 6th October, 2025, we shared the chart above. Wave B emerged higher as a simple 3-wave zigzag structure. We identify the extreme zone at 3.347-3.705 to members. In the live trading room and daily technical videos, we recommended to members to go short for a short term counter-trend trade (remember, NG is in a corrective phase).
Natural Gas Trade Setup – 10-16-2025
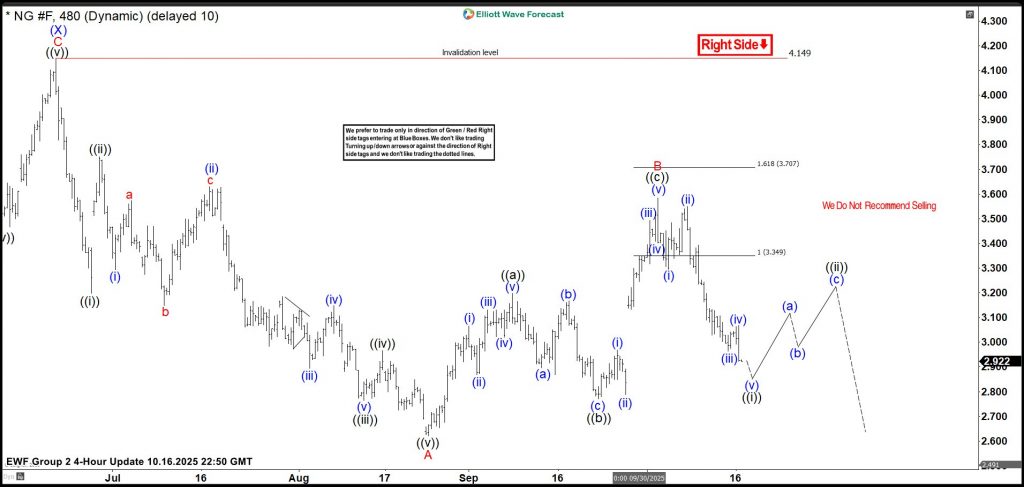
On October 16, 2025, we shared the chart above with members, showing a bearish reaction from the marked extreme zone. At that point, a five-wave decline was developing and nearing completion. Members in the live trading room had already taken partial profits at the first target and moved the rest of the position to breakeven. This step ensures a risk-free trade in case a strong bounce follows, as corrective markets can sometimes appear complete before extending further.
Bitcoin: Bull Market May Be in Final Stages
Market Overview
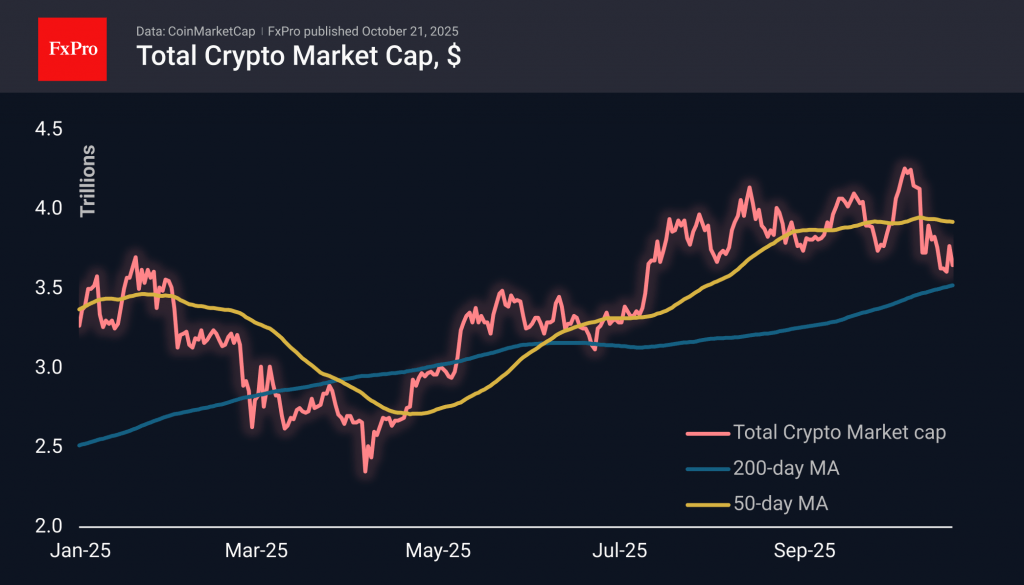
The crypto market capitalisation fell by 3.1% to $3.65 trillion during the day. The bulls failed to push the market above the recent highs of $3.95 trillion, and we are seeing the formation of an active short-term downtrend. This will be confirmed if the next local low is $3.35 trillion. These levels are already below the 200-day average, which will attract the attention of long-term sellers. So, we continue to closely monitor market dynamics near $3.5 trillion, where a meaningful moving average is located.
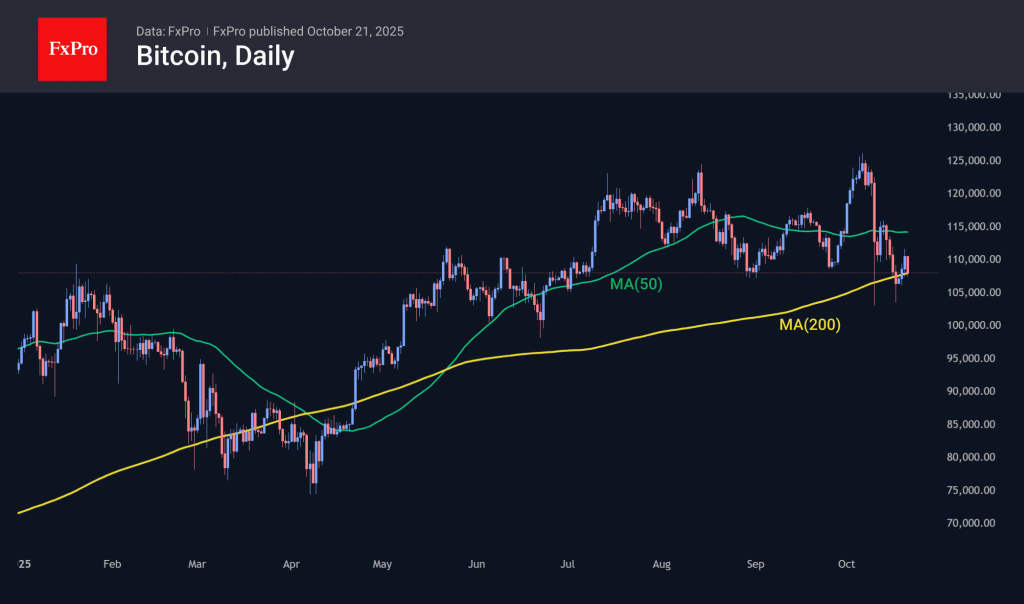
Bitcoin at $108K has again fallen to its 200-day moving average. It is pointing upwards and is now 30% higher than the levels seen in March-April, when BTC last dipped below it. The spring scenario of prolonged consolidation around a critical line and a further breakout now looks like a hopeful scenario for bulls. However, there are still risks that the first prerequisites for the next prolonged bear market are forming.
News Background
BTC’s rebound from its lows is encouraging, but the structure remains fragile. The decline in trading volumes on spot platforms and derivatives markets signals a decline in confidence and demand, according to Glassnode.
According to Galaxy Digital CEO Mike Novogratz, the recent sharp correction in the crypto market is unrelated to manipulation. According to him, the leading sellers were long-term investors and miners.
Sixty-seven per cent of institutional investors are optimistic about Bitcoin’s prospects for the next three to six months, according to a Coinbase Institutional survey of 124 respondents. At the same time, 45% of institutional investors believe the bull market is in its late stages.
Publicly traded companies continue to build up their crypto reserves. Strategy acquired 168 BTC over the past week. BitMine bought 203,826 ETH.
According to Jefferies, in September, the profitability of BTC mining fell by more than 7%, and the daily income per 1 EH/s of hash rate decreased from $56,000 to $52,000. In October, a sharp correction in the asset increased pressure on the economics of its mining.