
Sample Category Title
USD/JPY Mid-Day Outlook
Daily Pivots: (S1) 147.98; (P) 148.45; (R1) 149.38; More...
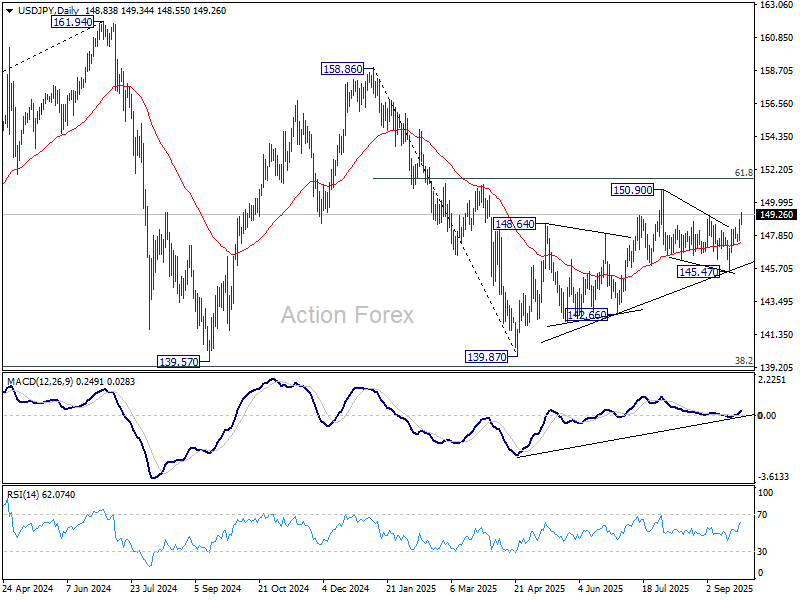
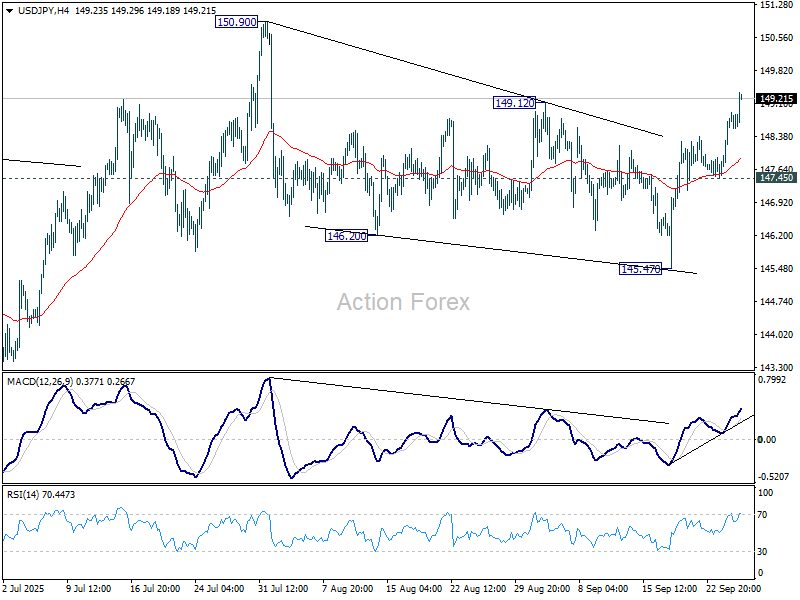
USD/JPY's rise from 145.57 extends higher today. The break of 149.12 resistance should confirm that correction from 150.90 has completed at 145.47. Further rally should be seen to retest 150.90. Break there will resume whole rise from 139.87. For now, risk will stay on the upside as long as 147.45 support holds, in case of retreat.

In the bigger picture, price actions from 161.94 (2024 high) are seen as a corrective pattern to rise from 102.58 (2021 low). Decisive break of 61.8% retracement of 158.86 to 139.87 at 151.22 will argue that it has already completed with three waves at 139.87. Larger up trend might then be ready to resume through 161.94 high. In case the corrective pattern extends with another fall, strong support is expected from 38.2% retracement of 102.58 to 161.94 at 139.26 to bring rebound.
Dollar Soars on Strong US Data, 10-Yr Yield Jumps Toward 4.2%
Dollar rallied broadly at the New York open after a powerful run of data, with Treasury yields surging as investors trimmed Fed cut bets. The 10-year note climbed toward 4.2%, while stock futures dipped modestly, reflecting the possibility that stronger growth could keep policy tighter for longer.
A major catalyst came from the upward revision of Q2 GDP growth from 3.3% to 3.8% annualized, a strong signal that economic momentum held firm despite tariff escalation concerns earlier in the summer. That's a clear sign that tariff risks have not derailed activity. The data also confirmed that the US economy carried far more momentum into the second half of the year than many expected.
Labor market signals added to the strength, with jobless claims falling back to their July lows. Durable goods orders also surprised with a broad expansion, defying forecasts of contraction and reinforcing the message of resilient investment demand.
Taken together, the reports are forcing markets to question whether the Fed needs to deliver as much easing as priced. Odds of two cuts this year to a 3.50–3.75% range have slipped below 70%, down from over 80% just last week, highlighting a subtle but important shift in expectations.
The Swiss Franc, by contrast, was on the defensive after the SNB left rates at 0.00% in a widely anticipated hold. Chair Martin Schlegel repeated that the bar for reintroducing negative rates remains high, though he stressed the central bank is ready to act if necessary. His cautious reassurance did little to support the Franc.
Overall, Dollar led performance on the day, with Loonie and Yen behind. Swiss Franc fell to the bottom of the board, with Sterling and Euro also under pressure. Commodity currencies traded mixed. North American currencies are in control, while European majors lag.
In Europe, at the time of writing, FTSE is down -0.47%. DAX is down -1.09%. CAC is down -0.85%. UK 10-year yield is up 0.068 at 4.744. Germany 10-year yield is up 0.027 at 2.781. Earlier in Asia, Nikkei rose 0.27%. Hong Kong HSI fell -0.13%. China Shanghai SSE fell -0.01%. Singapore Strait Times fell -0.39%. Japan 10-year JGB yield rose 0.01 to 1.649.
US durable goods surge 2.9% mom in August, crushing expectations
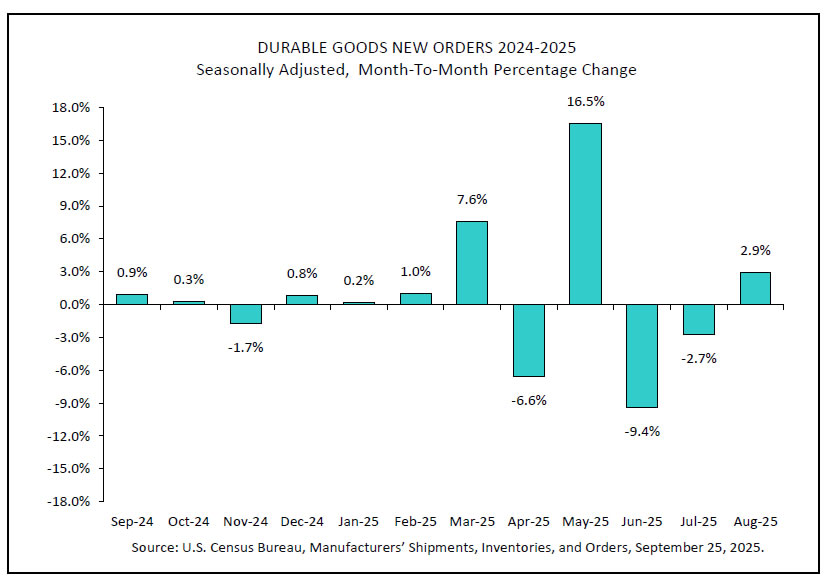
US durable goods orders surged 2.9% mom to USD 312.1B in August, far stronger than the expected -0.5% mom contraction. Excluding transportation, orders still rose 0.4% mom to USD 201.9B, beating forecasts for a small decline of -0.1% mom. Ex-defense orders climbed 1.9% mom to USD 290.7B.
The headline gain was led by a 7.9% mom jump in transportation equipment to USD 110.2B, but the breadth of gains pointed to firm underlying demand.
US initial jobless claims fall to 218k, vs exp 240k
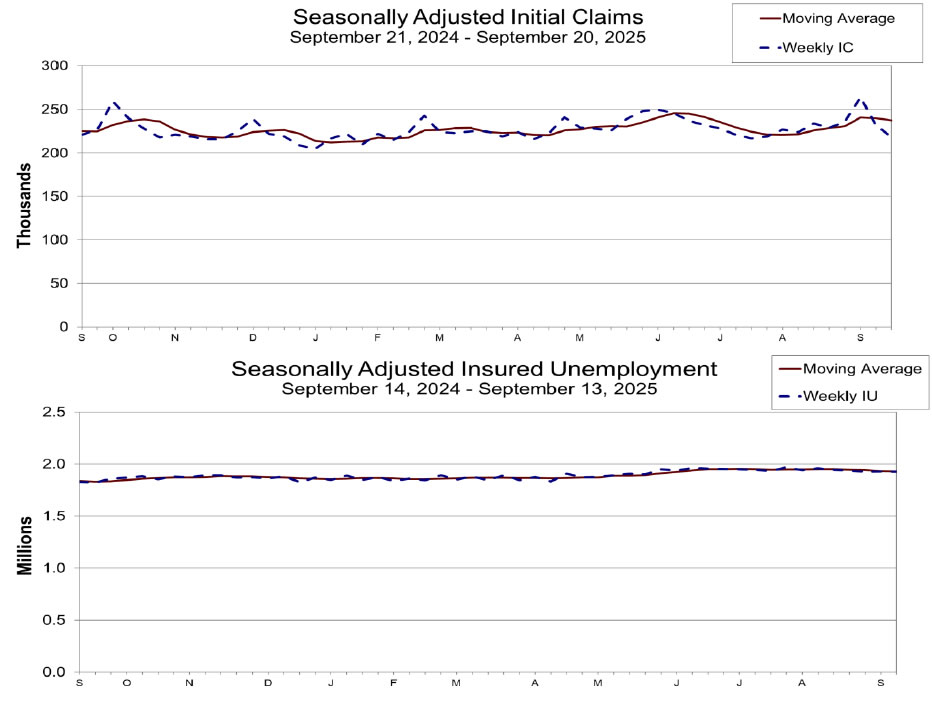
US initial jobless claims fell -14k to 218k in the week ending September 19, much better than expectation of 240k. Four-week moving average of initial claims fell -3k to 238k.
Continuing claims fell -2k to 1926k in the week ending September 13. Four-week moving average of continuing claims fell -4.5k to 1930.
SNB holds at 0.00%, inflation outlook unchanged
The SNB opted to keep its policy rate at 0.00% in September, delivering the first pause since its rate-cutting cycle began in December 2023. The move matched expectations and reflects a balance between subdued inflation and a weaker growth backdrop.
The central bank noted that inflation has edged up slightly, from -0.1% in May to 0.2% in August, driven mainly by tourism and higher prices for imported goods. Still, it stressed that inflationary pressures remain broadly unchanged since June, with the conditional forecast holding within its definition of price stability across the "entire forecast horizon". Annual inflation is projected at 0.2% in 2025, 0.5% in 2026, and 0.7% in 2027, assuming interest rates stay at 0%.
However, the SNB warned that the economic outlook has worsened due to “significantly higher US tariffs.” It said the measures are expected to weigh on exports and investment, with the machinery and watchmaking sectors particularly exposed. As a result, the SNB maintained its GDP forecast of 1–1.5% growth for 2025 but down graded expectations for 2026 to just under 1%.
BoJ minutes point to year-end hike possibility
The BoJ’s July meeting minutes revealed a growing debate among policymakers over the need to raise rates toward neutral levels. One member argued that with prices elevated and the output gap near zero, it was appropriate for the BoJ to “return the policy rate to its neutral level where possible.”
Another member warned against being “overly cautious,” saying the central bank should not miss the opportunity to hike rates, particularly as stock markets have reacted positively to the recent U.S.–Japan trade deal. Several others echoed this view, suggesting that another hike could be feasible before year-end if tariffs cause only limited drag on the economy.
Meanwhile, policymakers were divided on inflation. While one saw the overshoot as temporary and food-related, others highlighted the risk that persistent food price increases could entrench higher inflation expectations.
The debate has since intensified, as seen in September’s meeting when two members dissented in favor of lifting rates to 0.75%. The growing hawkish faction raises the prospect that the BoJ could still deliver another rate hike in the coming months, particularly if growth and inflation prove resilient.
USD/JPY Mid-Day Outlook
Daily Pivots: (S1) 147.98; (P) 148.45; (R1) 149.38; More...
USD/JPY's rise from 145.57 extends higher today. The break of 149.12 resistance should confirm that correction from 150.90 has completed at 145.47. Further rally should be seen to retest 150.90. Break there will resume whole rise from 139.87. For now, risk will stay on the upside as long as 147.45 support holds, in case of retreat.
In the bigger picture, price actions from 161.94 (2024 high) are seen as a corrective pattern to rise from 102.58 (2021 low). Decisive break of 61.8% retracement of 158.86 to 139.87 at 151.22 will argue that it has already completed with three waves at 139.87. Larger up trend might then be ready to resume through 161.94 high. In case the corrective pattern extends with another fall, strong support is expected from 38.2% retracement of 102.58 to 161.94 at 139.26 to bring rebound.

US initial jobless claims fall to 218k, vs exp 240k
US initial jobless claims fell -14k to 218k in the week ending September 19, much better than expectation of 240k. Four-week moving average of initial claims fell -3k to 238k.
Continuing claims fell -2k to 1926k in the week ending September 13. Four-week moving average of continuing claims fell -4.5k to 1930.
US durable goods surge 2.9% mom in August, crushing expectations
US durable goods orders surged 2.9% mom to USD 312.1B in August, far stronger than the expected -0.5% mom contraction. Excluding transportation, orders still rose 0.4% mom to USD 201.9B, beating forecasts for a small decline of -0.1% mom. Ex-defense orders climbed 1.9% mom to USD 290.7B.
The headline gain was led by a 7.9% mom jump in transportation equipment to USD 110.2B, but the breadth of gains pointed to firm underlying demand.
USD/CHF Holds Steady Following Central Bank Decision
Today, the Swiss National Bank (SNB) decided to keep its interest rate unchanged at zero, in line with analysts’ expectations.
Notably:
→ The SNB’s interest rate remains arguably the lowest among central banks of developed economies;
→ According to official statements, the main obstacle to Swiss economic growth is Trump’s tariffs.
Technical Analysis of the USD/CHF Chart
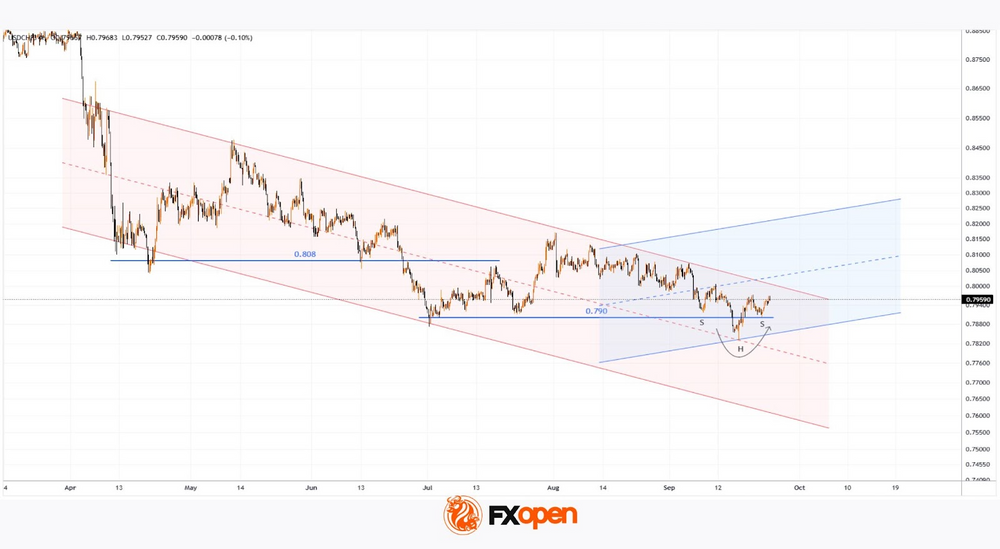
In 2025, the Swiss franc strengthened — which is unsurprising given the high demand for safe‑haven assets (as evidenced by gold’s record high) amid rising geopolitical and macroeconomic risks. At the same time, lower highs and lows have allowed the construction of a descending channel on the USD/CHF chart (shown in red).
However, a closer look at recent price dynamics suggests there are grounds to believe that the downtrend may be coming to an end. Why?
Firstly, the price is holding in the upper half of the channel, indicating insufficient selling pressure.
Secondly, consider the strength of the 0.7900 support level. In July, it prevented the market from falling further after the breach of the 0.8080 support level, and it continues to hold in September — note the price behaviour indicated by the arrow:
→ A bearish breakout attempt failed. After a brief dip below 0.7900, the price confidently returned above this level.
→ The median of the descending channel acted as support, and the chart shows lows that exhibit signs of an Inverse Head and Shoulders pattern.
This suggests that:
→ The current red channel may be broken in the near term, potentially driven by factors supporting USD strength;
→ There may be a bullish attempt to establish a rally, with targets indicated in blue.
Trade over 50 forex markets 24 hours a day with FXOpen. Take advantage of low commissions, deep liquidity, and spreads from 0.0 pips. Open your FXOpen account now or learn more about trading forex with FXOpen.
This article represents the opinion of the Companies operating under the FXOpen brand only. It is not to be construed as an offer, solicitation, or recommendation with respect to products and services provided by the Companies operating under the FXOpen brand, nor is it to be considered financial advice.
GBP/USD Under Pressure as Markets Question Bank of England’s Stance
The GBP/USD pair remains under pressure, trading around 1.3460, as it contends with a mix of conflicting factors.
In the UK, Bank of England Governor Andrew Bailey stated that inflation is expected to decline next year but confirmed that the central bank's policy will remain restrictive. He pointed to a weakening labour market and cautious consumers, whose savings are twice as high as pre-pandemic levels. Bailey acknowledged that interest rates would likely continue to fall but emphasised that the pace of easing would be strictly dependent on incoming inflation data.
Across the Atlantic, the US dollar is holding its ground following the Fed's rate cut last week. Markets are currently pricing in approximately 43 basis points of additional easing by year-end, although there is no clear consensus on whether a move will occur at the next meeting. Recent comments from Chair Jerome Powell and other Fed officials consistently underscore that any further action will be data-dependent, hinging on fresh inflation and employment figures.
Consequently, the pound is weighed down by domestic economic concerns and the BoE's cautious stance. The dollar, in turn, finds support from expectations of a gradual and measured Fed policy. This creates a stalemate marked by uncertainty, which is clearly reflected in the current range-bound dynamics of GBP/USD.
Technical Analysis: GBP/USD
H4 Chart:
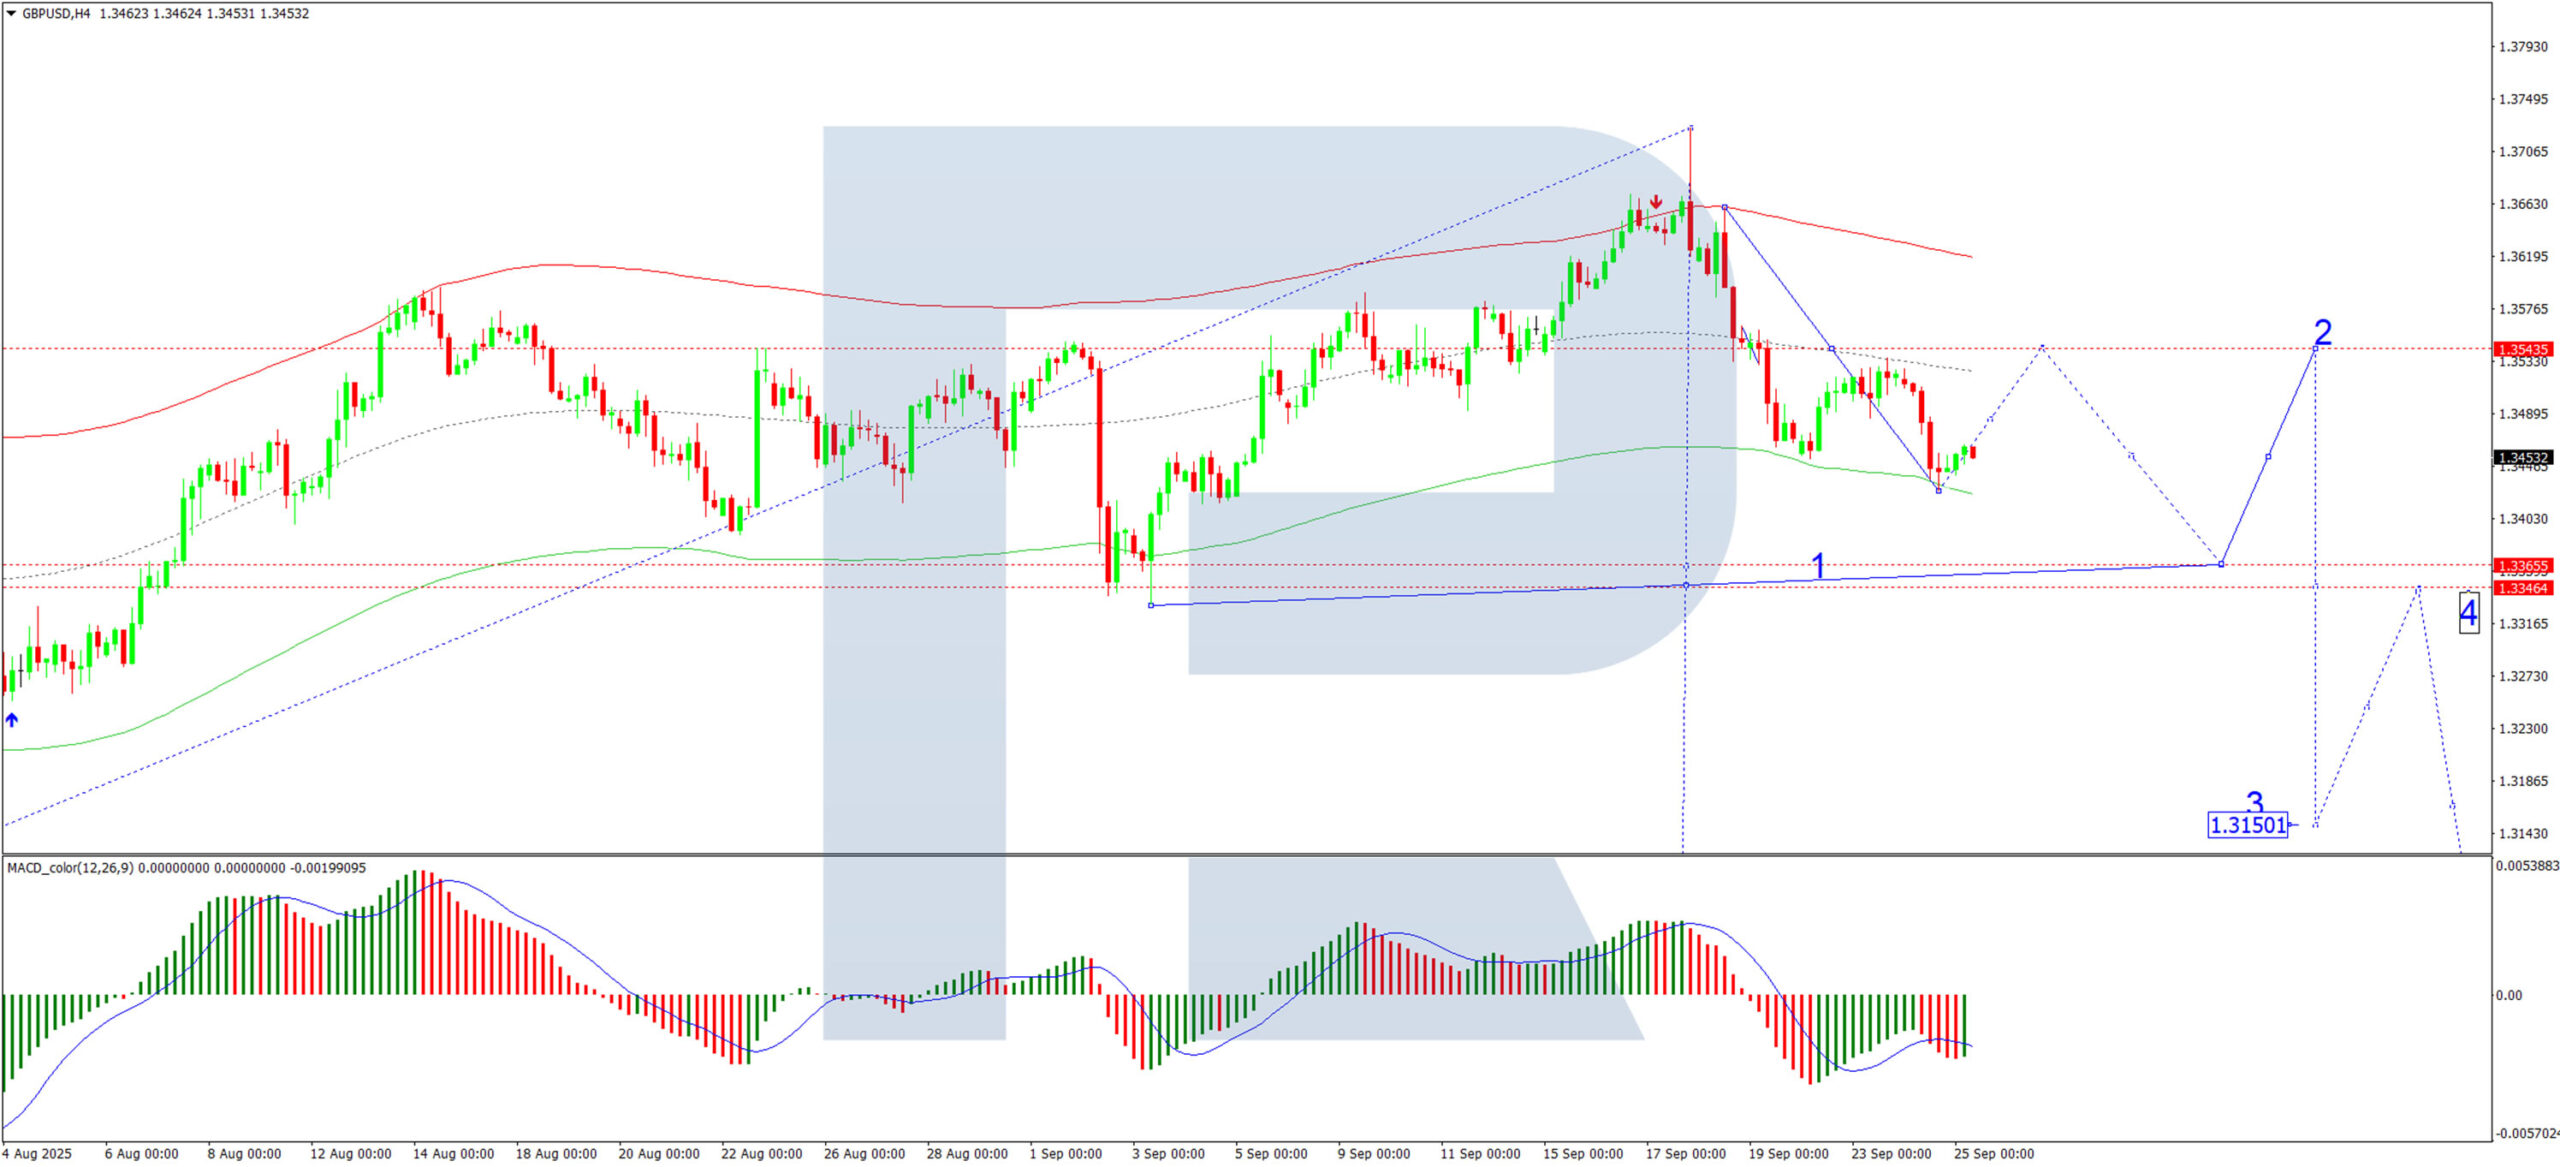
On the H4 chart, GBP/USD formed a tight consolidation range around 1.3544 before breaking lower to achieve the local target of the decline at 1.3427. Today, we anticipate the development of a consolidation range above this level. An upward breakout from this range would open the potential for a corrective move towards 1.3544 (testing it as resistance from below). Following this, we would expect the resumption of the downtrend targeting 1.3366. This bearish outlook is technically confirmed by the MACD indicator, whose signal line is located below zero and pointing decisively downward.
H1 Chart:
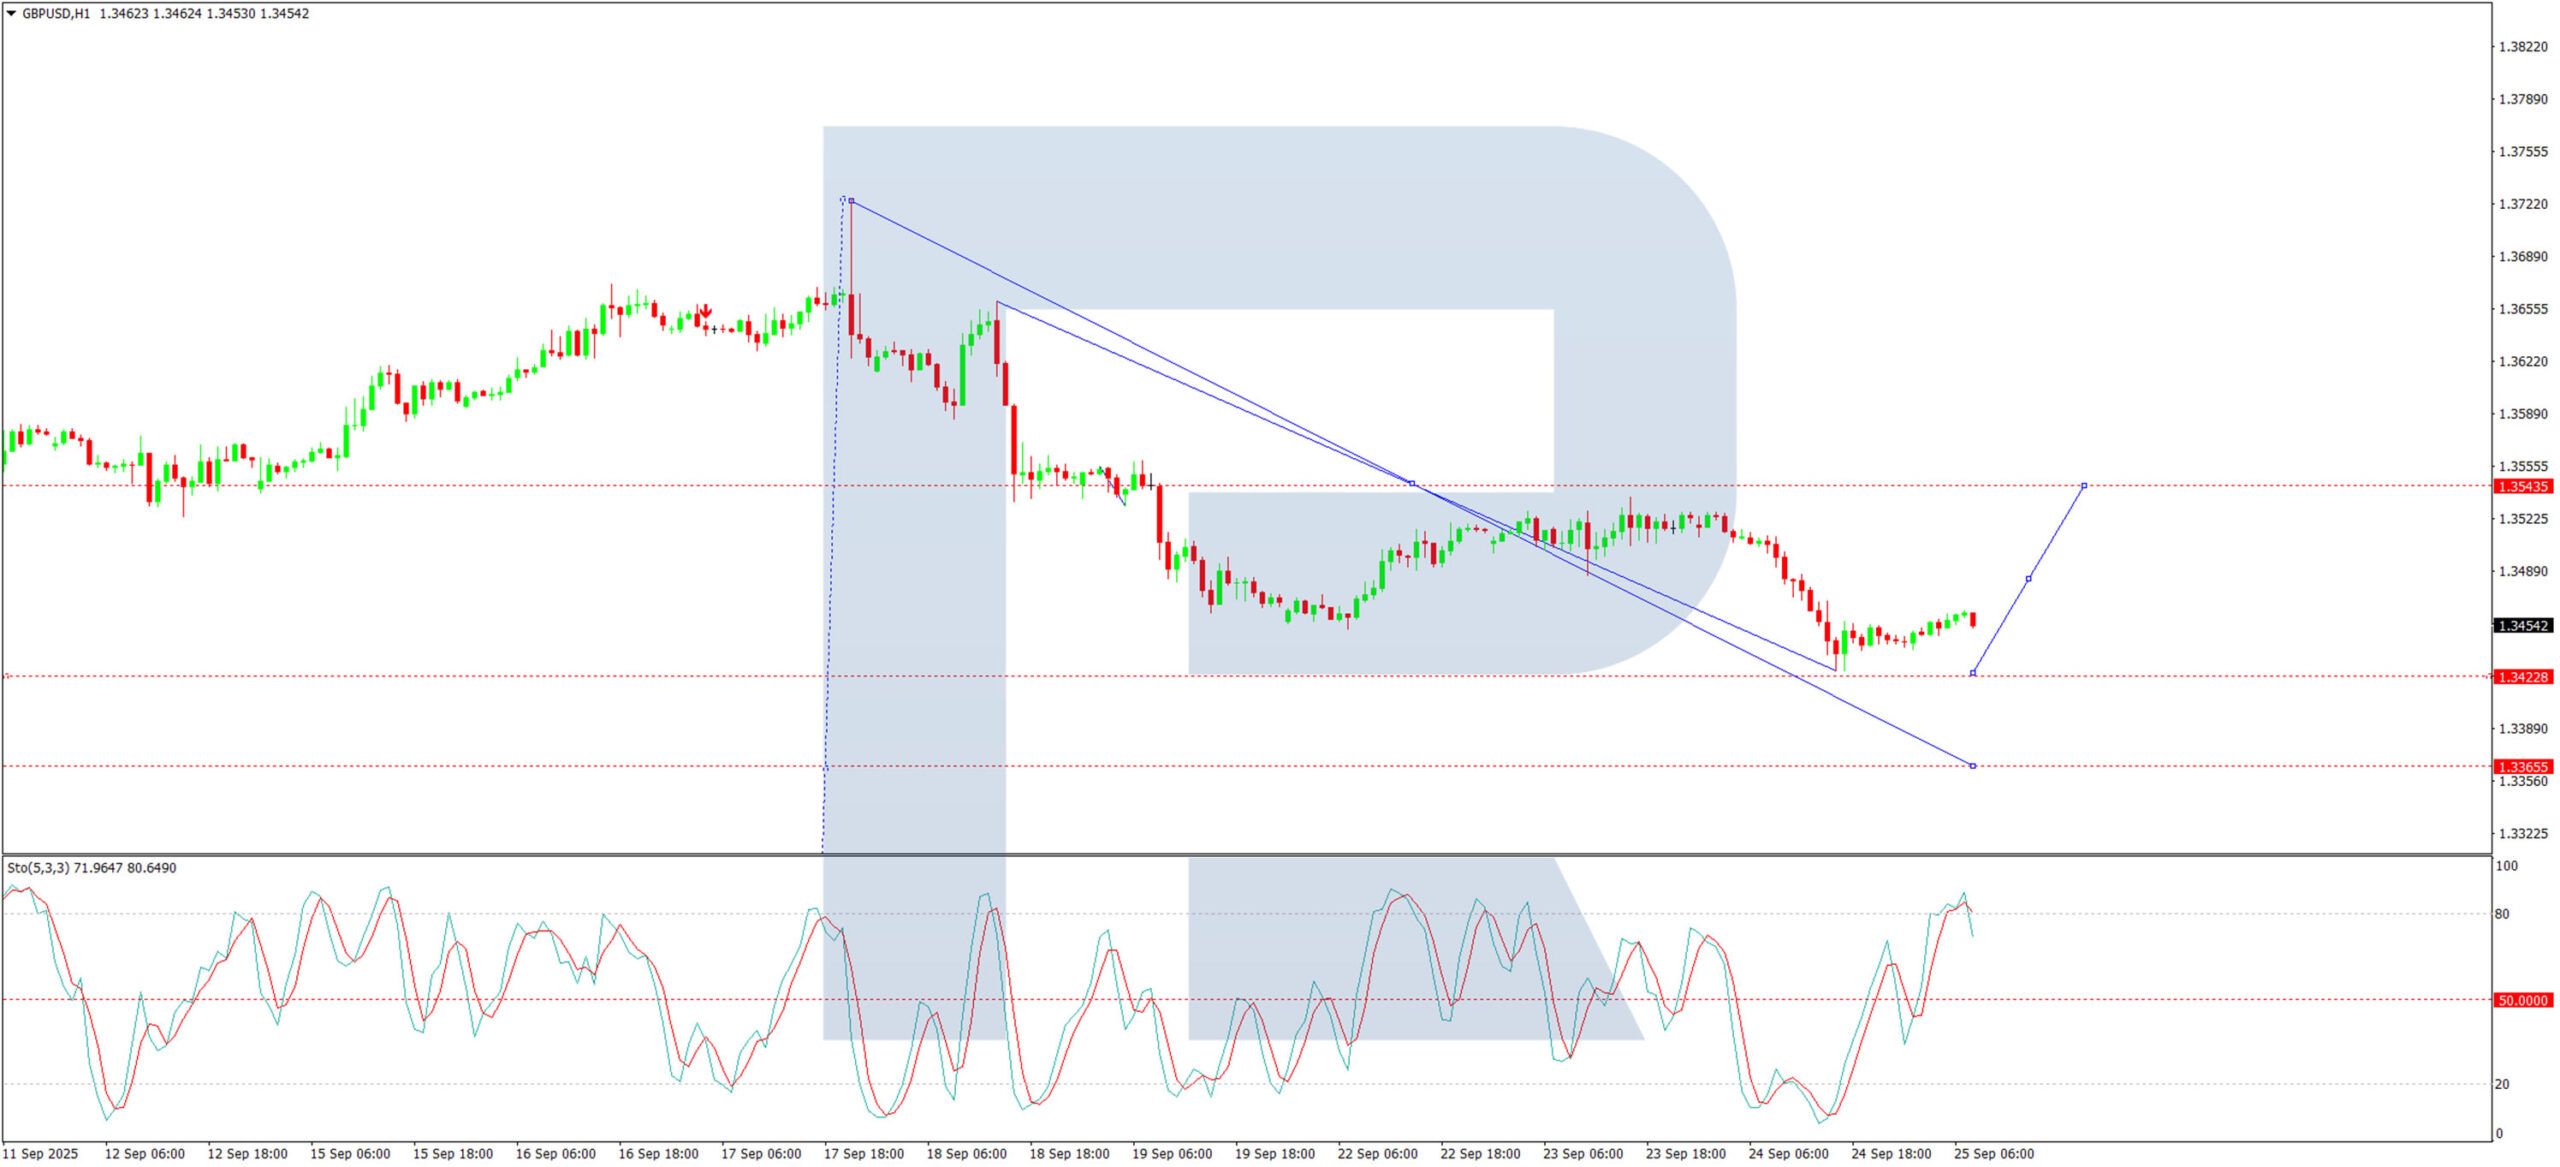
The H1 chart shows the pair forming the second leg of a downward impulse towards 1.3422, marking a local target. Upon its completion, we anticipate a potential correction towards the 1.3544 level. This scenario is supported by the Stochastic oscillator, with its signal line currently below 80 and falling sharply towards the 20 level.
Conclusion
The GBP/USD pair is caught between a cautious BoE and a data-dependent Fed, leading to a tentative equilibrium. The technical structure leans bearish, suggesting that any near-term rebounds are likely to be corrective within a broader downtrend, contingent on upcoming economic data from both sides of the Atlantic.
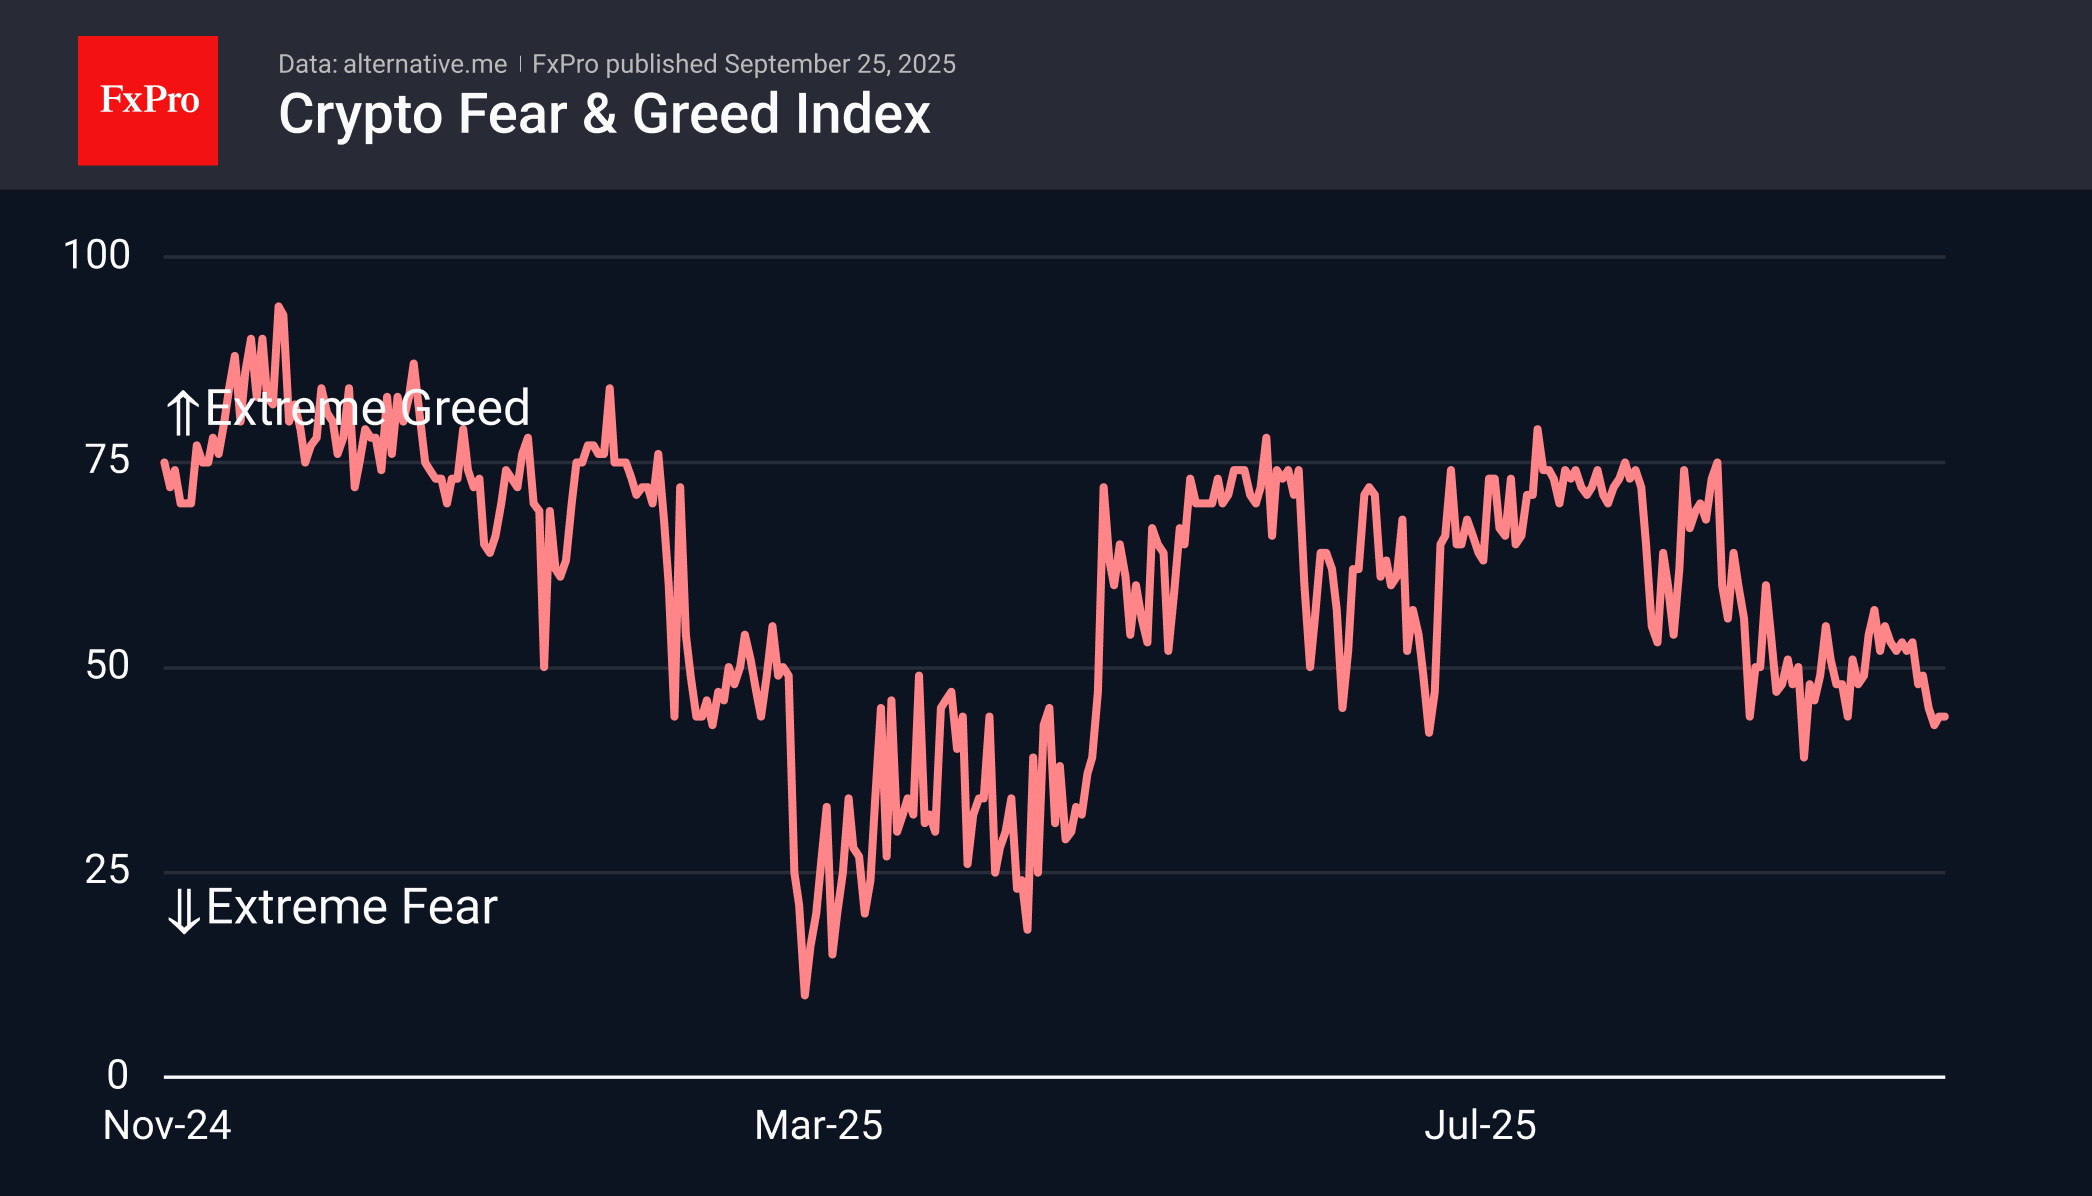
Crypto Market Digging Deeper
Market Overview
The crypto market capitalisation has fallen to a nearly three-week low of $3.83 trillion, falling deeper below its 50-day moving average. However, similar declines at the end of June and the end of August only encouraged buyers. On Thursday morning, Bitcoin wiped out the previous day’s gains, while major altcoins, Ethereum, and Solana, have been declining for the fifth trading session in a row.
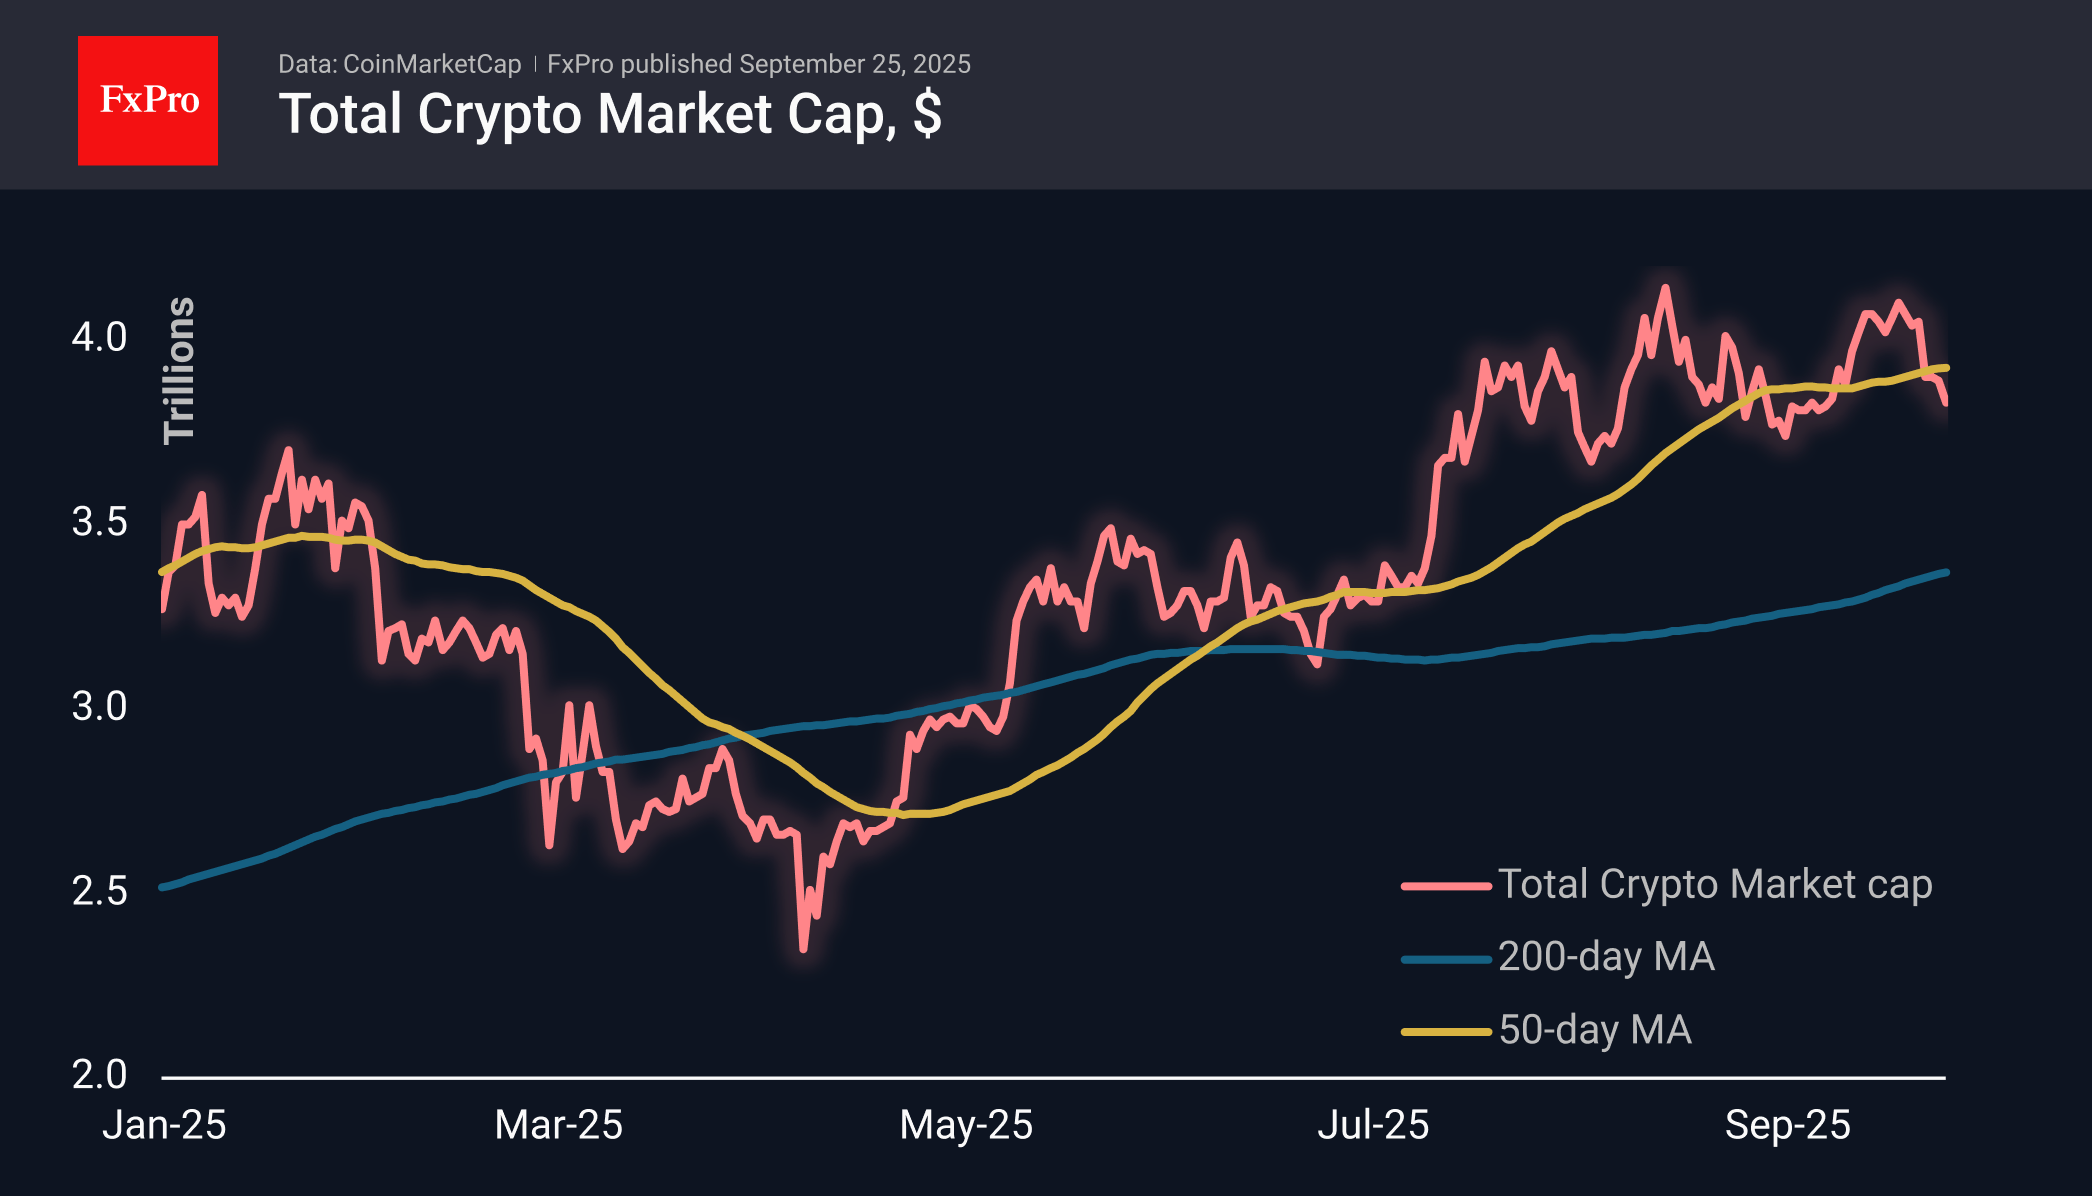
The sentiment index at 44 barely touches the fear zone, preventing us from talking about a full-fledged reversal in sentiment. Nevertheless, we are once again turning our attention to crypto as an early indicator of risk appetite. Altcoins, as well as small currencies of developed countries, have been losing ground since the Fed cut rates a week ago, and key US indices have joined them since Tuesday.
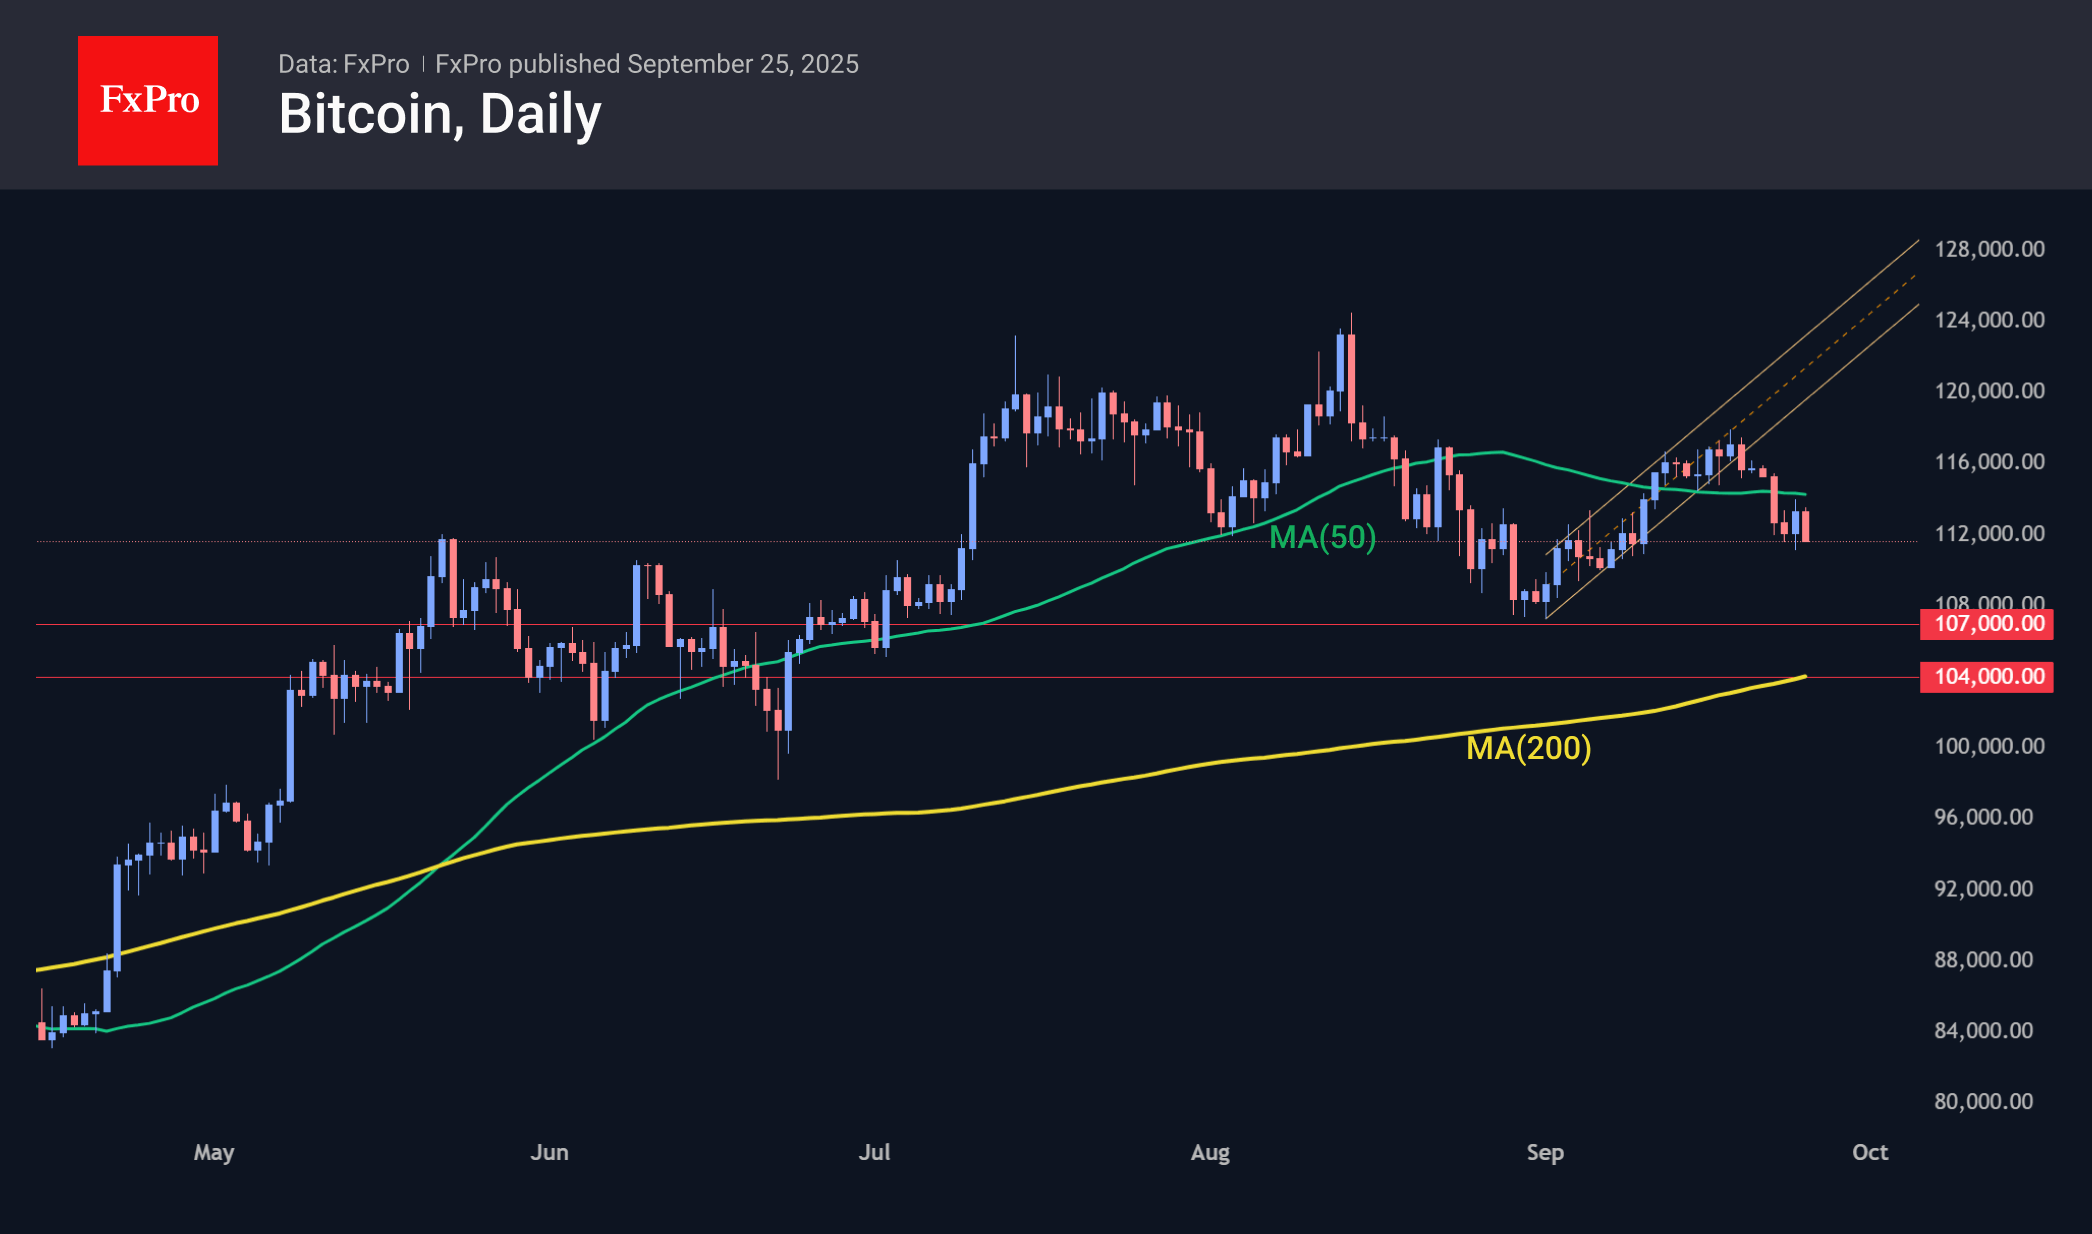
On Wednesday, Bitcoin unsuccessfully attempted to storm the 50-day moving average. Earlier, BTCUSD fell out of the upward channel that had been forming since early September. These are all signs of a deeper dive ahead, potentially into the $104-107K range.
News Background
Bitcoin’s implied volatility has fallen to its lowest level since 2023. Blockchain data points to a “calm before the storm,” according to XWIN Research. The last time this happened, it was followed by explosive growth.
CoinW also calls the situation “the calm before the storm.” Negative funding rates, seasonal trends, and inflows into institutional ETFs tip the odds in favour of growth. According to CoinGlass, Bitcoin has strengthened in October in 10 of the last 12 years.
If US inflation turns out to be moderate, the Fed’s rate will be further reduced, and the amount of liquidity in the market will increase. According to QCP Capital, this factor will be the main driver of Bitcoin’s growth in October.
However, JPMorgan CEO Jamie Dimon believes that the Fed is unlikely to cut its key rate. He sees factors that are more likely to cause inflation to rise than fall.
SkyBridge Capital founder Anthony Scaramucci confirmed his previous forecast that Bitcoin will reach its target of $150,000 by the end of the year. In his opinion, November-December is the most favourable period for buying BTC.
Pantera Capital CEO Dan Morehead said BRICS countries, including Russia and China, view Bitcoin as a tool for de-dollarisation. In his opinion, these countries will prepare to create state Bitcoin reserves and their own Bitcoin ETFs.
Dollar Strengthens on Fed Signals of a Pause in Rate Cuts
The US dollar firmed after comments from Federal Reserve Chair Jerome Powell, who suggested that further rate cuts are unlikely in the coming months. While markets continue to price in policy easing by the end of the year, the current rhetoric points to a pause in the near term, supporting the dollar in USD/JPY and USD/CAD pairs.
In the upcoming sessions, the key driver for the currency will remain US and Canadian data releases. Today, investors will focus on US Q2 GDP, weekly jobless claims and durable goods orders. Additional interest will centre on the Kansas City Fed manufacturing index and weekly housing reports. Tomorrow, attention will shift to the Core PCE Price Index — the Fed’s preferred measure of inflation — along with Canadian July GDP and US household income and spending data.
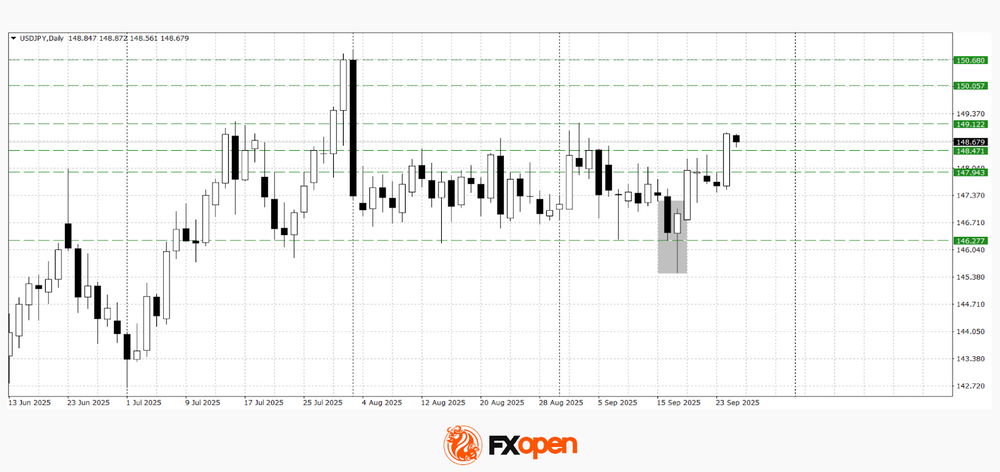
USD/JPY
After a false break below key support at 146.30 last week, USD/JPY buyers managed to form a bullish “piercing line” candlestick pattern. This setup helped lift the pair towards the upper boundary of the medium-term range at 146.30–149.00. Technical analysis of USD/JPY chart indicates a potential return inside this corridor, unless we see a daily close above 149.00 in the coming sessions.
Events likely to influence USD/JPY:
- Today at 15:30 (GMT+3): US core durable goods orders;
- Today at 15:30 (GMT+3): US GDP;
- Today at 15:30 (GMT+3): US initial jobless claims.
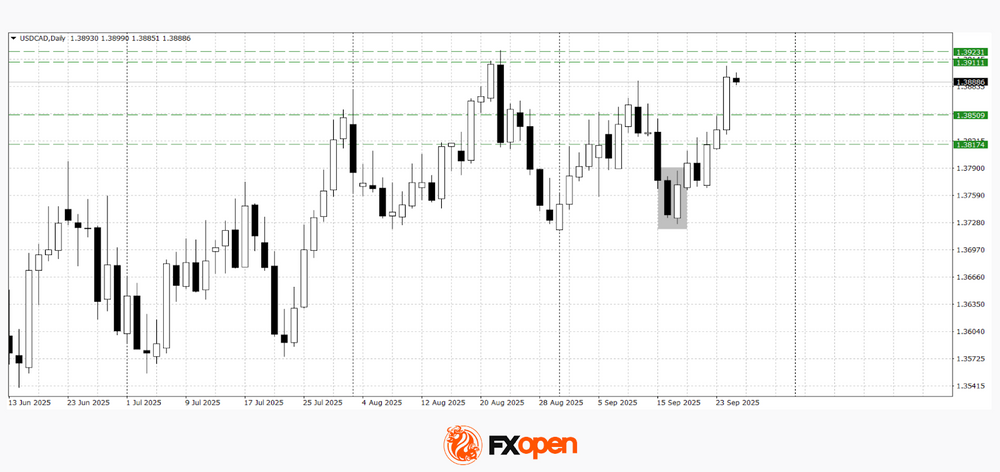
USD/CAD
USD/CAD buyers have brought the pair close to August’s highs for the year. If the 1.3900–1.3920 range establishes itself as support, the price may extend gains towards the psychological resistance at 1.4000. Conversely, as the USD/CAD chart suggests, a rejection from these levels and the formation of reversal patterns could trigger a downward correction, testing key levels in the 1.3820–1.3850 area.
Events likely to influence USD/CAD:
- Today at 20:00 (GMT+3): remarks by Michael S. Barr, Fed Vice Chair for Supervision;
- Tomorrow at 15:30 (GMT+3): US Core PCE Price Index;
- Tomorrow at 15:30 (GMT+3): Canadian GDP.
Trade over 50 forex markets 24 hours a day with FXOpen. Take advantage of low commissions, deep liquidity, and spreads from 0.0 pips. Open your FXOpen account now or learn more about trading forex with FXOpen.
This article represents the opinion of the Companies operating under the FXOpen brand only. It is not to be construed as an offer, solicitation, or recommendation with respect to products and services provided by the Companies operating under the FXOpen brand, nor is it to be considered financial advice.
RBA to Remain on Hold in September, Further Cuts Still Likely Afterwards
RBA to hold rates steady in September. November 25bp cut still the base case but not fully certain.
- We affirm our expectation that the RBA will hold the cash rate steady at 3.6% at its end-September meeting next week. An upside surprise in the August monthly inflation data will add a note of caution to its communication.
- We continue to expect that the RBA will cut the cash rate further over time. While a November timing of the next cut is now less certain, it remains our base case. We do not read either the August result or latest geopolitical developments as implying a renewed inflationary trend. Developments in the labour market are also an important counterweight to inflation concerns. Slow employment growth and declining vacancies confirm that the labour market is gradually softening.
- With the economy already broadly at full employment and inflation at target, the RBA will not rush to cut rates, but neither will it see a need to keep policy unnecessarily restrictive for an extended period. The timing of future rate cuts remains uncertain and it is possible the RBA ends up cutting by less than our current base case. Nonetheless, cuts in November, February and May remain our base case.
We already believed that the RBA would remain on hold at its September meeting and keep the cash rate at 3.6%. Anyone who thought there was a lingering chance of a cut next week will have ruled it out following this week’s August partial inflation data.
We nonetheless continue to expect that the RBA will cut the cash rate further over time. While a November timing of the next cut is now less certain, it remains our base case. We do not read either the August result or latest geopolitical developments as implying a renewed inflationary trend.
Having made the mistake three months ago of over-weighting the implications of the monthly inflation data for the RBA’s decision-making, we think it is prudent to avoid taking too much signal from the August partial inflation data about trends beyond the September quarter. And even if September quarter trimmed mean inflation ends up being even higher than our revised nowcast, the real question for monetary policy is the inflation outlook beyond the quarter now ending.
Some of the components that surprised on the upside in August (e.g. clothing) typically see some payback in the following month/quarter. And while services inflation was a bit higher than expected, this was not consistently true across the detail. In particular, the pick-up in inflation in prices of meals out and takeaway is consistent with the recovery in jobs growth in the hospitality sector over the past couple of quarters, following a significant retrenchment over 2023–2024. Some rebuilding of margins could be expected in these circumstances, but we do not think this necessarily implies ongoing higher inflation in this sector. Likewise, to the extent higher prices of meals out reflected higher food prices, ongoing higher inflation is unlikely given the latter’s volatility.
Nor do we see fresh inflationary impetus coming from abroad. China remains a source of global disinflation in tradeable goods. Some upside to global energy prices might emerge from Ukraine’s increasingly successful ranged campaign against Russia’s oil supply. This may be given further impetus by the change of tone on the war coming out of the US (it turns out President Trump despises ‘losers’ more than he admires autocrats). But we assess that the sustained price impact of a major decline in Russian oil supply would be small, of the order of a few dollars per barrel.
The main area where the August inflation data might be signalling a stronger ongoing trend is in homebuilding costs. Some of the surprising strength in this component in August reflected an unwinding of earlier price discounting by builders. This is a levels effect that should not be expected to boost price growth on an ongoing basis. However, we cannot rule out that the underlying trend growth in building costs is higher than the rates seen late last year before the period of discounting.
Beyond the current quarter, our forecasts continue to see trimmed mean inflation comfortably inside the RBA’s 2–3% target range and drifting a little below the midpoint next year. Indeed, even allowing for a stronger outcome in the September quarter, our forecast for the second half of 2025 (taking September and December quarters together) is in line with the RBA’s August forecasts. Part of this reflects that, if at least some of the August result is noise and there is some payback in the month of September, then all else equal, this flows through to a lower quarterly average for the months of the December quarter relative to the September quarter as well.
We are also mindful that the labour market is softening gradually, consistent with the usual lagged effects of previous tight monetary policy. Employment growth has slowed more than expected, and this week’s ABS job vacancies data confirm that the past tightness in the labour market is still unwinding. In addition, our longer-term view is that the rising trend in labour force participation has further to run in Australia. This contrasts with the RBA’s forecast of a steady participation rate from here, and the recent small step down in the participation rate and underemployment as cost-of-living pressures ease, reducing the need to supply additional labour (as we had previously flagged was likely). If we are right, the RBA could be surprised by the extent of labour market slack a few quarters from now; this is the logic behind our own forecast for unemployment being a little higher than the RBA’s. Wages growth and thus inflation would also surprise the RBA on the downside in that scenario.
Inflation is within the target range, and the labour market is broadly fully employed and softening gradually. We do not think this combination warrants tight monetary policy. At a 3.6% cash rate, monetary policy is probably not that tight, but some reduction would still be needed to avoid a needless undershoot of the inflation target. Indeed, the RBA’s own August forecasts embed an assumption that further rate cuts will be required to achieve its inflation forecast of trimmed mean inflation broadly around the target midpoint. We concur. The timing of future rate cuts remains uncertain and it is possible the RBA ends up cutting by less than our current base case. Nonetheless, 25bp cuts in November, February and May remain our base case.
SNB holds at 0.00%, inflation outlook unchanged
The SNB opted to keep its policy rate at 0.00% in September, delivering the first pause since its rate-cutting cycle began in December 2023. The move matched expectations and reflects a balance between subdued inflation and a weaker growth backdrop.
The central bank noted that inflation has edged up slightly, from -0.1% in May to 0.2% in August, driven mainly by tourism and higher prices for imported goods. Still, it stressed that inflationary pressures remain broadly unchanged since June, with the conditional forecast holding within its definition of price stability across the "entire forecast horizon". Annual inflation is projected at 0.2% in 2025, 0.5% in 2026, and 0.7% in 2027, assuming interest rates stay at 0%.
However, the SNB warned that the economic outlook has worsened due to “significantly higher US tariffs.” It said the measures are expected to weigh on exports and investment, with the machinery and watchmaking sectors particularly exposed. As a result, the SNB maintained its GDP forecast of 1–1.5% growth for 2025 but downgraded expectations for 2026 to just under 1%.