
Sample Category Title
AUD/USD Daily Report
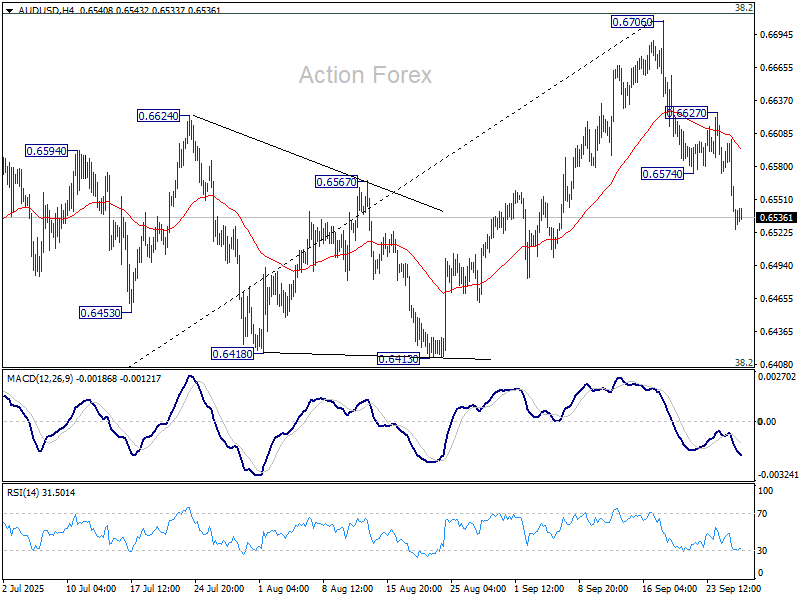
Daily Pivots: (S1) 0.6509; (P) 0.6556; (R1) 0.6587; More...
Intraday bias in AUD/USD remains on the downside at this point. Sustained trading below 55 D EMA (now at 0.6545) will confirm rejection by 0.6713 fibonacci resistance, and bring deeper fall to 0.6413 cluster support (38.2% retracement of 0.5913 to 0.6706 at 0.6403). For now, risk will stay on the downside as long as 0.6627 resistance holds, in case of recovery.
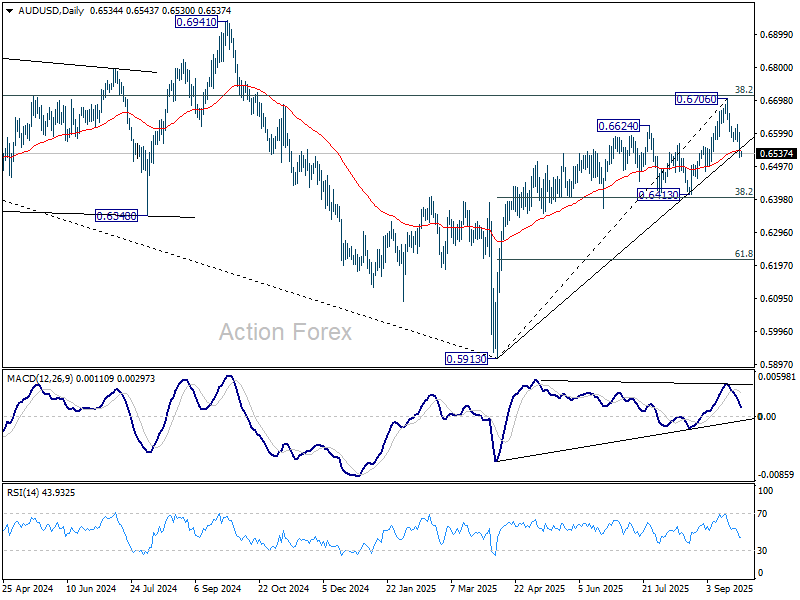
In the bigger picture, there is no clear sign that down trend from 0.8006 (2021 high) has completed. Rebound from 0.5913 is seen as a corrective move. Outlook will remain bearish as long as 38.2% retracement of 0.8006 to 0.5913 at 0.6713 holds. Nevertheless, considering bullish convergence condition in W MACD, sustained break of 0.6713 will be a strong sign of bullish trend reversal, and path the way to 0.6941 structural resistance for confirmation.
Money Markets Aren’t So Sure Anymore
Markets
A two-day rally by the US dollar brought it to its highest levels in about a month. The trade-weighted index closed at 98.55 yesterday. EUR/USD dipped to 1.1666, extending the correction lower from mid-September’s failed attempt for a topside break from the sideways trading range. USD/JPY came just shy of the 150 big figure. Renewed dollar strength came on the heels of a strong set US economic data. US Q2 GDP was revised upwards on higher personal consumption and jobless claims for a second week straight unexpectedly dropped. The level (218k) was the lowest since July and sowed doubts on whether the labour market is as weak(ening) as the Fed currently believes. With a stronger dollar came higher US yields. Net daily changes varied between +5.1 (2-yr) and near-flat (30-yr). European yields rose as well, with the belly underperforming the wings. The 2-yr swap yields punched through the recent September highs to close at levels last seen early April, prior to president Trump’s Liberation Day. Gilts underperformed. Yields rose 6.6-8.8 bps across the curve with the long end slightly lagging the rest. Demand in a series of sub-par gilt auctions this week was the lowest in several years. While the DMO easily raised the amounts targeted, it does indicate markets’ declining appetite for gilts as we go into the annual Autumn Budget announcement end November. Sterling grinded lower. EUR/GBP’s closing level was the highest since end 2023 (0.8741).
Overnight news flow is dominated by President Trump announcing some new tariffs and reviving the trade topic in doing so. Branded pharmaceuticals will be slapped a 100% tariff, starting October 1. Exemptions are offered to companies that are either “breaking ground” and/or already constructing manufacturing sites in the US. Other tariff announcements include a 25% levy on heavy trucks and a 50% charge on kitchen cabinets and bathroom vanities. They are introduced under Section 232 of the Trade Expansion Act, so falling outside the scope of the reciprocal tariffs that are currently being investigated for its legality while remaining in place at least through October 14. The impact for regions such as the EU could (conditional tense intended) stay limited since the 15% trade deal struck with the US is considered to be overruling. The US is said to announce other duties as well in coming weeks, including on semiconductors and critical minerals. In the meantime and from a daily perspective, we’ll be looking at the release of the August PCE deflators. A slight acceleration is expected on a headline basis to 2.7% while the core measure should match July’s 2.9%. The attention is focused at whether or not we’ll see more tariff-related inflation filtering through. If so, that could further question the Fed’s ability to deliver two more cuts this year. Money markets aren’t so sure anymore and that’s been supportive to (ST) yields and the dollar. EUR/USD 1.1557/1.1573 serves as a first support.
News & Views
Inflation in the Japanese capital region declined by 0.1% M/M in September to stabilize at a downwardly revised 2.5% Y/Y. Consensus feared an acceleration to 2.8% Y/Y. Core measures slowed even more. Without fresh food prices, prices fell by 0.2% M/M (2.5% Y/Y stable). Also abstracting energy prices left them 0.3% lower (2.5% Y/Y from 3% Y/Y). Lower services prices (-0.4% M/M) contrasted with region goods prices (+0.2% M/M). The unexpected slowdown in Tokyo inflation has likely to do with local legislation (waiver of childcare fees for firstborns) and is unlikely to be repeated in national numbers to be released on October 24, one week before a potential pivotal Bank of Japan meeting (Oct 30; first rate hike since January?).
Dallas Fed president Logan made the case for modernizing the FOMC’s operating target rate. The FOMC began publicly targeting the fed funds rate in the mid-1990s which is now outdated. A repo rate would provide a more robust target and allow the Fed to adjust proactively and planfully. She proposes switching to the tri-party general collateral rate (TGCR) which is cleaner as it incorporates more than $1tn a day in risk-free transactions that represent a marginal cost of funds and marginal return on investment for a large number of participants.
Inflation Will Tell If Strong US Growth Was Bad News
Uh oh — that US growth report yesterday was just a bit too strong for investors’ liking. On the surface, strong GDP should be good news but the problem is, such strong growth doesn’t support further Federal Reserve (Fed) rate cuts, and it could even boost inflation expectations on top of potential tariff-led pressures. Understandably, October rate cut expectations took a hit after the GDP release. The probability of a cut fell from around 94% to below 88%. The US 2-year yield — the best proxy for Fed expectations — rebounded to 3.67%, its highest since early September. The dollar index rallied past its 100-DMA as Fed expectations were reassessed, while major US indices retreated from all-time highs but managed to recover part of the early losses. Dip buyers found a reason to step in — namely, the inflation component, which was more contained than feared, near 2%.
Still, sentiment in Asia is weak this morning, especially in tech-heavy indices. The Korean Kospi is down nearly 3% at the time of writing, while the Hang Seng is 0.65% lower. The Topix is the exception, hitting a fresh all-time high, certainly helped by a rapidly weakening yen. The USDJPY is flirting with 150, supported by a stronger US dollar, easing long-maturity JGB yields, and a softer yen after Tokyo CPI came in below expectations. To note: the USDJPY ends the week confirming a positive breakout above a key Fibonacci level, with the next bullish target near 151.65.
Back to US markets, the risk rally isn’t necessarily over. Today’s core PCE — the Fed’s preferred inflation gauge — is expected to show easing price pressures on a monthly basis. On a yearly basis, core PCE is expected to remain sticky near 3%. Yes, that’s above the Fed’s 2% target, but the Fed has been more tolerant of overshooting lately, pointing to downside risks to jobs. As such, data in line with expectations — or ideally softer — could revive risk appetite. A hotter print, though, would prolong the pause to the risk rally and reinforce the idea that the Fed may stay patient well into next year before cutting.
On FX, EUR/USD slipped below its 50-DMA yesterday, extending its post-FOMC correction on the back of strong US GDP data. A failure to get dovish confirmation from PCE could deepen the downside. Cable fell to 1.3323 and looks set to test the 1.3130–1.3200 area, which includes the 200-DMA and the major 38.2% Fibonacci retracement of this year’s rally. That zone will be decisive: either the bullish trend holds, or we see a medium-term bearish reversal. Political unease and the looming Autumn Budget make sterling look less attractive in October, leaving the EURGBP comfortably supported in the next 4–6 weeks.
In metals, higher yields and a stronger dollar weighed on gold, as investors trimmed dovish Fed bets. Still, gold hasn’t broken down in any meaningful way. Inflation expectations remain anchored, geopolitical risks are simmering and central bank demand continues to underpin the metal. What’s also notable is that gold is holding near elevated levels despite rising real yields — a relationship that historically would have pressured it lower. That suggests gold is no longer just a hedge against rates, but a strategic allocation — an insurance against policy mistakes, market volatility and geopolitical flare-ups. So near-term, price action may stay choppy, but the broader trend remains intact. If today’s PCE shows easing inflation, gold could regain some ground as yields and the dollar soften.
If not, dips still look like buying opportunities, and many investors see the rally having much further to run.
Trump Approves Tik Tok Sale
In focus today
In the US, August PCE data is due for release in the afternoon. PCE is the Fed's preferred measure of inflation, and besides prices, the release also sheds light on private consumption volume growth. Earlier CPI and retail sales data pointed towards steady developments on both components.
In Denmark, data on retail spending in August released. Our spending monitor showed a 0.5% m/m increase in real retail spending in August, following a strong 1.2% m/m rise in July. We expect the figures from Statistics Denmark to reflect the same trend, with an increase in August.
Economic and market news
What happened overnight
In the US, President Trump approved the sale of TikTok's US operations, valuing the new company at $14 billion. The deal transfers control of TikTok's algorithm to a US-based entity, with ByteDance retaining less than 20% ownership. While Oracle and Silver Lake are expected to hold significant stakes, concerns persist due to reports suggesting ByteDance may maintain influence through a separate US entity managing e-commerce and branding operations.
Trump unveiled new tariffs, including a 100% levy on branded drugs and a 25% tariff on heavy-duty trucks, citing national security concerns. Details are sparse, but pharma tariffs are waived if the company has started building a US manufacturing plant. The pharmaceutical industry and US Chamber of Commerce criticised the measures, while markets saw declines in pharma and furniture stocks across Asia. The tariffs are set to take effect on 1 October.
What happened yesterday
In the US, jobless claims fell to 218,000 last week (cons: 235,000), Q2 GDP growth was revised higher to 3.8% from 3.3%, driven by a stronger-than-expected rebound in private consumption (+0.61% q/q, pre-revision +0.39%, Q1 +0.15%). Durable goods orders also exceeded expectations. These hawkish data points pushed UST yields higher and put downward pressure on EUR/USD. Meanwhile, the trade deficit narrowed in August (-85.5 billion, from -102.8 billion) as higher tariffs curbed imports, though declining wholesale inventories (-0.2% m/m, cons: +0.2%) suggest imports may rebound if demand holds steady. Fed's Goolsbee was on the wire, noting concerns about persistently rising inflation and expressing unease about prematurely front-loading rate cuts despite slowing jobs data.
In Switzerland, the SNB held its policy rate unchanged at 0% as anticipated. It maintained its stance on foreign exchange intervention, though sight deposit data shows no signs of recent activity. The inflation forecast saw a slight upward revision, but inflationary pressures remain broadly unchanged. This aligns with expectations that the SNB will keep rates steady at 0% moving forward.
In the euro area, credit growth continued to rise in August on an annual basis, while momentum is heading lower. Loans to non-financial corporations (NFCs) increased to 3.0% y/y from 2.8% y/y, and loans to households rose to 2.5% y/y from 2.4% y/y. However, the momentum in credit growth is declining, with the credit impulse (measuring the change in the annual growth rate) dropping to its lowest level in over a year. The credit impulse, which is better correlated with GDP growth, supports our view that economic growth will slow significantly in the second half of the year. We forecast 0.1% q/q growth in both Q3 and Q4 for the euro area.
In Sweden, producer prices fell by 0.7% y/y in August, marking the sixth consecutive month of deflation. This was driven by a sharp drop in capital goods prices, while energy-related products rebounded. Monthly PPI rose by 0.5%, and non-durable goods prices, an indicator of food inflation, continued to decline to 2.5% y/y.
Equities: Sour risk across the board yet again. The better than anticipated initial jobless claims, continuing claims and a revision higher of the US GDP figures which at the face of it should have led to higher equities as well. However, equities lower went as they took the cues from the higher US yields. Only the energy sector posted gains, buoyed by higher oil prices. Both S&P500 and Nasdaq ended 0.5% lower, while in Europe the Stoxx600 was 0.6% lower. Looking beneath the surface, the outlook for better US growth also meant growth stocks outperformance value as well as cyclicals outperformed defensives. Yesterday's price action seems to be a precursor for what the NFP number can do next week, if it comes on the high side; kill the goldilocks narrative.
FI and FX: The greenback had another strong session yesterday after the low jobless claims print which means that the recent uptrend is broken and supports Fed Powell's and Danske Bank's view that the labour market is not in that bad a shape. Rates responded by bear flatten the yield curve as the 2-year yield rose 6bp. The move higher in yields was bolstered by another lukewarm Treasury auction, now in the 7-year segment. EUR/USD set a weekly low at 1.1650, down from 1.1740 pre-jobless claims. USD/Scandies well supported, and we continue to see further upside in USD/SEK which now trades at 9.46.
USD/CAD Daily Outlook
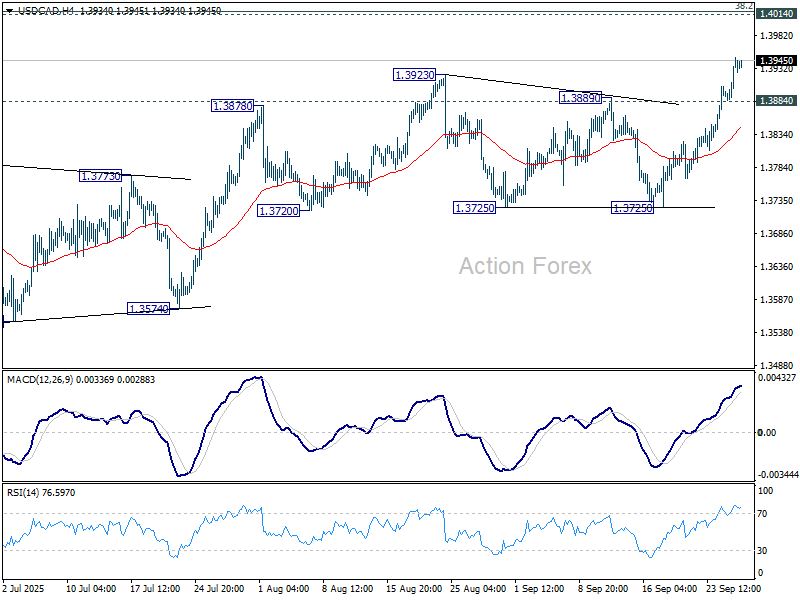
Daily Pivots: (S1) 1.3900; (P) 1.3925; (R1) 1.3965; More...
USD/CAD's rally continues and the break of 1.3923 confirms resumption of whole rebound from 1.3538. Intraday bias stays on the upside for 1.4014 cluster resistance. Strong resistance is expected from there to limit upside to complete the corrective rise. On the downside, below 1.3884 minor support will turn intraday bias neutral first.
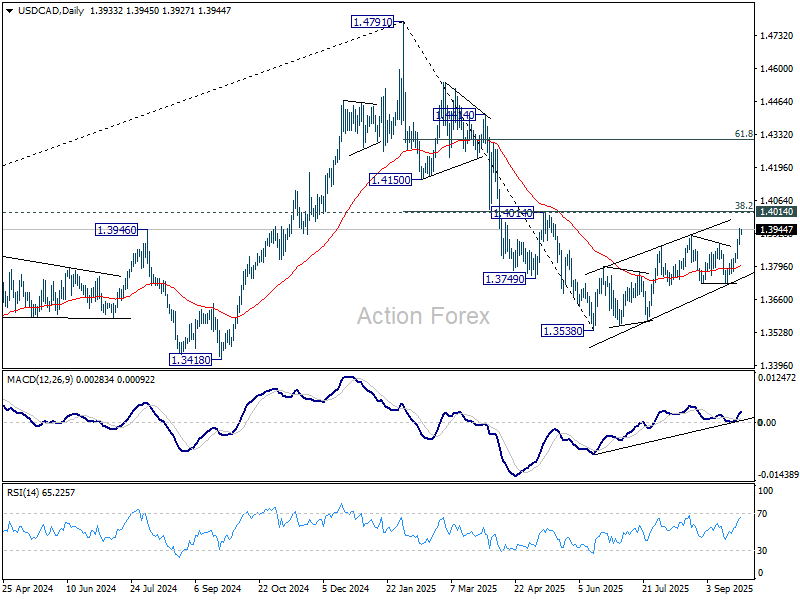
In the bigger picture, price actions from 1.4791 medium term top could either be a correction to rise from 1.2005 (2021 low), or trend reversal. In either case, further decline is expected as long as 1.4014 cluster resistance (38.2% retracement of 1.4791 to 1.3538 at 1.4017) holds. Next target is 61.8% retracement of 1.2005 (2021 low) to 1.4791 (2025 high) at 1.3069. However, sustained break of 1.4014 will argue that fall from 1.4791 has completed, and bring stronger rally to 61.8% retracement at 1.4312.
Trump’s New Tariff Wave Hits Sentiment, PCE Data Eyed
Asian stocks edged lower today as investors digested fresh U.S. tariff announcements from President Donald Trump and tempered expectations for aggressive Fed easing. Risk appetite softened, with trade uncertainty once again colliding with questions over monetary policy.
At the Fed, officials remain hesitant to commit to a firm easing path. Outside of Governor Stephen Miran’s calls for deeper and faster moves, most policymakers are emphasizing data dependence. The message is clear: cuts are still coming, but the pace and scale will be dictated by incoming numbers.
As it stands, markets see back-to-back easing in October as highly likely, with futures pricing an 87.7% probability of a cut. However, the chance of another move in December has slipped to 62%, reflecting unease over whether the Fed will need to accelerate the pace of its cuts.
That puts sharper focus on today’s PCE inflation release, the Fed’s preferred gauge. A stronger-than-expected print could dampen easing expectations further, while a soft outcome could revive bets for a December cut. Even so, the decisive test will come with next week’s non-farm payrolls, which will give the clearest signal on labor market health.
On the trade front, Trump announced sweeping new duties, including 100% tariffs on imported branded drugs, 25% on heavy-duty trucks, and 50% on kitchen cabinets. Bathroom vanities and upholstered furniture will also face tariffs of 50% and 30% respectively, with all measures set to take effect on October 1. Uncertainty remains high as Trump did not clarify whether the duties would be layered on top of existing tariffs or if key trading partners with agreements—such as the EU or Japan—would be exempt.
In currencies, Dollar has emerged as the week’s strongest performer, followed by Swiss Franc and Euro. At the bottom, Kiwi leads losses, trailed by Yen and Loonie, while Sterling and Aussie hold middle ground.
In Asia, Nikkei fell -0.64%. Hong Kong HSI is down -0.56%. China Shanghai SSE is down -0.28%. Singapore Strait Times is up 0.01%. Japan 10-year JGB yield rose 0.009 to 1.658. Overnight, DOW fell -0.38%. S&P 500 fell -0.50%. NASDAQ fell -0.50%. 10-year yield rose 0.025 to 4.172.
Fed’s Goolsbee cautions against front-loading cuts, Daly favors gradual approach
Speaking overnight, Chicago Fed President Austan Goolsbee noted he is “somewhat uneasy” with front-loading too many rate cuts based solely on slowing payroll growth. With inflation above 2% for nearly five years and moving “the wrong way,” he warned that simply assuming price pressures are transitory is a risky strategy.
Separately, San Francisco Fed President Mary Daly reiterated that further easing will likely be needed but emphasized a measured pace. She argued that cutting “a little bit more over time” while reassessing incoming data is the safer way to balance the Fed’s dual mandate.
Daly cautioned that moving too quickly could risk undermining either employment or price stability. A gradual approach, she said, allows the central bank to “actually get to a good achievement” by avoiding overcorrections.
Tokyo CPI core stays at 2.5% in September, core-core slows
Tokyo inflation came in softer than expected in September, with core CPI (ex-fresh food) unchanged at 2.5% yoy versus forecasts of 2.8% yoy. The moderation was largely attributed to measures by the metropolitan government, including cuts to childcare fees and water charges, easing some of the burden from rising living costs.
Core-core inflation, stripping out fresh food and energy, slowed sharply from 3.0% yoy to 2.5% yoy, while headline CPI was also steady at 2.5% yoy. Food inflation excluding fresh items cooled to 6.9% yoy from 7.4% yoy, highlighting a broadening slowdown in price pressures.
The weaker data may give the BoJ some breathing room, though markets still price another 25bps hike in the months ahead. Opinion remains divided on whether policymakers act as soon as October or hold off until January.
USD/CAD Daily Outlook
Daily Pivots: (S1) 1.3900; (P) 1.3925; (R1) 1.3965; More...
USD/CAD's rally continues and the break of 1.3923 confirms resumption of whole rebound from 1.3538. Intraday bias stays on the upside for 1.4014 cluster resistance. Strong resistance is expected from there to limit upside to complete the corrective rise. On the downside, below 1.3884 minor support will turn intraday bias neutral first.
In the bigger picture, price actions from 1.4791 medium term top could either be a correction to rise from 1.2005 (2021 low), or trend reversal. In either case, further decline is expected as long as 1.4014 cluster resistance (38.2% retracement of 1.4791 to 1.3538 at 1.4017) holds. Next target is 61.8% retracement of 1.2005 (2021 low) to 1.4791 (2025 high) at 1.3069. However, sustained break of 1.4014 will argue that fall from 1.4791 has completed, and bring stronger rally to 61.8% retracement at 1.4312.
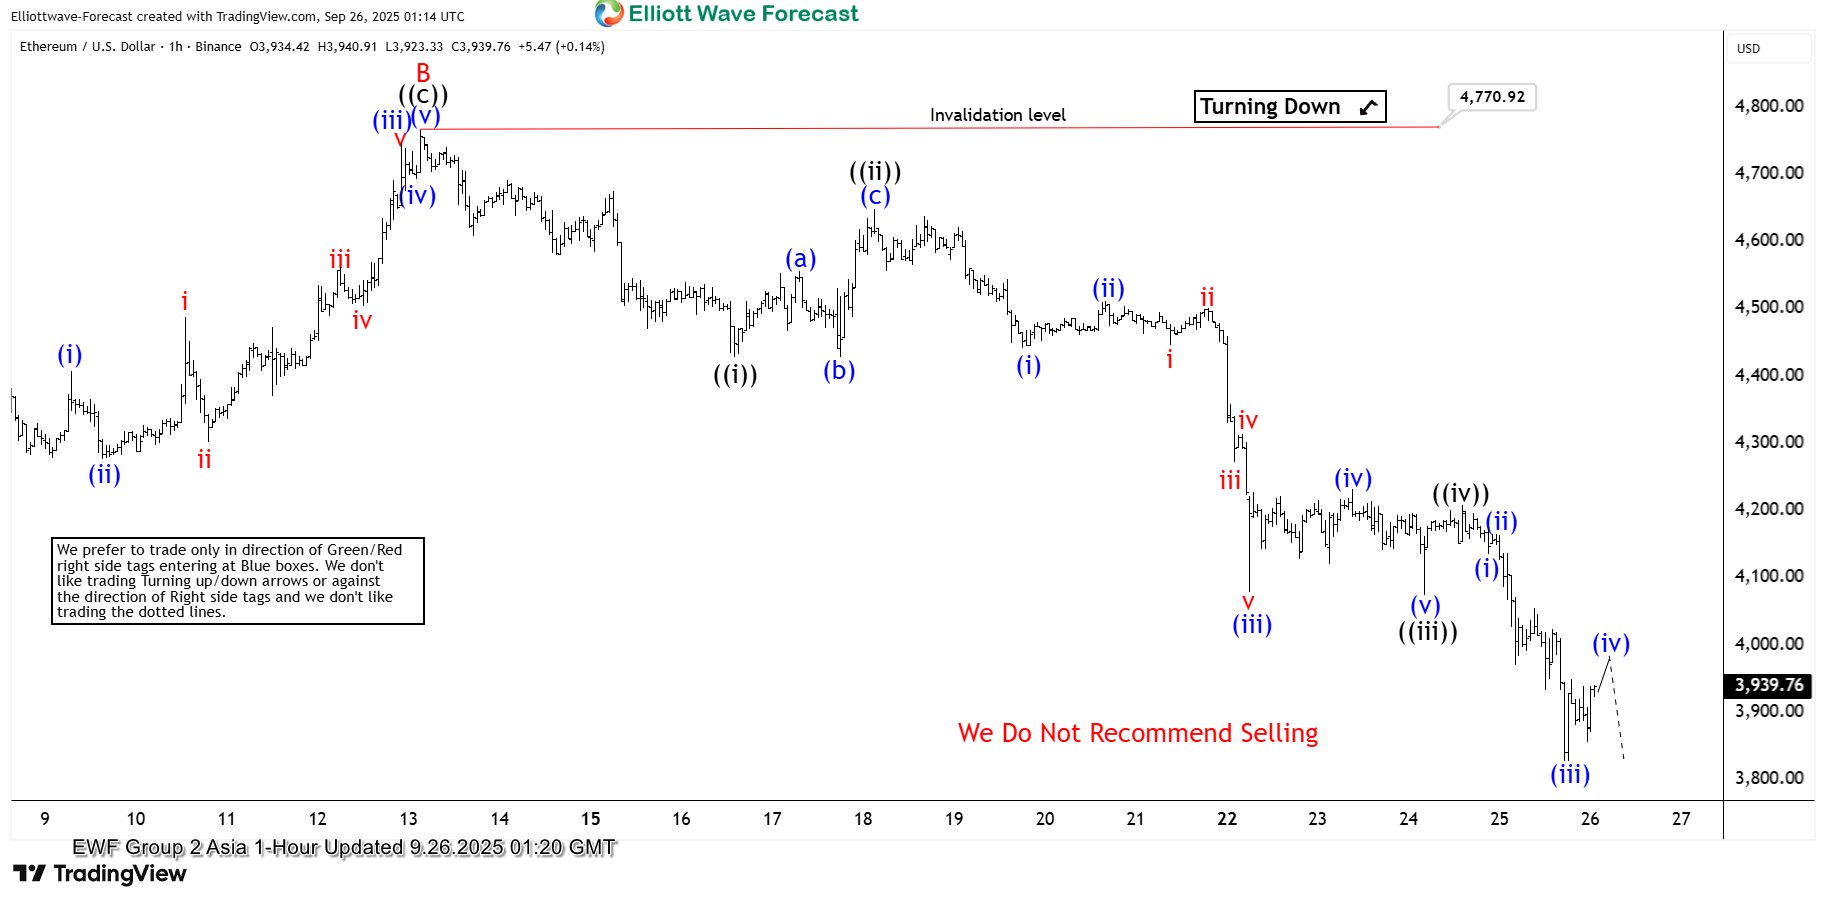
Ethereum (ETHUSD) Nearing Support, Ready for a Turnaround
The short-term Elliott Wave analysis for Ethereum (ETHUSD) indicates that the cycle from the August 24, 2025 peak continues to unfold as a zigzag Elliott Wave structure. From that peak, wave A concluded at $4,214.14, followed by a wave B rally that reached $4,770.92. Ethereum then turned lower in wave C, which is developing as an impulse Elliott Wave structure. Within wave C, wave ((i)) ended at $4,429.03, and the subsequent rally in wave ((ii)) peaked at $4,649.37.
The cryptocurrency has since extended lower in wave ((iii)), hitting $4,074.40, with wave ((iv)) concluding at $4,208.33. Currently, wave ((v)) is underway and appears mature, suggesting it could end soon. As long as the pivot at $4,770.92 remains intact, further downside is possible. The target for wave C can be calculated using the 100% to 161.8% Fibonacci extension of wave A, measured from the August 24, 2025 peak. This projects a range of $3,553.64 to $4,013.04. Once Ethereum reaches this zone, it could reverse higher or at least rally in three waves. Traders should monitor this area for potential buying opportunities, as it may signal the end of the current corrective phase and the start of a new upward move.
Ethereum (ETHUSD) – 60 Minute Elliott Wave Technical Chart:
ETHUSD – Elliott Wave Technical Video:
https://www.youtube.com/watch?v=CzKld6QJ4Ic
USD/JPY Accelerates Higher – Can Bulls Maintain Momentum?
Key Highlights
- USD/JPY cleared hurdles near 148.50 and surged over 150 pips.
- The pair could now face resistance near 150.00 on the 4-hour chart.
- EUR/USD trimmed gains and dipped below 1.1720.
- Bitcoin and Ethereum extended losses and remain at risk of additional downside.
USD/JPY Technical Analysis
The US Dollar remained strong above 146.50 against the Japanese Yen. USD/JPY jumped above 147.50 and 148.00 to set the pace for a fresh surge.
Looking at the 4-hour chart, the pair cleared a major declining channel with resistance at 147.50 to start the current surge. It settled above the 148.50 level, the 100 simple moving average (red, 4-hour), and the 200 simple moving average (green, 4-hour).
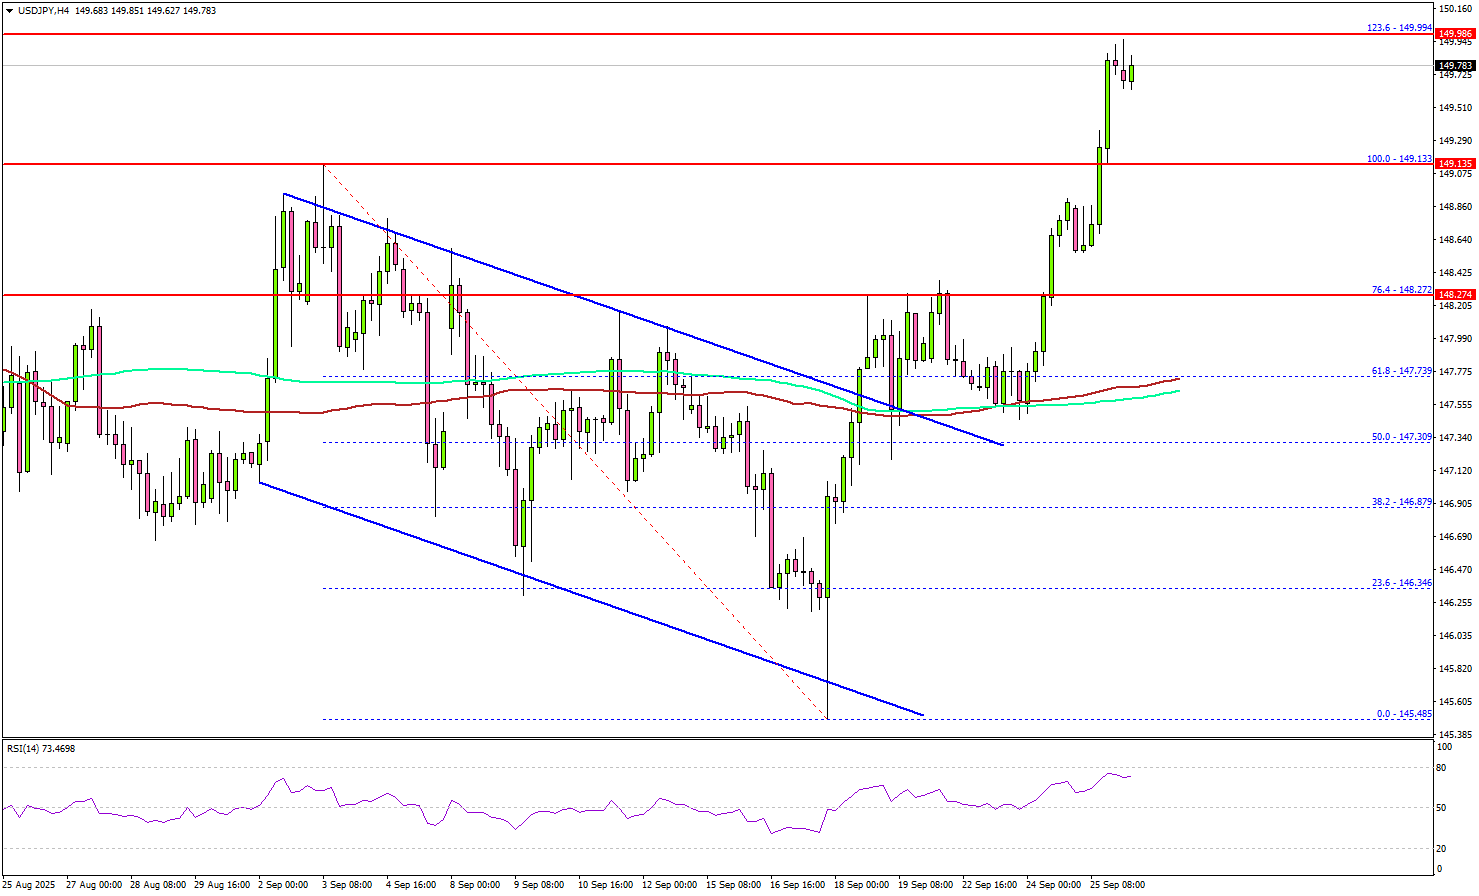
The pair even cleared the 149.13 high, opening the doors for more gains. On the upside, the pair could face resistance near the 149.80 level.
The first major hurdle for the bulls could be 150.00 since it coincides with the 1.236 Fib extension level of the downward move from the 149.13 swing high to the 145.48 low. A close above 150.00 could set the pace for another rally.
In the stated case, the pair could rise toward 151.40, above which the bulls could aim for a move toward 152.00. Any more upsides could send the pair toward 152.50.
On the downside, there is a key support at 148.80. The next area of interest might be 148.50. The main support could be 148.20. Any more losses might increase selling pressure and send USD/JPY toward 147.75 and the 100 simple moving average (red, 4-hour).
Looking at EUR/USD, the pair failed to stay above 1.1780 and extended losses below the key support at 1.1720.
Upcoming Key Economic Events:
- US Personal Income for August 2025 (MoM) - Forecast +0.3%, versus +0.4% previous.
- US Core Personal Consumption Expenditure for August 2025 (MoM) - Forecast +0.2%, versus +0.3% previous.
Tokyo CPI core stays at 2.5% in September, core-core slows
Tokyo inflation came in softer than expected in September, with core CPI (ex-fresh food) unchanged at 2.5% yoy versus forecasts of 2.8% yoy. The moderation was largely attributed to measures by the metropolitan government, including cuts to childcare fees and water charges, easing some of the burden from rising living costs.
Core-core inflation, stripping out fresh food and energy, slowed sharply from 3.0% yoy to 2.5% yoy, while headline CPI was also steady at 2.5% yoy. Food inflation excluding fresh items cooled to 6.9% yoy from 7.4% yoy, highlighting a broadening slowdown in price pressures.
The weaker data may give the BoJ some breathing room, though markets still price another 25bps hike in the months ahead. Opinion remains divided on whether policymakers act as soon as October or hold off until January.
Fed’s Goolsbee cautions against front-loading cuts, Daly favors gradual approach
Speaking overnight, Chicago Fed President Austan Goolsbee noted he is “somewhat uneasy” with front-loading too many rate cuts based solely on slowing payroll growth. With inflation above 2% for nearly five years and moving “the wrong way,” he warned that simply assuming price pressures are transitory is a risky strategy.
Separately, San Francisco Fed President Mary Daly reiterated that further easing will likely be needed but emphasized a measured pace. She argued that cutting “a little bit more over time” while reassessing incoming data is the safer way to balance the Fed’s dual mandate.
Daly cautioned that moving too quickly could risk undermining either employment or price stability. A gradual approach, she said, allows the central bank to “actually get to a good achievement” by avoiding overcorrections.