Sample Category Title
The Weekly Bottom Line: Canada’s Call to Diversify
Canadian Highlights
- Canada is likely to avoid a technical recession, with July GDP showing a rebound from the second quarter’s contraction and Q3 growth tracking in line with our forecast.
- July’s payroll report showed job vacancies slipping further, signaling a weaker hiring appetite and supporting our expectation for the unemployment rate to rise.
- Below-trend growth and softer labour demand point to enough slack in the economy to justify another Bank of Canada cut in October.
U.S. Highlights
- With the House and Senate unable to pass a continuing resolution and both chambers on recess until next week, a government shutdown looks increasingly likely on October 1st.
- President Trump announced new tariffs on pharmaceuticals, furniture and heavy trucks on Thursday, all effective October 1st. However, exemptions on pharmaceutical tariffs likely mean most drugs will remain duty free.
- Data out this week suggest the U.S. economy is faring considerably better than previously thought, but the softening labor market remains a concern for the Fed.
Canada – Canada’s Call to Diversify
Macro data took a back seat for much of the week, until the GDP report landed on Friday. Earlier, the spotlight was on central bankers and policymakers at the UN General Assembly. Both Prime Minister Carney and Governor Macklem warned of tectonic shifts reshaping the global economy, urging Canada to diversify trade and reduce our reliance on the U.S. Macklem went further, cautioning that tariffs have already hit trade-sensitive industries hard and put the economy on a permanently lower growth path. The latest data offered some encouragement – growth was supported by export-oriented industries. But it also underscored just how much work remains to make trade diversification a lasting driver of resilience.
Markets, meanwhile, stayed focused on near-term signals. Equity investors were uncertain early in the week, and the TSX Composite looked set to snap a seven-week winning streak. But late strength pushed the index marginally higher, extending gains by 0.1% on the week. Long-term yields climbed, ending nearly eight basis points above where they stood after the Bank of Canada’s September 17th cut.
The hard numbers showed an economy stabilizing after the second quarter’s trade shock. GDP expanded 0.2% in July, with the advance reading for August suggesting no growth. If September holds steady, Canada would avoid a technical recession, with Q3 growth tracking at an annualized 0.7%—right in line with our forecast. That’s still below-trend growth and reflects stabilization rather than renewed contraction.
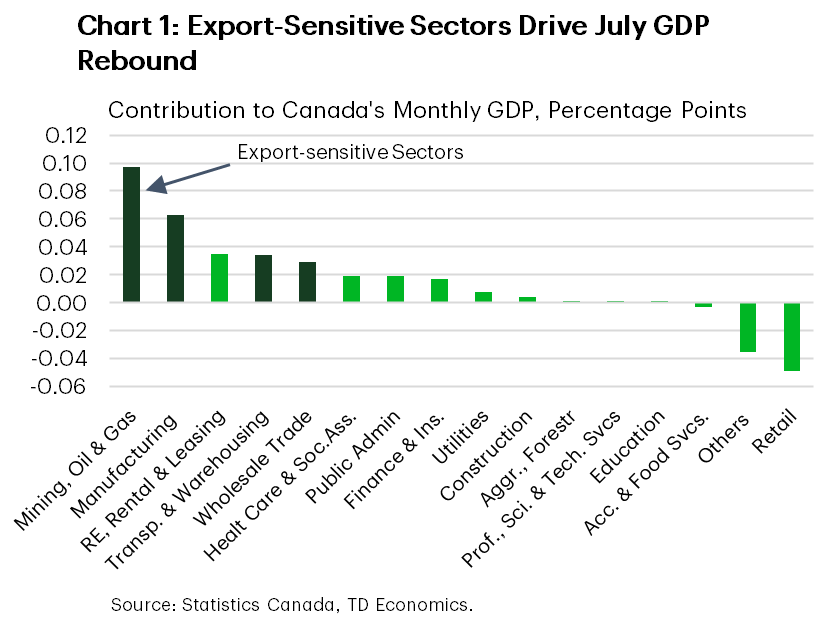
Encouragingly, the rebound was led by industries hardest hit by falling exports: mining, oil and gas, manufacturing, transportation, and wholesale trade (Chart 1). Transportation, in particular, saw a boost from activity tied to the LNG Canada project in Kitimat, built to ship natural gas to Asia rather than south of the border. This underscores how diversification beyond the U.S. can generate tangible growth benefits. The performance of these sectors also highlights their importance and how vulnerable Canada remains when they turn.
Still, July wasn’t all positive. Retail trade and information and cultural services contracted. Retail weakness echoed last week’s report that pointed to a likely August rebound, but the bigger picture suggests consumers are starting to ease off after driving much of domestic demand this year.
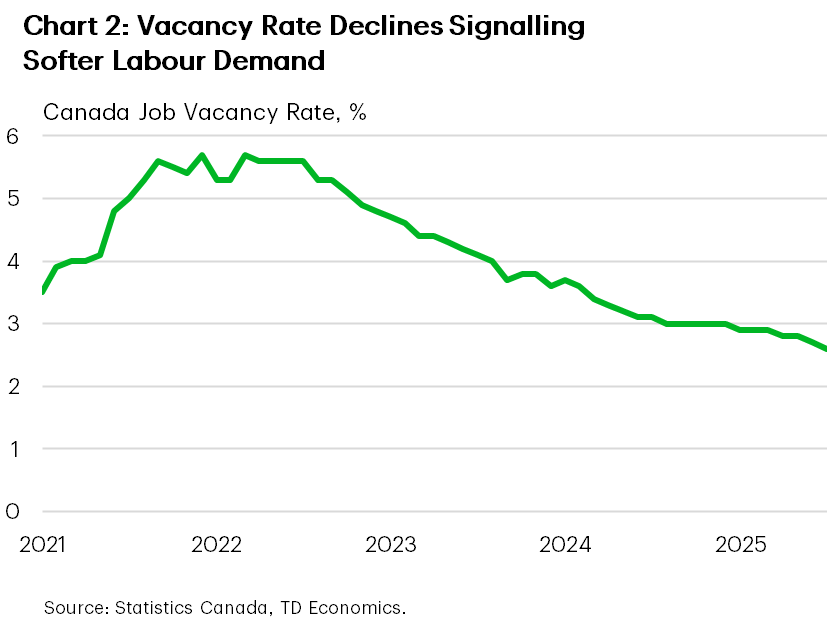
The cooling labour market is part of that story. July’s payroll report showed job vacancies slipping to 2.6% of total labour demand – the lowest since early 2017 (Chart 2). This signals a weaker hiring appetite, underlying our expectation for unemployment to rise to 7.3% by year-end.
Below-trend growth and softer labour demand point to enough slack in the economy to justify another Bank of Canada cut in October. As this week’s tariff announcements and tough CUSMA negotiations remind us, monetary policy can buy time. Turning rupture into opportunity will ultimately depend on the government’s ability to reorient the economy toward more diversified and sustainable growth.
U.S. – Economy Finds Renewed Strength
Numerous Fed speeches, a looming government shutdown, and a handful of new tariff announcements made for a busy week. Chair Powell’s remarks on Tuesday were parsed for any hints surrounding the Fed’s next move. However, Powell stuck to the script, reiterating the challenging environment faced by policymakers due to rising inflation and a weakening labor market. But fears of a softening economy were lessened this week, following an upward revision to Q2 GDP, a healthy read on August personal income & spending and a sharp drop in jobless claims. Meanwhile, President Trump’s announcement on Thursday evening to impose a 100% tariff on pharmaceuticals, 25% on heavy trucks, and 50% on furniture did little to jar markets. The S&P 500 is trading slightly higher on Friday morning but looks to end the week 0.6% lower.
In recent years, the threat of a government shutdown has become a regular occurrence marking the beginning of each new fiscal year. This year appears to be no different. House Republicans passed a ‘clean’ continuing resolution (CR) on September 19th that would have funded the government through November 21st. However, the bill failed to garner the 60-vote majority required to pass the Senate. Meanwhile, Senate Democrats put forward a separate CR, which came with several provisions, including a permanent extension to the expiring expansions of the Affordable Care Act subsidy. The bill had no chance of passing the Senate, but was meant to serve as a stake in the ground from which Democrats hoped to negotiate. However, this all backfired on Tuesday when President Trump cancelled his meeting with top Democratic leaders. With both the House and Senate on recess until next week, odds now heavily favor a government shutdown come October 1st.
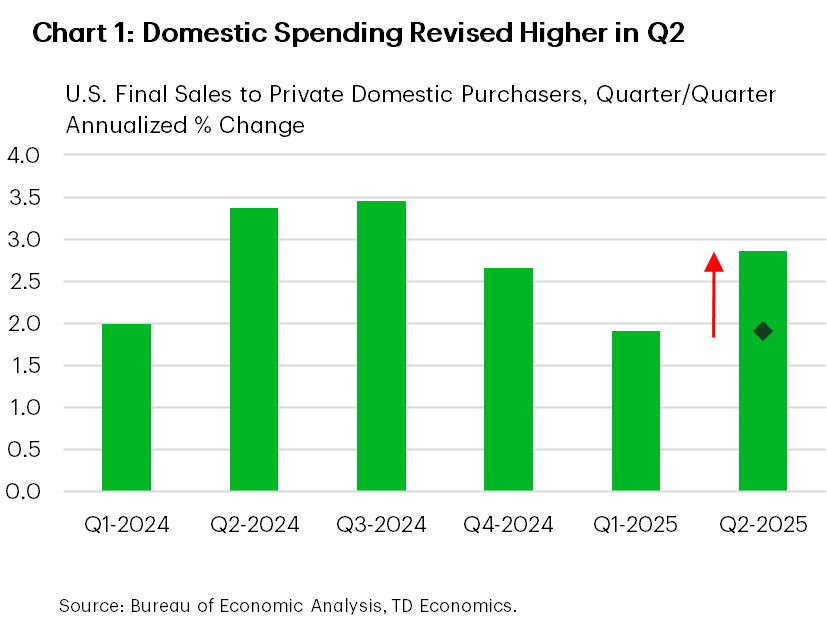
Turning to the economic data, the third revision to Q2 GDP showed a notable upgrade to growth (3.8% from 3.3%). Nearly all the additional strength came from consumer spending on services (2.6% from 1.2%) and business investment (7.3% from 5.7%). As a result, final sales to private domestic purchasers – our best gauge of underlying demand – was revised to 2.9% (from 1.9%), suggesting a more resilient economy (Chart 1).
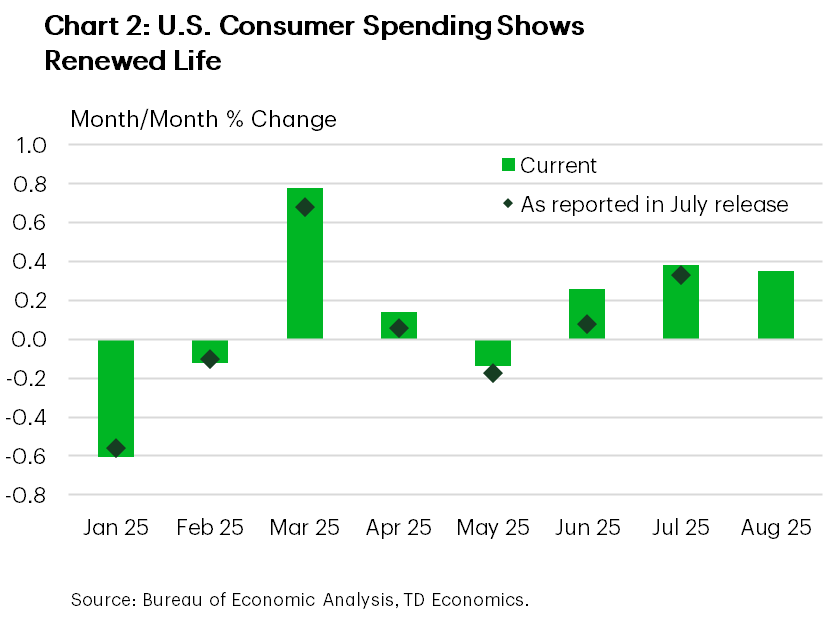
Encouragingly, the new-found momentum looks to have carried into Q3. Personal spending for August advanced 0.35% m/m (Chart 2), while income growth also remained healthy. Elsewhere, durable goods orders – a leading indicator of CAPEX – also came in on the hotter side. After incorporating this week’s data, our Q3 GDP tracking is now north of 3%.
But even with the renewed strength, the labor market remains an ongoing concern for the Fed. Higher frequency data on jobless claims and job openings suggest conditions have stabilized in the ‘low hire, low fire’ environment, but next week’s payrolls report will be key in shaping the Fed’s next move. However, a government shutdown would delay its release, leaving both policymakers and market participants in the dark.
Weekly Economic & Financial Commentary: A Fresh Pair of Legs?
Summary
United States: A Fresh Pair of Legs?
- Surprising data releases this week suggest the economy has stronger momentum than previously thought. The consumer continues to show remarkable resilience, and economic growth is respectable heading into the third quarter. However, while this week's data certainly inject a bit of optimism into our assessment of current conditions, the economy is still facing notable headwinds, including rising inflation and a weakening labor market.
- Next week: Construction Spending (Wed.), ISM Manufacturing & Services (Wed. & Fri.), Employment (Fri.)
International: Uneven Momentum, Global Adjustments
- Eurozone September PMIs painted a mixed picture, with manufacturing activity weakening and services showing modest improvement. In the U.K., PMI readings disappointed across the board. On the monetary policy front, Sweden delivered a hawkish rate cut, Mexico opted for a cut with risks tilted toward further easing and Switzerland held policy rates steady.
- Next week: China PMIs (Tue.), Japan Tankan Survey (Wed.), Eurozone CPI (Wed.)
Credit Market Insights: Household Sentiment Slips
- Last week, the Federal Reserve Bank of New York released the Survey for Consumer Expectations for August. Overall, households have had a divided outlook on the economy.
Topic of the Week: Near-Term Global Outlook Still Clouded, but Horizon Is Brightening
- We explore how some of the growth dynamics facing the United States are similarly facing many other systemically important economic regions across the world.
Forward Guidance: U.S. Payrolls Take Centre Stage as Central Banks Weigh Impact of Trade War
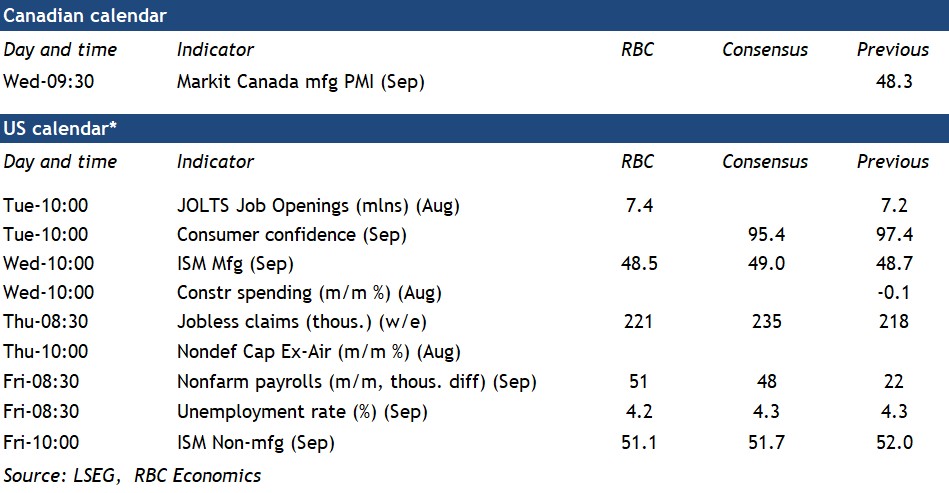
A quiet week for Canadian economic data releases will leave focus on the external backdrop, particularly U.S. labour markets in Friday’s payroll employment report (as well as potential backward revisions.) The data is set for a release on Friday October 3rd – although that release could be delayed if a looming government shutdown on October 1st is not avoided.
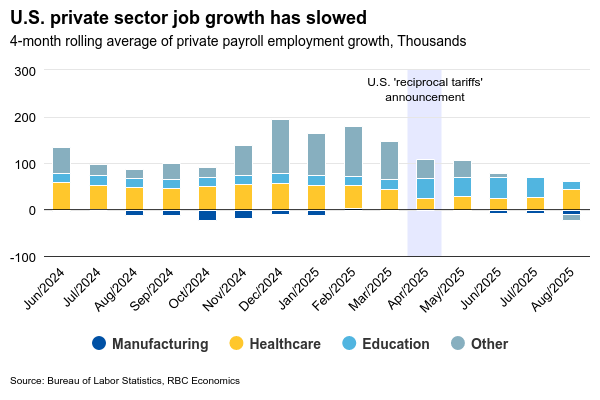
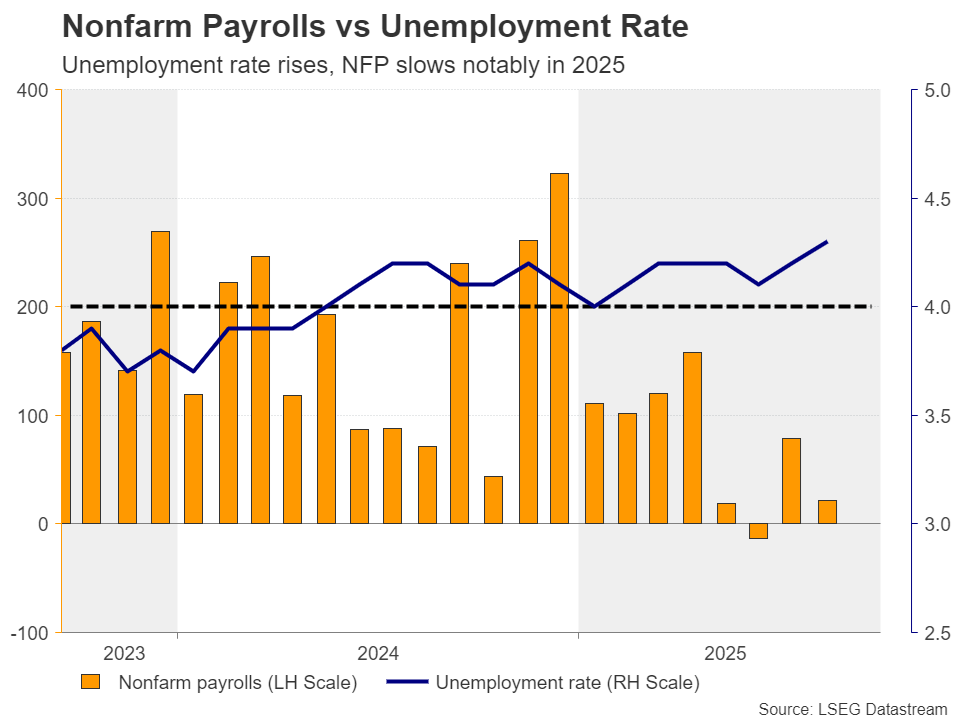
U.S. labour markets have been showing strain from increased trade frictions – employment growth has essentially stalled since "liberation day" in April. While the unemployment rate remained relatively low at 4.3% in August, it has increased over the past two months.
To be sure, part of the softening in employment growth reflects structural trends like stricter immigration policies and an aging population. But the 39,000 average monthly increase in private sector jobs from May to August still marks the slowest four-month growth period since the global financial crisis, excluding the 2020 pandemic lockdowns.
Manufacturing—the sector most exposed to trade headwinds and where cross-border integration with Canada is closest—has led the softening. Jobs in the sector have declined by an average of 11,000 per month since April, with offsets coming largely from persistent expansion in healthcare employment. In September, we expect these trends to broadly continue, with a modest 51k increase in payrolls and the unemployment rate remaining practically unchanged at 4.2%.
Canada’s own monthly labour market report will follow a week after U.S. payrolls. While Canada has largely avoided direct U.S. tariffs through CUSMA-compliant free trade, it remains vulnerable to spillover effects from a contracting U.S. industrial sector due to tightly integrated supply chains.
The Canadian economic backdrop has already softened, with a 1.6% decline in gross domestic product in Q2 and a rise in the unemployment rate over the summer, prompting the Bank of Canada to cut interest rates in September. Still, early Q3 economic indicators have looked better, including an 0.2% rebound in July GDP alongside higher manufacturing production.
The uncertain trade environment has made central banks highly data dependent. Following September rate cuts from both the BoC and the Fed, policymakers will be watching closely for additional signs of economic softening as they weigh their next decisions on Oct. 29th.
Week ahead data watch:
Summary 9/29 – 10/3
Monday, Sep 29, 2025
| GMT | Ccy | Events | Consensus | Previous |
|---|---|---|---|---|
| 08:30 | GBP | M4 Money Supply M/M Aug | 0.20% | 0.10% |
| 08:30 | GBP | Mortgage Approvals Aug | 65K | 65K |
| 09:00 | EUR | Eurozone Economic Sentiment Indicator Sep | 95.2 | |
| 09:00 | EUR | Eurozone Industrial Confidence Sep | -10.3 | |
| 09:00 | EUR | Eurozone Services Sentiment Sep | 3.6 | |
| 09:00 | EUR | Eurozone Consumer Confidence Sep F | -14.9 | -14.9 |
| 14:00 | USD | Pending Homeles M/M Aug | 0.10% | -0.40% |
| 23:50 | JPY | BoJ Summary of Opinions | ||
| 23:50 | JPY | Industrial Production M/M Aug P | -0.80% | -1.20% |
| 23:50 | JPY | Retail Trade Y/Y Aug | 1.00% | 0.30% |
| GMT | Ccy | Events | |
|---|---|---|---|
| 08:30 | GBP | M4 Money Supply M/M Aug | |
| Forecast: 0.20% | Previous: 0.10% | ||
| 08:30 | GBP | Mortgage Approvals Aug | |
| Forecast: 65K | Previous: 65K | ||
| 09:00 | EUR | Eurozone Economic Sentiment Indicator Sep | |
| Forecast: | Previous: 95.2 | ||
| 09:00 | EUR | Eurozone Industrial Confidence Sep | |
| Forecast: | Previous: -10.3 | ||
| 09:00 | EUR | Eurozone Services Sentiment Sep | |
| Forecast: | Previous: 3.6 | ||
| 09:00 | EUR | Eurozone Consumer Confidence Sep F | |
| Forecast: -14.9 | Previous: -14.9 | ||
| 14:00 | USD | Pending Homeles M/M Aug | |
| Forecast: 0.10% | Previous: -0.40% | ||
| 23:50 | JPY | BoJ Summary of Opinions | |
| Forecast: | Previous: | ||
| 23:50 | JPY | Industrial Production M/M Aug P | |
| Forecast: -0.80% | Previous: -1.20% | ||
| 23:50 | JPY | Retail Trade Y/Y Aug | |
| Forecast: 1.00% | Previous: 0.30% | ||
Tuesday, Sep 30, 2025
| GMT | Ccy | Events | Consensus | Previous |
|---|---|---|---|---|
| 00:00 | NZD | ANZ Business Confidence Sep | 49.7 | |
| 00:00 | NZD | ANZ Activity Outlook Sep | 38.7 | |
| 01:30 | AUD | Building Permits M/M Aug | 2.70% | -8.20% |
| 01:30 | AUD | Private Sector Credit M/M Aug | 0.60% | 0.70% |
| 01:30 | CNY | NBS Manufacturing PMI Sep | 49.6 | 49.4 |
| 01:30 | CNY | NBS Non-Manufacturing PMI Sep | 50.3 | 50.3 |
| 01:45 | CNY | RatingDog Manufacturing PMI Sep | 50.3 | 50.5 |
| 01:45 | CNY | RatingDog Services PMI Sep | 52.3 | 53.0 |
| 04:30 | AUD | RBA Interest Rate Decision | 3.60% | 3.60% |
| 05:00 | JPY | Housing Starts Y/Y Aug | -4.80% | -9.70% |
| 05:00 | JPY | Construction Orders Y/Y Aug | -19% | |
| 05:30 | AUD | RBA Press Conference | ||
| 06:00 | EUR | Germany Import Price Index M/M Aug | -0.20% | -0.40% |
| 06:00 | EUR | Germany Retail Sales M/M Aug | 0.60% | -1.50% |
| 06:00 | GBP | GDP Q/Q Q2 F | 0.30% | 0.30% |
| 06:00 | GBP | Current Account (GBP) Q2 | -25.2B | -23.5B |
| 06:45 | EUR | France Consumer Spending M/M Aug | 0.30% | -0.30% |
| 07:00 | CHF | KOF Economic Barometer Sep | 97.3 | 97.4 |
| 07:55 | EUR | Germany Unemployment Change Aug | 9K | -9K |
| 07:55 | EUR | Germany Unemployment RateAug | 6.30% | 6.30% |
| 12:00 | EUR | Germany CPI M/M Sep P | 0.10% | 0.10% |
| 12:00 | EUR | Germany CPI Y/Y Sep P | 2.20% | 2.20% |
| 13:00 | USD | Housing Price Index M/M Jul | 0.10% | -0.20% |
| 13:00 | USD | S&P/CS Composite-20 HPI Y/Y Jul | 2.30% | 2.10% |
| 13:45 | USD | Chicago PMI Sep | 43.2 | 41.5 |
| 14:00 | USD | Consumer Confidence Sep | 95.9 | 97.4 |
| 21:45 | NZD | Building Permits M/M Aug | 5.40% | |
| 23:50 | JPY | Tankan Large Manufacturing Index Q3 | 14 | 13 |
| 23:50 | JPY | Tankan Large Manufacturing Outlook Q3 | 13 | 12 |
| 23:50 | JPY | Tankan Non - Manufacturing Index Q3 | 33 | 34 |
| 23:50 | JPY | Tankan Non - Manufacturing Outlook Q3 | 29 | 27 |
| 23:50 | JPY | Tankan Large All Industry Capex Q3 | 11.50% |
| GMT | Ccy | Events | |
|---|---|---|---|
| 00:00 | NZD | ANZ Business Confidence Sep | |
| Forecast: | Previous: 49.7 | ||
| 00:00 | NZD | ANZ Activity Outlook Sep | |
| Forecast: | Previous: 38.7 | ||
| 01:30 | AUD | Building Permits M/M Aug | |
| Forecast: 2.70% | Previous: -8.20% | ||
| 01:30 | AUD | Private Sector Credit M/M Aug | |
| Forecast: 0.60% | Previous: 0.70% | ||
| 01:30 | CNY | NBS Manufacturing PMI Sep | |
| Forecast: 49.6 | Previous: 49.4 | ||
| 01:30 | CNY | NBS Non-Manufacturing PMI Sep | |
| Forecast: 50.3 | Previous: 50.3 | ||
| 01:45 | CNY | RatingDog Manufacturing PMI Sep | |
| Forecast: 50.3 | Previous: 50.5 | ||
| 01:45 | CNY | RatingDog Services PMI Sep | |
| Forecast: 52.3 | Previous: 53.0 | ||
| 04:30 | AUD | RBA Interest Rate Decision | |
| Forecast: 3.60% | Previous: 3.60% | ||
| 05:00 | JPY | Housing Starts Y/Y Aug | |
| Forecast: -4.80% | Previous: -9.70% | ||
| 05:00 | JPY | Construction Orders Y/Y Aug | |
| Forecast: | Previous: -19% | ||
| 05:30 | AUD | RBA Press Conference | |
| Forecast: | Previous: | ||
| 06:00 | EUR | Germany Import Price Index M/M Aug | |
| Forecast: -0.20% | Previous: -0.40% | ||
| 06:00 | EUR | Germany Retail Sales M/M Aug | |
| Forecast: 0.60% | Previous: -1.50% | ||
| 06:00 | GBP | GDP Q/Q Q2 F | |
| Forecast: 0.30% | Previous: 0.30% | ||
| 06:00 | GBP | Current Account (GBP) Q2 | |
| Forecast: -25.2B | Previous: -23.5B | ||
| 06:45 | EUR | France Consumer Spending M/M Aug | |
| Forecast: 0.30% | Previous: -0.30% | ||
| 07:00 | CHF | KOF Economic Barometer Sep | |
| Forecast: 97.3 | Previous: 97.4 | ||
| 07:55 | EUR | Germany Unemployment Change Aug | |
| Forecast: 9K | Previous: -9K | ||
| 07:55 | EUR | Germany Unemployment RateAug | |
| Forecast: 6.30% | Previous: 6.30% | ||
| 12:00 | EUR | Germany CPI M/M Sep P | |
| Forecast: 0.10% | Previous: 0.10% | ||
| 12:00 | EUR | Germany CPI Y/Y Sep P | |
| Forecast: 2.20% | Previous: 2.20% | ||
| 13:00 | USD | Housing Price Index M/M Jul | |
| Forecast: 0.10% | Previous: -0.20% | ||
| 13:00 | USD | S&P/CS Composite-20 HPI Y/Y Jul | |
| Forecast: 2.30% | Previous: 2.10% | ||
| 13:45 | USD | Chicago PMI Sep | |
| Forecast: 43.2 | Previous: 41.5 | ||
| 14:00 | USD | Consumer Confidence Sep | |
| Forecast: 95.9 | Previous: 97.4 | ||
| 21:45 | NZD | Building Permits M/M Aug | |
| Forecast: | Previous: 5.40% | ||
| 23:50 | JPY | Tankan Large Manufacturing Index Q3 | |
| Forecast: 14 | Previous: 13 | ||
| 23:50 | JPY | Tankan Large Manufacturing Outlook Q3 | |
| Forecast: 13 | Previous: 12 | ||
| 23:50 | JPY | Tankan Non - Manufacturing Index Q3 | |
| Forecast: 33 | Previous: 34 | ||
| 23:50 | JPY | Tankan Non - Manufacturing Outlook Q3 | |
| Forecast: 29 | Previous: 27 | ||
| 23:50 | JPY | Tankan Large All Industry Capex Q3 | |
| Forecast: | Previous: 11.50% | ||
Wednesday, Oct 1, 2025
| GMT | Ccy | Events | Consensus | Previous |
|---|---|---|---|---|
| 00:30 | JPY | Manufacturing PMI Sep F | 48.4 | 48.4 |
| 06:30 | CHF | Real Retail Sales Y/Y Aug | 0.50% | 0.70% |
| 07:30 | CHF | Manufacturing PMI Sep | 47.7 | 49 |
| 07:50 | EUR | France Manufacturing PMI Sep F | 48.1 | 48.1 |
| 07:55 | EUR | Germany Manufacturing PMI Sep F | 48.5 | 48.5 |
| 08:00 | EUR | Eurozone Manufacturing PMI Sep F | 49.5 | 49.5 |
| 08:30 | GBP | Manufacturing PMI Sep F | 46.2 | 46.2 |
| 09:00 | EUR | Eurozone CPI Y/Y Sep P | 2.20% | 2.00% |
| 09:00 | EUR | Eurozone Core CPI Y/Y Sep P | 2.30% | 2.30% |
| 12:15 | USD | ADP Employment Change Sep | 50K | 54K |
| 13:30 | CAD | Manufacturing PMI Sep | 48.3 | |
| 13:45 | USD | Manufacturing PMI Sep F | 52 | 52 |
| 14:00 | USD | ISM Manufacturing PMI Sep | 49.2 | 48.7 |
| 14:00 | USD | ISM Manufacturing Prices Paid Sep | 64.5 | 63.7 |
| 14:00 | USD | ISM Manufacturing Employment Index Sep | 43.8 | |
| 14:00 | USD | Construction Spending M/M Aug | -0.10% | -0.10% |
| 14:30 | USD | Crude Oil Inventories (Sep 26) | -0.6M | |
| 17:30 | CAD | BoC Summary of Deliberations | ||
| 23:50 | JPY | Monetary Base Y/Y Sep | -4.10% |
| GMT | Ccy | Events | |
|---|---|---|---|
| 00:30 | JPY | Manufacturing PMI Sep F | |
| Forecast: 48.4 | Previous: 48.4 | ||
| 06:30 | CHF | Real Retail Sales Y/Y Aug | |
| Forecast: 0.50% | Previous: 0.70% | ||
| 07:30 | CHF | Manufacturing PMI Sep | |
| Forecast: 47.7 | Previous: 49 | ||
| 07:50 | EUR | France Manufacturing PMI Sep F | |
| Forecast: 48.1 | Previous: 48.1 | ||
| 07:55 | EUR | Germany Manufacturing PMI Sep F | |
| Forecast: 48.5 | Previous: 48.5 | ||
| 08:00 | EUR | Eurozone Manufacturing PMI Sep F | |
| Forecast: 49.5 | Previous: 49.5 | ||
| 08:30 | GBP | Manufacturing PMI Sep F | |
| Forecast: 46.2 | Previous: 46.2 | ||
| 09:00 | EUR | Eurozone CPI Y/Y Sep P | |
| Forecast: 2.20% | Previous: 2.00% | ||
| 09:00 | EUR | Eurozone Core CPI Y/Y Sep P | |
| Forecast: 2.30% | Previous: 2.30% | ||
| 12:15 | USD | ADP Employment Change Sep | |
| Forecast: 50K | Previous: 54K | ||
| 13:30 | CAD | Manufacturing PMI Sep | |
| Forecast: | Previous: 48.3 | ||
| 13:45 | USD | Manufacturing PMI Sep F | |
| Forecast: 52 | Previous: 52 | ||
| 14:00 | USD | ISM Manufacturing PMI Sep | |
| Forecast: 49.2 | Previous: 48.7 | ||
| 14:00 | USD | ISM Manufacturing Prices Paid Sep | |
| Forecast: 64.5 | Previous: 63.7 | ||
| 14:00 | USD | ISM Manufacturing Employment Index Sep | |
| Forecast: | Previous: 43.8 | ||
| 14:00 | USD | Construction Spending M/M Aug | |
| Forecast: -0.10% | Previous: -0.10% | ||
| 14:30 | USD | Crude Oil Inventories (Sep 26) | |
| Forecast: | Previous: -0.6M | ||
| 17:30 | CAD | BoC Summary of Deliberations | |
| Forecast: | Previous: | ||
| 23:50 | JPY | Monetary Base Y/Y Sep | |
| Forecast: | Previous: -4.10% | ||
Thursday, Oct 2, 2025
| GMT | Ccy | Events | Consensus | Previous |
|---|---|---|---|---|
| 01:30 | AUD | Trade Balance (AUD) Aug | 6.50B | 7.31B |
| 05:00 | JPY | Consumer Confidence Index Sep | 35.2 | 34.9 |
| 06:30 | CHF | CPI M/M Sep | 0.10% | -0.10% |
| 06:30 | CHF | CPI Y/Y Sep | 0.30% | 0.20% |
| 09:00 | EUR | Eurozone Unemployment Rate Aug | 6.20% | 6.20% |
| 11:30 | USD | Challenger Job Cuts Y/Y Sep | 13.30% | |
| 12:30 | USD | Initial Jobless Claims (Sep 26) | 215K | 218K |
| 14:00 | USD | Factory Orders M/M Aug | 0.10% | -1.30% |
| 14:30 | USD | Natural Gas Storage (Sep 26) | 75B | |
| 23:30 | JPY | Unemployment Rate Aug | 2.40% | 2.30% |
| GMT | Ccy | Events | |
|---|---|---|---|
| 01:30 | AUD | Trade Balance (AUD) Aug | |
| Forecast: 6.50B | Previous: 7.31B | ||
| 05:00 | JPY | Consumer Confidence Index Sep | |
| Forecast: 35.2 | Previous: 34.9 | ||
| 06:30 | CHF | CPI M/M Sep | |
| Forecast: 0.10% | Previous: -0.10% | ||
| 06:30 | CHF | CPI Y/Y Sep | |
| Forecast: 0.30% | Previous: 0.20% | ||
| 09:00 | EUR | Eurozone Unemployment Rate Aug | |
| Forecast: 6.20% | Previous: 6.20% | ||
| 11:30 | USD | Challenger Job Cuts Y/Y Sep | |
| Forecast: | Previous: 13.30% | ||
| 12:30 | USD | Initial Jobless Claims (Sep 26) | |
| Forecast: 215K | Previous: 218K | ||
| 14:00 | USD | Factory Orders M/M Aug | |
| Forecast: 0.10% | Previous: -1.30% | ||
| 14:30 | USD | Natural Gas Storage (Sep 26) | |
| Forecast: | Previous: 75B | ||
| 23:30 | JPY | Unemployment Rate Aug | |
| Forecast: 2.40% | Previous: 2.30% | ||
Friday, Oct 3, 2025
| GMT | Ccy | Events | Consensus | Previous |
|---|---|---|---|---|
| 00:30 | JPY | Services PMI Sep F | 53 | 53 |
| 06:45 | EUR | France Industrial Output M/M Aug | 0.30% | -1.10% |
| 07:50 | EUR | France Services PMI Sep F | 48.9 | 48.9 |
| 07:55 | EUR | Germany Services PMI Sep F | 52.5 | 52.5 |
| 08:00 | EUR | Eurozone Services PMI Sep F | 51.4 | 51.4 |
| 08:30 | GBP | Services PMI Sep F | 51.9 | 51.9 |
| 09:00 | EUR | Eurozone PPI M/M Aug | 0.00% | 0.40% |
| 09:00 | EUR | Eurozone PPI Y/Y Aug | 0.20% | |
| 12:30 | USD | Nonfarm Payrolls Sep | 50K | 22K |
| 12:30 | USD | Unemployment Rate Sep | 4.30% | 4.30% |
| 12:30 | USD | Average Hourly Earnings M/M Sep | 0.30% | 0.30% |
| 13:45 | USD | Services PMI Sep F | 53.9 | 53.9 |
| 14:00 | USD | ISM Services PMI Sep | 52 | 52 |
| GMT | Ccy | Events | |
|---|---|---|---|
| 00:30 | JPY | Services PMI Sep F | |
| Forecast: 53 | Previous: 53 | ||
| 06:45 | EUR | France Industrial Output M/M Aug | |
| Forecast: 0.30% | Previous: -1.10% | ||
| 07:50 | EUR | France Services PMI Sep F | |
| Forecast: 48.9 | Previous: 48.9 | ||
| 07:55 | EUR | Germany Services PMI Sep F | |
| Forecast: 52.5 | Previous: 52.5 | ||
| 08:00 | EUR | Eurozone Services PMI Sep F | |
| Forecast: 51.4 | Previous: 51.4 | ||
| 08:30 | GBP | Services PMI Sep F | |
| Forecast: 51.9 | Previous: 51.9 | ||
| 09:00 | EUR | Eurozone PPI M/M Aug | |
| Forecast: 0.00% | Previous: 0.40% | ||
| 09:00 | EUR | Eurozone PPI Y/Y Aug | |
| Forecast: | Previous: 0.20% | ||
| 12:30 | USD | Nonfarm Payrolls Sep | |
| Forecast: 50K | Previous: 22K | ||
| 12:30 | USD | Unemployment Rate Sep | |
| Forecast: 4.30% | Previous: 4.30% | ||
| 12:30 | USD | Average Hourly Earnings M/M Sep | |
| Forecast: 0.30% | Previous: 0.30% | ||
| 13:45 | USD | Services PMI Sep F | |
| Forecast: 53.9 | Previous: 53.9 | ||
| 14:00 | USD | ISM Services PMI Sep | |
| Forecast: 52 | Previous: 52 | ||
Week Ahead – ISM PMIs and NFP Report to Shake Fed Rate Bets
- Dollar traders eagerly await ISM PMIs and US jobs report.
- RBA to remain on hold, focus to fall on forward guidance.
- Eurozone CPI data could revive ECB rate cut bets.
- Yen traders may scrutinize the BoJ Summary of Opinions.
Powell helps Dollar to extend post-Fed gains
The US dollar stayed relatively strong this week as investors continued to digest the less-dovish-than-expected Fed. Although the new dot plot suggested that policymakers agree with the market on two more rate cuts this year, the median dot for 2026 pointed to only one additional quarter-point reduction, with the market remaining convinced that three more cuts may be required next year.
That said, investors decided to somewhat scale back their bets after Fed Chair Powell struck a cautious tone on Tuesday, saying that the Fed needs to continue balancing the competing risks of high inflation and a weakening job market in coming decisions.
Indeed, the risks of high inflation did not disappear. After all, the Organization for Economic Cooperation and Development (OECD) noted this week that the full impact of tariff hikes is still unfolding. What is also justifying Powell’s view is that, despite the weakening labor market, the Fed’s own projections showed optimism for the forecast horizon, while economic activity remains solid, with the Atlanta Fed GDPNow model forecasting a 3.3% growth for Q3.
ISM PMIs and NFP to challenge investors’ dovish bets
With all that in mind, next week, dollar traders may lock their gaze on the ISM manufacturing and non-manufacturing PMIs for September, due out on Wednesday and Friday, respectively, but the highlight is likely to be the US jobs report for the same month due out on Friday as well.
The preliminary S&P Global PMIs revealed some weakness in business activity, which if confirmed by the ISM figures, could add some credence to the market view that more than one rate cut may be required next year. However, most of the reshaping in the implied path could be motivated by the nonfarm payrolls.
The last couple of reports came in well below market expectations, while there have been strong downside revisions to prior months as well. Overall, the trend in employment growth points to a significant slowdown and investors will be eager to find out whether this continued in September. Another weak print could prompt traders to sell their dollars again as it will confirm their dovish rate outlook, but equities are unlikely to cheer the prospect of lower borrowing costs. They could pull back on concerns about the broader economic outlook. The opposite reactions may be true if the data surprises to the upside.
Ahead of the employment data, market participants may also want to hear from several Fed officials, including Vice Chair Jefferson, New York President Williams, Atlanta President Bostic, Chicago President Goolsbe, and Dallas President Logan. The ADP private employment report on Wednesday could provide an early glimpse of how the labor market performed during September.
Dovish RBA could weigh on the Aussie
Although China will be closed from Wednesday onwards in celebration of their National Day, aussie traders will not have an easy week as the RBA decides on monetary policy on Tuesday, with China’s official PMIs scheduled to be released a few hours earlier.
The latest RBA decision was back on August 12, when policymakers cut interest rates by 25bps, citing a substantial cooling of inflation. Their updated economic projections suggested that underlying inflation will continue to moderate, and that interest rates will stay in a gradual easing path.
That said, since then, the unemployment rate declined to 4.2% in July and stayed there in August, and most importantly the monthly CPI y/y rate surged to 2.8% in July from 1.9% and rose even further to 3.0% in August. This encouraged market participants to push back expectations of the next quarter-point reduction, fully pricing it in for February 2026. For this meeting there is only a 7% chance of a cut, with the remaining 93% pointing to no action.
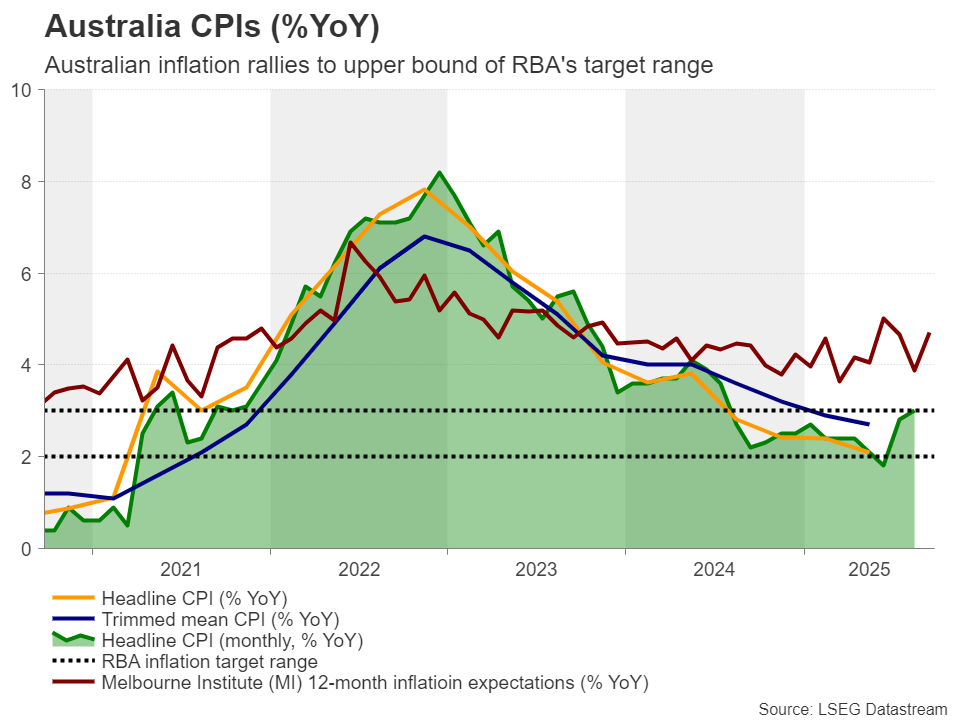
On Monday, Governor Bullock said that, since the August meeting, data have been in line or slightly stronger than their expectations, though the economic outlook continues to be clouded by uncertainty. “We need to be alert to the risk that circumstances may change and be prepared to respond, if necessary,” she added.
Therefore, if the statement echoes that message, investors may be tempted to bring forward the timing of when they expect the next rate cut, perhaps to December, or even November. Currently, the probability of a rate cut at the November gathering is resting at 40%. This could weigh on the aussie, especially if the Chinese PMIs reveal that the manufacturing sector of the world’s second largest economy and Australia’s main trading partner shrank for the sixth straight month.
Will the CPI spark speculation about an ECB “contingency cut”
Euro traders will have to digest the preliminary CPI data for September from Italy, France and Germany on Tuesday, and from the whole Eurozone on Wednesday.
The ECB kept interest rates unchanged at its latest meeting, maintaining a positive view on growth and inflation, while President Lagarde noted that the Bank is in a “good place”, with inflation being where they wanted it to be. The decision led investors to scale back their rate cut expectations, baking into the cake only a 35% probability of another 25bps rate reduction by June 2026. In other words, most investors believe that the ECB has completed its rate-cut cycle.
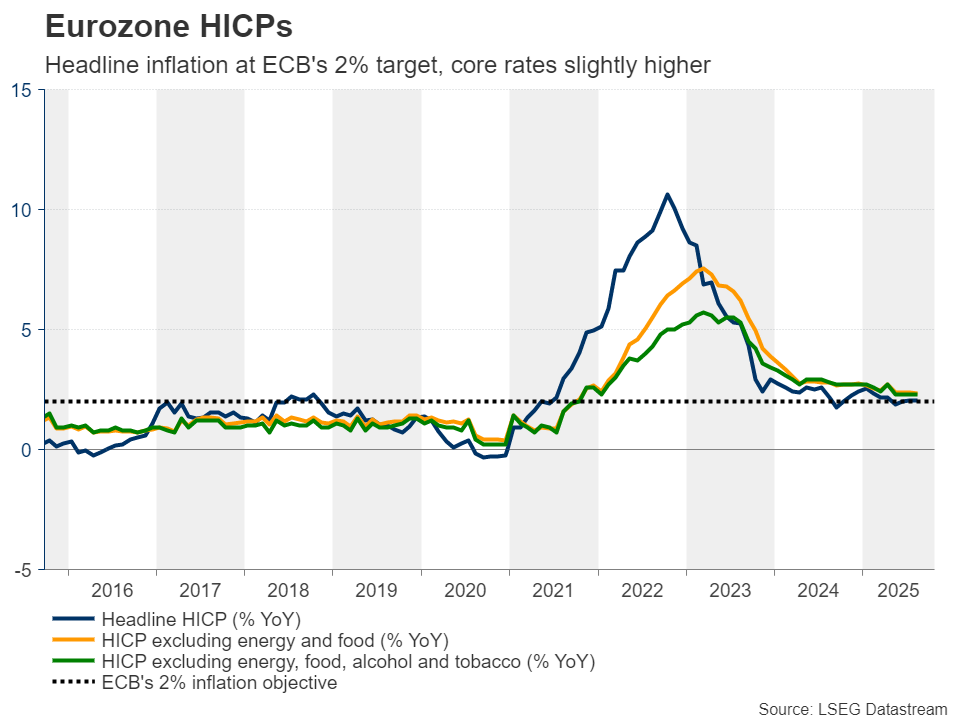
That said, ECB Vice President de Guindos recently said that they are closely monitoring the euro’s nominal effective exchange rate rather than just its levels against the US dollar. That effective exchange rate is hovering at a record high, up 27% over the past decade. This means that a stronger euro will not only cause inflation to undershoot the ECB’s target but also harm trade and the Euro-area economy.
Having all that in mind, further cooling in next week’s inflation data could increase the chances of a “contingency cut” by the ECB to protect the economy, something that could weigh on the common currency.
Will the summary of opinions confirm a hawkish BoJ?
The Bank of Japan appeared more hawkish than expected at its latest meeting, with two members voting in favour of a rate hike and Governor Ueda saying that if their economic forecasts materialise, they will continue to raise interest rates.
According to Japan’s Overnight Index Swaps (OIS) there is a strong 55% chance of a 25bps rate hike at the Bank’s upcoming decision, with the probability of that happening by the end of the year rising to around 80%. A hike is almost fully priced in for January.
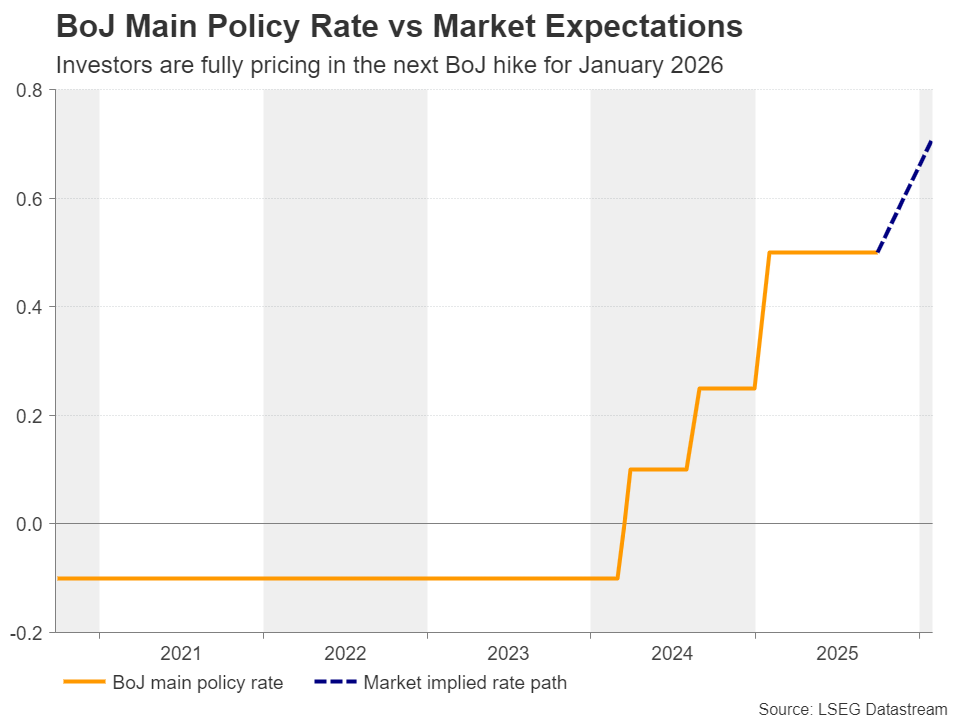
The Summary of Opinions on Monday may offer more clarity on how officials are planning to move forward. However, those awaiting a crystal-clear message may be disappointed. The Liberal Democratic Party (LDP) will hold an election on October 4 for PM Ishiba’s successor, a choice that could prove influential for monetary policy thereafter.
Thus, even if policymakers lean towards raising interest rates in coming months, a hike will not be set in stone. The yen failed to capitalize on the BoJ’s hawkishness, and even if it rebounds in the case of a hawkish Summary of Opinions, it is unlikely to recover all its recent losses. Some traders may remain sceptical that the Bank may proceed at a slower pace should Ishiba’s successor be seen as pro-monetary easing.
Weekly Focus – Yields Higher on Strong US Data
We are heading into a crucial week for markets and the Fed with key US labour market data coming up. It will culminate with the payrolls report on Friday but before that we get the JOLTS job openings data, ADP private employment and Challenger job cuts. With the Fed having a sharp focus on downside risks to employment following disappointing job growth in recent months, the data will be key for whether the Fed will decide to cut again already again next month or wait for the December meeting. We look for a relatively solid report, with nonfarm payrolls growth at +80k, average hourly earnings growth at +0.3% m/m and unemployment rate steady at 4.3%. Our baseline scenario is that the next Fed cut is in December, but it is a close call between October and December.
The past week showed some decent upside surprises on US data including the labour market, where the weekly initial jobless claims dropped back to 218k, which leaves it back at low levels after a spike higher in early September related to some regional distortions. Continuing claims, which is another gauge of unemployment, also declined adding to the move lower starting in mid-August. Of other positive surprises an upward revision to GDP for Q2 from 3.3% to 3.8% stood out as the revision was driven by a lift to private consumption growth from 1.7% to 2.5%. Core durable goods orders for August also surprised positively pointing to robust investment growth. Normally there is a good correlation between investments and employment as both represent changes to production capacity. On the softer side US Flash PMI for September disappointed slightly, although still pointing to decent growth. A decline in the PMI output price index dampened some of the concern over rising inflation due to tariffs.
PMI data in the euro zone was a bit mixed with manufacturing turning lower but services going higher. The German ifo expectations index disappointed slightly. So, it was a bit of a mixed bag but still in line with our scenario of softer growth in the second half followed by higher momentum again in 2026 as fiscal easing starts to kick in more.
Markets responded to the stronger US data by sending yields and the USD higher while equities were on the backfoot. After a strong run taking stocks into stretched territory on momentum, the correction lower is not big enough to question the bullish market, though.
Apart from the US labour market data mentioned above, a focus point next week will be a possible US government shutdown on Wednesday if Congress fails to pass the government funding bill by Tuesday, see Reading the Markets USD - Government shutdown risk is here again, 23 September. Euro Flash CPI for September (Wednesday) will put more light on whether inflation is still in line with ECB's 2% target. We expect headline inflation to increase to 2.3% y/y in September from 2.0% y/y but it is mostly due to base effects from last year and as we expect momentum in core inflation to be broadly unchanged and well behaved, it should not be interpreted too hawkishly. Other key things to look out for over the coming week will be LDP leadership election in Japan (Saturday), Tankan survey in Japan (Wednesday) and US ISM manufacturing index (Wednesday).
Silver Reaches April 2011 Levels: Is a New All-Time High Next?
Up 56% since the onset of 2025, Silver is putting on a performance unseen in more than 15 years.
The metal has finally broken out of the monthly upward channel that began in February 2020 during the Covid-era peak of fear and volatility, adding further fuel to the ongoing fire.
With prices stretching back into April 2011 territory, the question is no longer whether buyers have what it need to reach preceding highs, but what—if anything—can slow it down from here.
A piece published shortly after the FOMC had emitted the idea that the follow-up press conference hadn't expressed enough dovishness for metals to keep rising higher, amid some form of slowdown in the rally.
But that couldn't have been more wrong: Despite a Dollar rally, both Silver and Gold pushed to new yearly highs – $3,791 for the Bullion and still pushing further but $45,52 for now in XAG.
What we’re witnessing now is nothing short of a vertical leap, as Silver attempts to close the long-standing gap with Gold in terms of relative strength.
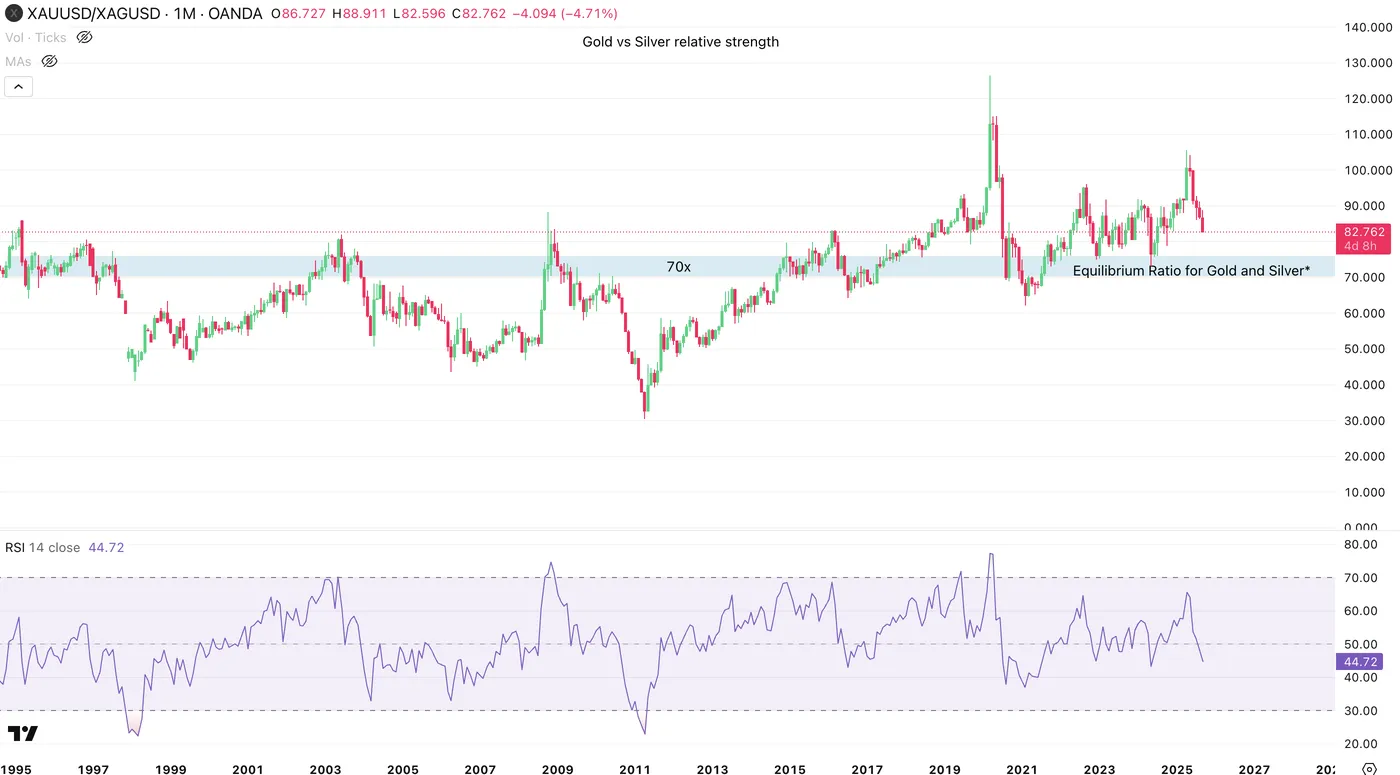
Gold/Silver ratio Monthly Chart, 26/09/2025 – Source: TradingView
Looking at 70x, which was a key pivot ratio in the metals since 1995 and assuming a $3,700 Gold price, Silver would be trading around $52.50.
That would also assume a continued rally for metals.
From how it looks, the ratio does seem to be converging after reaching 105x in April 2025.
Let's now dive into Multiple timeframes to spot where XAG could be going.
Weekly Chart
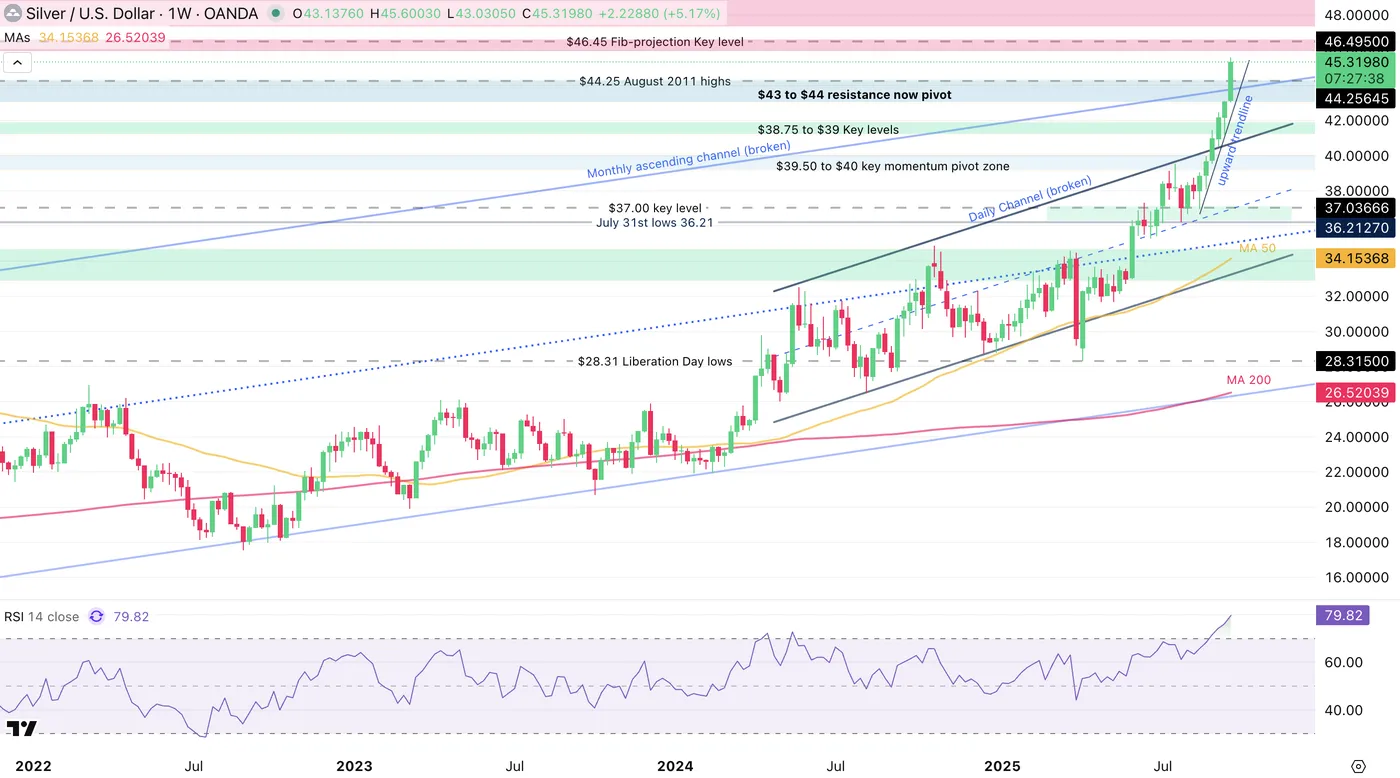
Silver Weekly Chart, September 26, 2025 – Source: TradingView
Taking a look to the weekly timeframe helps to see how strong the ongoing rally is – absolutely stellar.
The previous trough in the metal was in August 2022 when the global hike cycles peaked, at around $17.30 – Metals and in general non-yielding assets tend to underperform when rates are rising.
Since however, Silver is up 160% and still counting.
I'd like to put some emphasis on how important the Monthly Channel breakout could be for trend traders – Keep an eye on the ongoing parabolic move.
Silver 4H Chart and levels
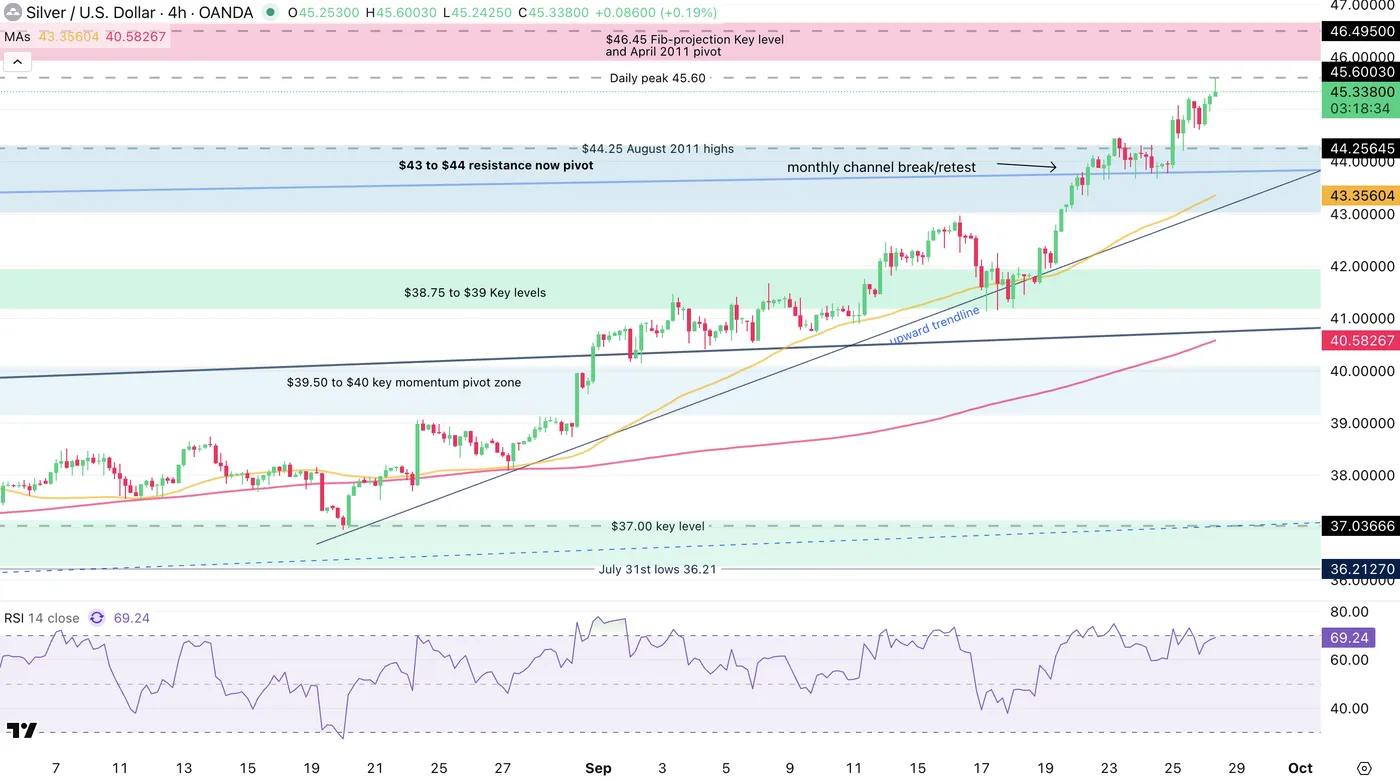
Silver 4H Chart, September 26, 2025 – Source: TradingView
Since August 20th which came right before Powell's Jackson Hole conference, the metal has been on a consistent uptrend, lifted by rate cut hopes and data going towards that direction, added with some momentum and tense geopolitcs.
The post-FOMC Friday push easily broke through the $44 resistance which now acts as a major pivot for momentum.
Trading above maintains the upward trajectory but any big correction below will also have to be kept in check.
There is some small profit-taking going on right now at $45.60 highs, but a $46.50 target could also be spotted when looking at Fibonacci-extensions.
Despite the ongoing rally, it could be important to watch how other metals (gold particularly) and the US Dollar perform looking forward, and also keep an eye on their correlation.
Levels to watch for Silver (XAG) trading:
Resistance Levels:
- Daily peak $45.60
- $46 to $46.45 Fib-projection Key level and April 2011 pivot
- $49.81 Current All-time highs also reached in April 2011
- $52.50 potential target
Support Levels:
- $43 to $44 resistance now pivot
- $42.00 to $42.00
- $38.75 to $39 Key levels
- 2012 Highs Support around 37.50
Safe Trades!
Sunset Market Commentary
Markets
August US PCE deflators printed bang in line with consensus. The headline PCE deflator rose by 0.3% M/M and 2.7% Y/Y (from 2.6%). The core PCE deflator increased by 0.2% M/M to stabilize at 2.9% Y/Y. Those numbers fit perfectly in last week’s Fed forecasts as well indicating no unwanted tariff-related inflation surprises for now. Personal income (0.4% m/m) and personal spending (0.6% m/m) numbers were slightly higher than expected and add to yesterday’s vibe that personal consumption is still supporting economic growth. US Treasuries and the dollar were unnerved by today’s figures. US yields lose around 1 bp across the curve while EUR/USD is treading water in the high 1.16-area. US equity futures embraced the goldilocks numbers. German Bunds outperform US Treasuries today, reversing yesterday’s losses without strong driver. The belly of the curve (-3.5 bps) outperforms the wings (-1/2 bps). EUR/GBP holds below the YtD top at 0.8769 ahead of the start (Sunday) of Labour’s annual conference next week. A YouGov projection showed that Labour would drop from 411 to 144 seats if parliamentary elections were held tomorrow. Nigel Farage’s Reform party would come out on top with 311 seats (in 650-seat Chamber).
Next week is a big one in terms of eco data with the only US labour market update (JOLTS Job openings, ADP employment change and payrolls) in between the Fed’s first rate cut since January (September 17) and its next gathering (October 29). The new reaction function of the Fed with more weight to the full employment part of the mandate implies that barring any unexpected huge upward surprises, the deal will be sealed for October (25 bps rate cut). US money market currently attach a 86% chance to such scenario. Visibility on October is one thing, but the Fed will still be navigating under cloudy skies for December. Between its October and December meetings, two monthly labour data series will be released, suggesting that volatility and uncertainty on the outcome of that meeting could be high until the very last moment. Apart from labour figures, monthly ISM surveys for manufacturing and services and consumer confidence will be released as well. At the end of the month (Tuesday), a deadline passes to avoid a US government shutdown. If such shutdown continues through the end of the week, the Bureau of Labor Statistics may have to postpone the release of the payrolls report. In Europe, national CPI numbers (September) will on Monday and on Tuesday set the tone for the EMU inflation figure to be published on Wednesday. The ECB’s firm policy stance (very comfortable at 2%) suggests limited impact from these numbers next week. If any, we see some asymmetric risks for a larger market reaction in case of an upward beat as some market participants still leave the door open for a final ECB rate cut lower somewhere over the next 12 months (33% probability).
News & Views
The ECB’s August consumer expectations survey showed the median rate of perceived inflation over the previous 12 months unchanged at 3.1% for the seventh consecutive month. However, consumers see inflation for the next 12 months at 2.8% from 2.6% in July. The index for 5 years ahead rose slightly (2.2% from 2.1%). While still near 2%, the latter was the highest observation since August 2022. EMU consumers expect nominal income growth (next 12 months) better at 1.1% (from 0.9%), while expectations for spending growth are unchanged (3.3%). Economic growth expectations for the next year are stable at 1.2%. Consumers sees the unemployment rate increasing to 10.7% (10.6% in July). Even so, they see the future unemployment rate to be only slightly higher than perceived current unemployment (10.1%), suggesting a broadly stable labour market outlook. Consumers expect the price of their home to increase by 3.4% over the next 12 months (3.3% in July). Expectations for mortgage rates stayed unchanged (4.5%), but the net percentage of households reporting a tightening (relative to those reporting an easing) of access to credit over the previous 12 months increased, as did the net percentage of households expecting tighter credit conditions over the next 12 months.
The September employment barometer of the German IFO Institute published today indicates companies are increasingly planning to deploy their activity with fewer staff. The index fell to 92.5, from 93.8 points in August, marking the lowest level since June 2020. The Head of Surveys at IFO analyses that “because the upturn has failed to materialize for the time being, many companies are applying the brakes on their headcount.” Job cuts for now tend to be gradual but vacancies are not being filled. The barometer has fallen slightly in industry as vehicle manufacturing and mechanical engineering in particular are planning fewer staff. The indicator fell noticeably at service providers as some companies in the transport and logistics sector have already announced layoffs. The number of employees is construction is stable while trade companies are reducing their workforce perceptibly.
US: Consumer Spending Improves in August, Core PCE Inflation Holds at Elevated Level
Consumer spending and income growth both improved at a solid pace in August. Personal income rose 0.4% month-over-month (m/m), the same as in the month prior. Growth in wages and salaries eased to 03% m/m from 0.5% in July, while government transfer payments rose at the same rate of 0.3% - an improvement from a flat print in the month prior.
Consumer spending grew 0.6% m/m in nominal terms, coming on the heels of 0.5% gains in the two months prior. With spending growing at a slightly faster clip than income, the personal savings rate eased to 4.6% in August from an upwardly revised 4.8% in July (previously 4.4%). The personal savings rate was revised higher between 2020 and 2025, with the last two years receiving an upgrade of 0.8 percentage point on average, compared to prior readings. The rate has been trending lower over the last four months.
Spending was up 0.3% m/m on an inflation-adjusted basis, down from a 0.4% gain in the month prior (previously 0.3%) and a notably upgraded 0.3% gain in June (previously 0.1%). Goods spending remained strong, advancing by 0.7% for the second month in a row. Real spending on durable goods rose by 0.9% m/m, while spending on non-durable goods rose at a slower but still decent clip (+0.5%). Meanwhile, services spending continued to edge up at 0.2% for the third month in a row.
Core PCE – the Fed's preferred inflation gauge – rose by 0.2% m/m on the month from a downwardly revised 0.2% in July. In annual terms, core PCE inflation rose to 2.9%, the same as in July, with the measure showing a very mild continued increase since April (2.6%).
Key Implications
Today's report should be viewed with yesterday's GDP and consumer spending revisions in mind. Consumer spending growth for Q2 was raised to 2.5% annualized from 1.6% previously, reflecting a stronger showing in services spending. Today's report, which shows real spending momentum remained healthy during the June to August period, builds on that positive momentum, leading to a notable upgrade in our tracking for consumer spending in the third quarter – now at around 3%, from 2% previously. Coupled with upward revisions to personal income and the savings rate, and a more recent pullback in initial jobless claims, the data suggests that the U.S. consumer is in somewhat better shape than previously thought.
The Fed's preferred inflation gauge remains above the Fed's comfort zone and has recorded a mild acceleration recently. With businesses likely to increasingly pass on tariff-related costs to consumers, the risk remains for inflation to increase further over the near-term. Overall, an improved growth trend and persistent inflation lean in favor of the Fed potentially having to do a little less in the way of rate cuts to support the economy. This may put some doubt on the interest rate path, though it does not derail the case for two more rate cuts by the end of this year.
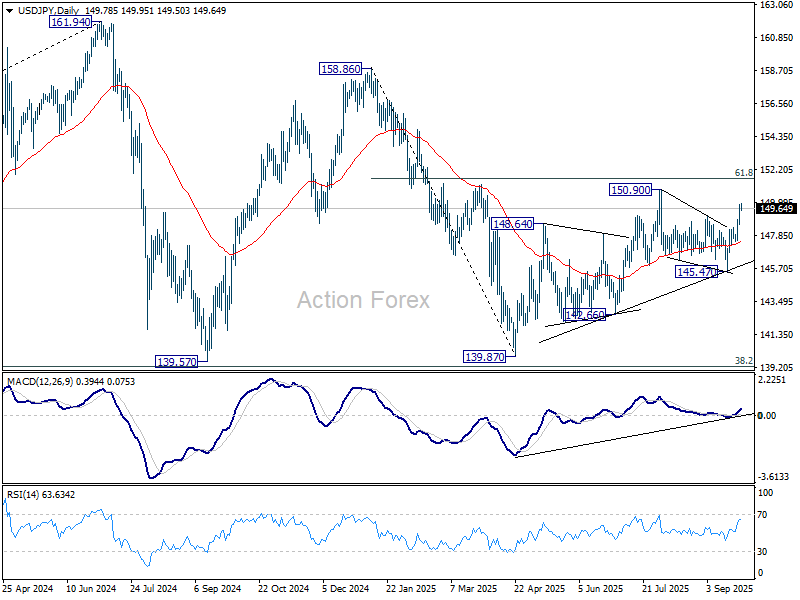
USD/JPY Daily Outlook
Daily Pivots: (S1) 148.93; (P) 149.43; (R1) 150.30; More...
Intraday bias in USD/JPY remains on the upside for the moment. Rise from 145.47 is in progress for retesting 150.90. Break there will resume whole rise from 139.87 to 151.22 fibonacci level. On the downside, below 148.55 minor support will turn intraday bias neutral first, before staging another rise.
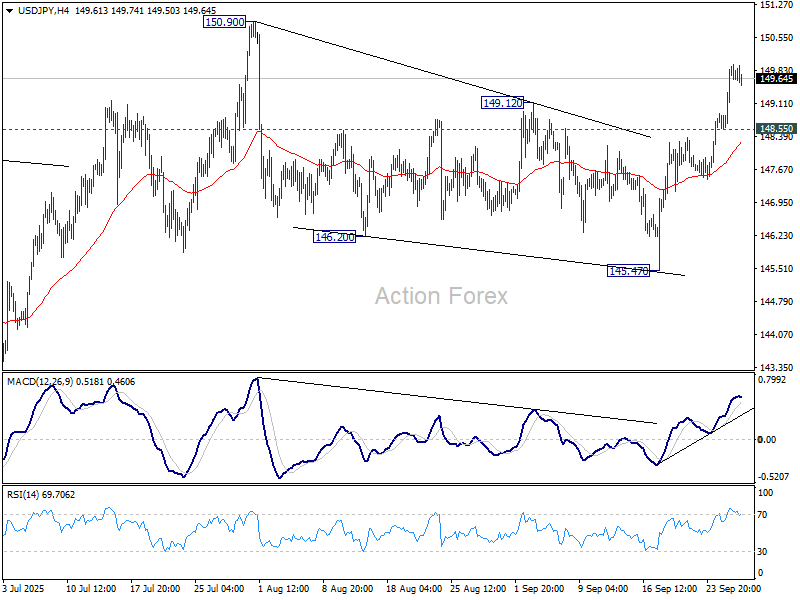
In the bigger picture, price actions from 161.94 (2024 high) are seen as a corrective pattern to rise from 102.58 (2021 low). Decisive break of 61.8% retracement of 158.86 to 139.87 at 151.22 will argue that it has already completed with three waves at 139.87. Larger up trend might then be ready to resume through 161.94 high. In case the corrective pattern extends with another fall, strong support is expected from 38.2% retracement of 102.58 to 161.94 at 139.26 to bring rebound.