
Sample Category Title
GBP/USD Weekly Outlook
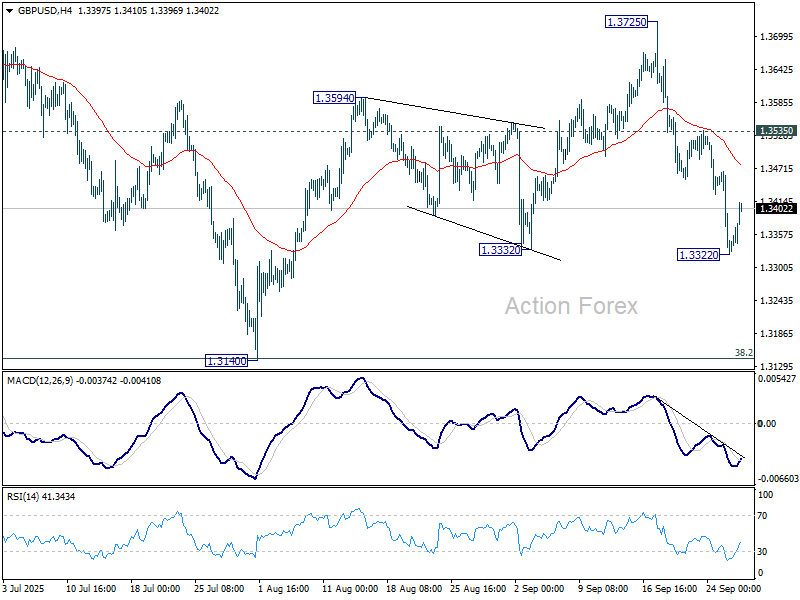
GBP/USD's fall from 1.3725 extended lower to 1.3322 last week and breached 1.3332 support, but then recovered. Initial bias is turned neutral for some consolidations first. But further decline is expected as long as 1.3535 resistance holds. Break of 1.3322 will resume the fall from 1.3725, as the third leg of the corrective pattern from 1.3787, and target 1.3140 support.
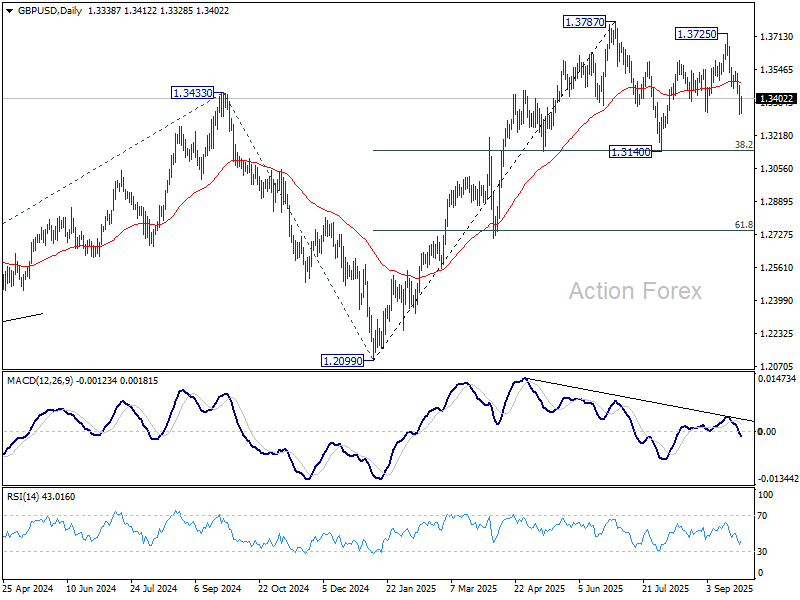
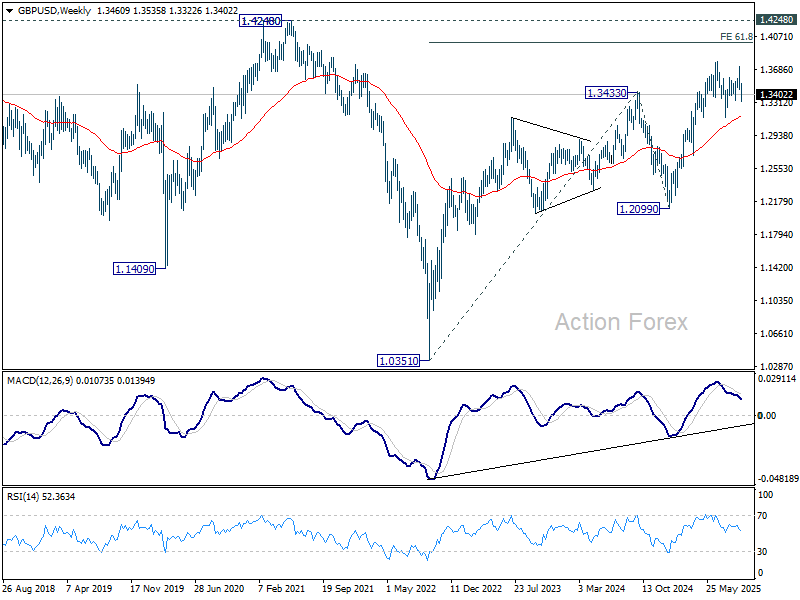
In the bigger picture, rise from 1.0351 (2022 low) is still seen as a corrective move. Further rally could be seen to 61.8% projection of 1.0351 to 1.3433 (2024 high) from 1.2099 (2025 low) at 1.4004. But strong resistance could be seen from 1.4248 (2021 high) to limit upside. Sustained break of 55 W EMA (now at 1.3155) will argue that a medium term top has already formed and bring deeper fall back to 1.2099.
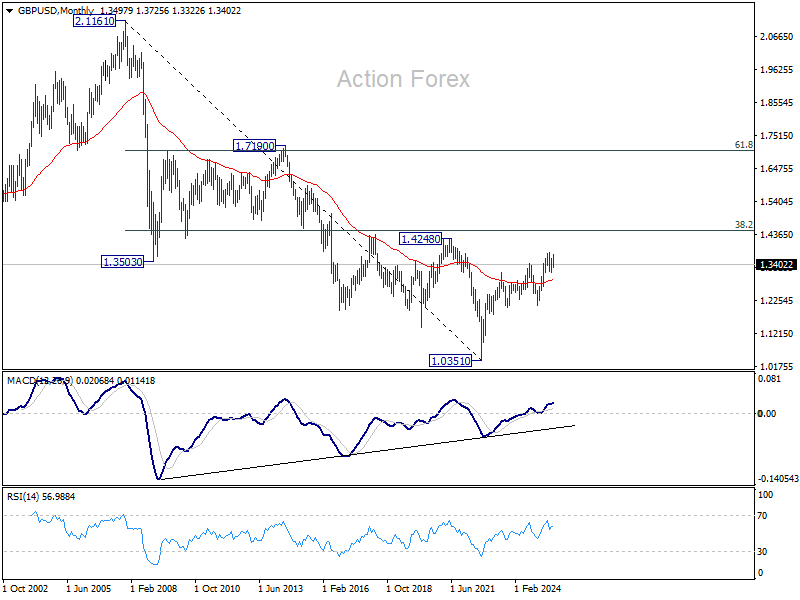
In the long term picture, as long as 1.4248/4480 resistance holds (38.2% retracement of 2.1161 to 1.0351 at 1.4480), the long term outlook will remain bearish. That is, price actions from 1.3051 are seen as a corrective pattern to the long term down trend from 2.1161 (2007 high) only. Nevertheless, decisive break of 1.4248/4480 will be a strong sign of long term bullish reversal.
USD/CHF Weekly Outlook
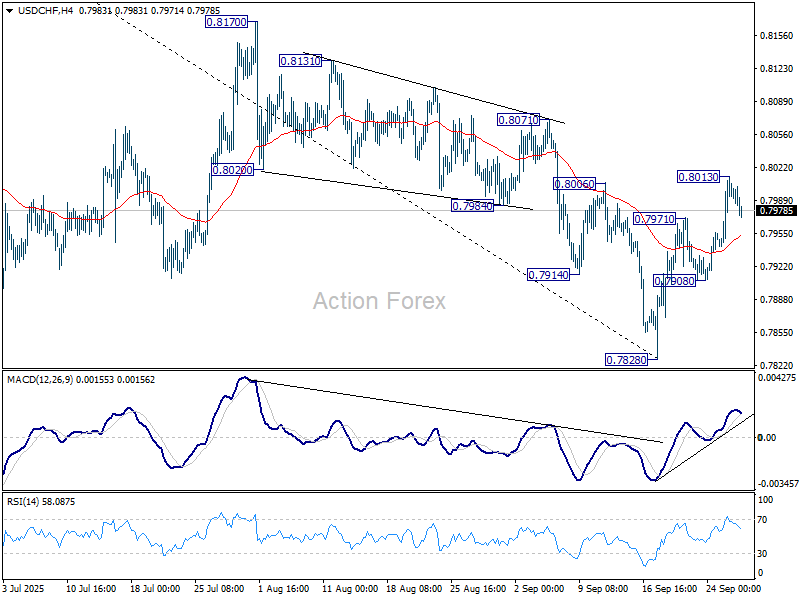
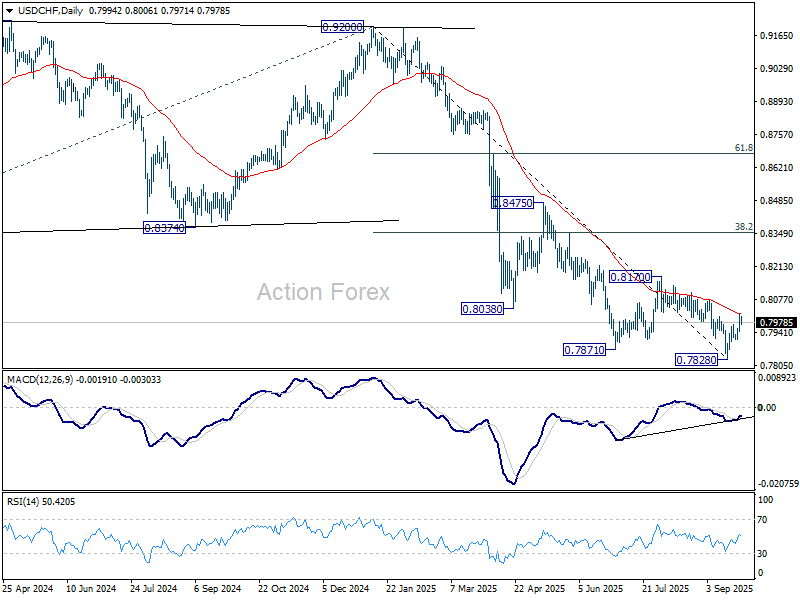
USD/CHF's rebound from 0.7828 short term bottom extended higher last week but lost momentum after hitting 0.8013. Initial bias is turned neutral this week first. On the upside, sustained trading above 55 D EMA (now at 0.8016) will suggest that rise from 0.7828 is already correcting whole fall from 0.9200. Further rise should the be seen to 0.8170 resistance and possibly above. However, break of 0.7908 will turn bias back to the downside for retesting 0.7828 low.
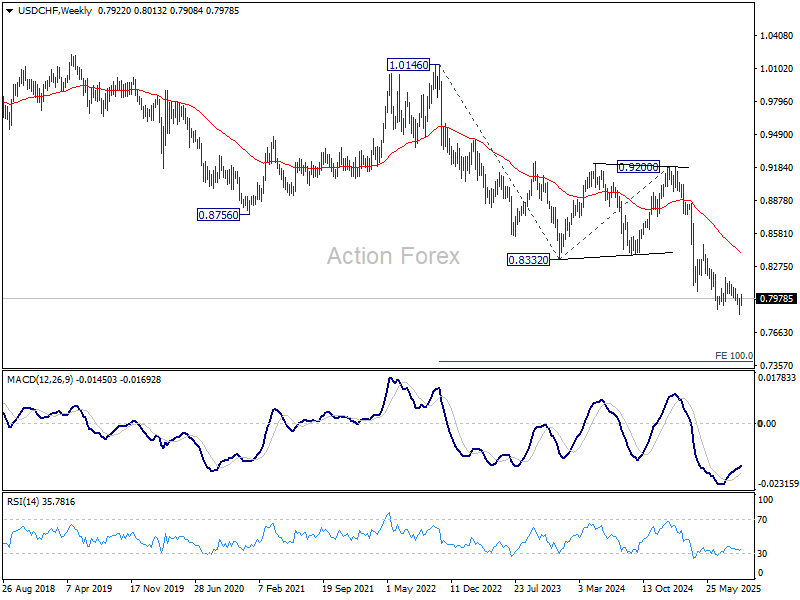
In the bigger picture, long term down trend from 1.0342 (2017 high) is still in progress. Next target is 100% projection of 1.0146 (2022 high) to 0.8332 from 0.9200 at 0.7382. In any case, outlook will stay bearish as long as 0.8332 support turned resistance holds (2023 low).
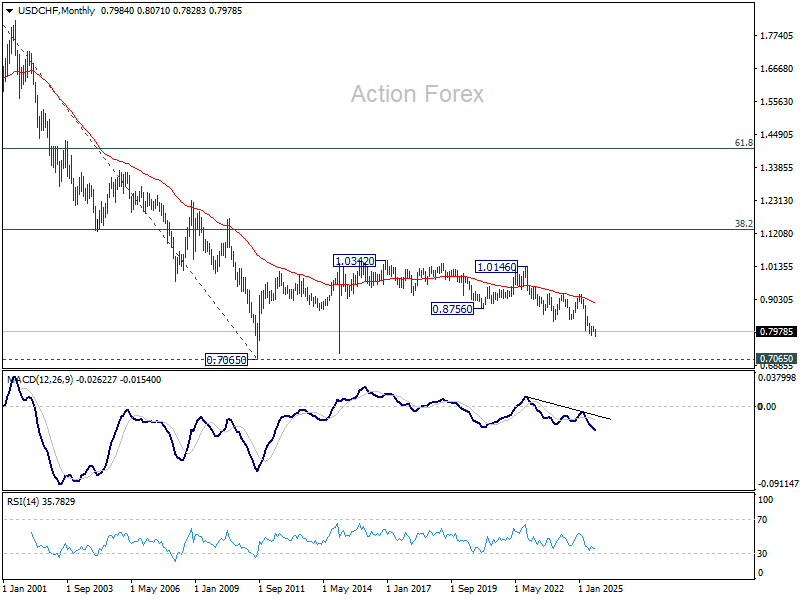
In the long term picture, price action from 0.7065 (2011 low) are seen as a corrective pattern to the multi-decade down trend from 1.8305 (2000 high). It's uncertain if the fall from 1.0342 is the second leg of the pattern, or resumption of the downtrend. But in either case, outlook will stay bearish as long as 0.8756 support turned resistance holds (2021 low). Retest of 0.7065 should be seen next.
AUD/USD Weekly Report
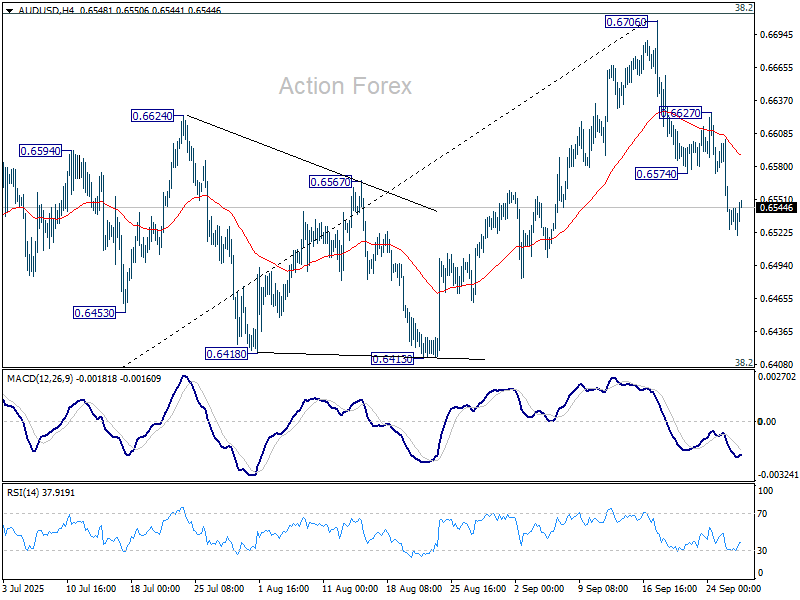
AUD/USD's fall from 0.6706 short term top continued last week and there is no sign of bottoming yet. Initial bias remains on the downside this week. Sustained trading below 55 D EMA (now at 0.6545) will confirm rejection by 0.6713 fibonacci resistance, and bring deeper fall to 0.6413 cluster support (38.2% retracement of 0.5913 to 0.6706 at 0.6403). On the upside, above 0.6574 support turned resistance will turn intraday bias neutral first. But risk will stay on the downside as long as 0.6627 resistance holds, in case of recovery.
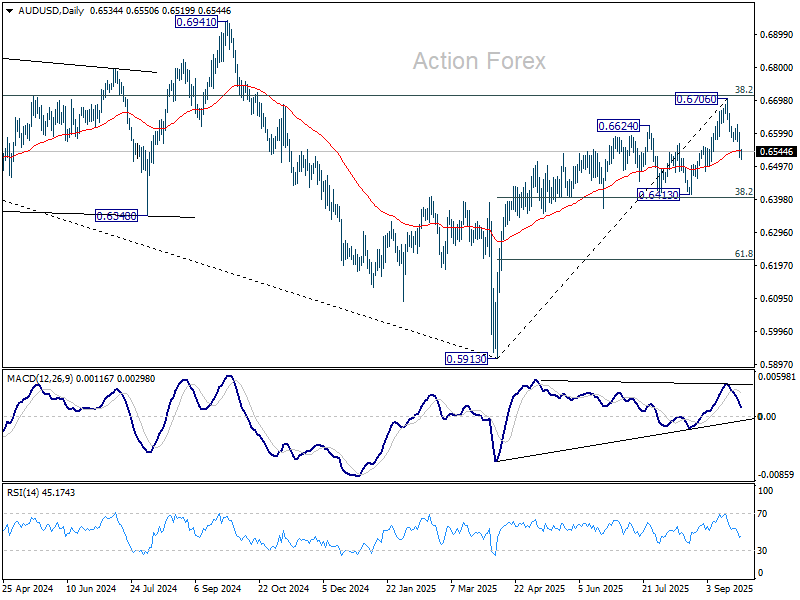
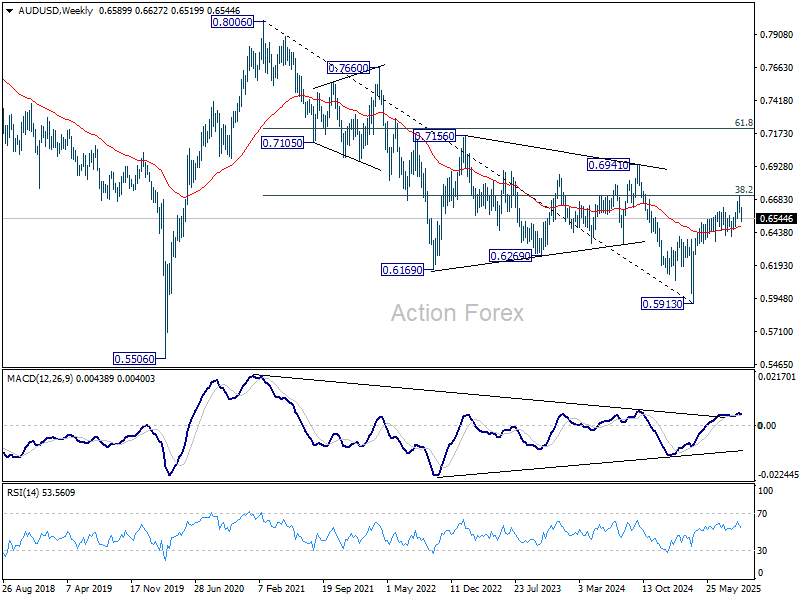
In the bigger picture, there is no clear sign that down trend from 0.8006 (2021 high) has completed. Rebound from 0.5913 is seen as a corrective move. Outlook will remain bearish as long as 38.2% retracement of 0.8006 to 0.5913 at 0.6713 holds. Nevertheless, considering bullish convergence condition in W MACD, sustained break of 0.6713 will be a strong sign of bullish trend reversal, and pave the way to 0.6941 structural resistance for confirmation.
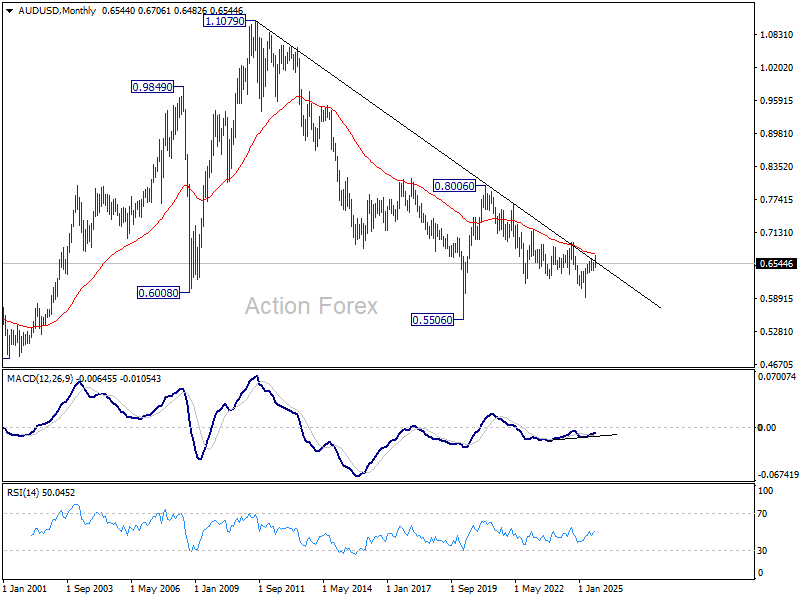
In the long term picture, fall from 0.8006 is seen as the second leg of the corrective pattern from 0.5506 long term bottom (2020 low). Hence, in case of deeper decline, strong support should emerge above 0.5506 to contain downside to bring reversal. On the upside, firm break of 0.6941 will argue that the third leg has already started back to 0.8006.
USD/CAD Weekly Outlook
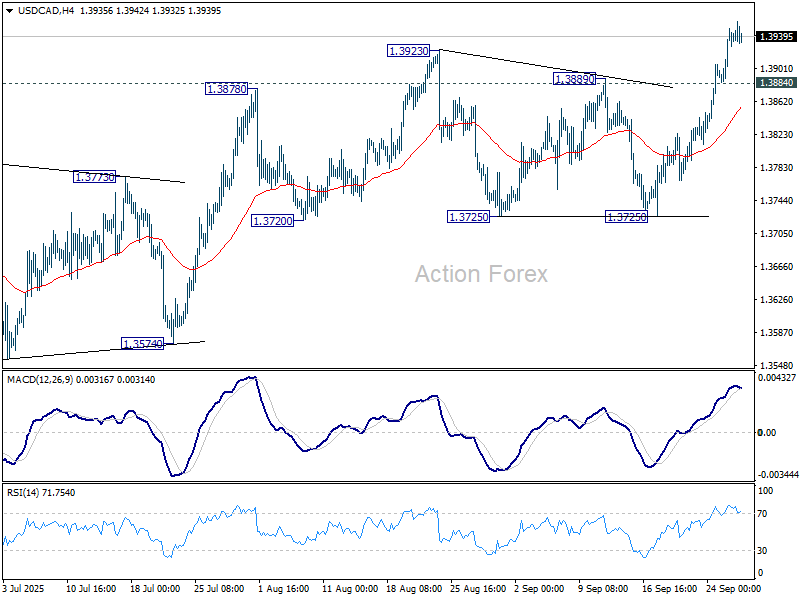
USD/CAD's rise from 1.3538 resumed by breaking through 1.3923 last week. Initial bias stays on the upside this week for 1.4014 cluster resistance. As this rally is still seen as a corrective move, upside should be limited by 1.4014 to bring reversal. On the downside, below 1.3884 minor support will turn intraday bias neutral first.
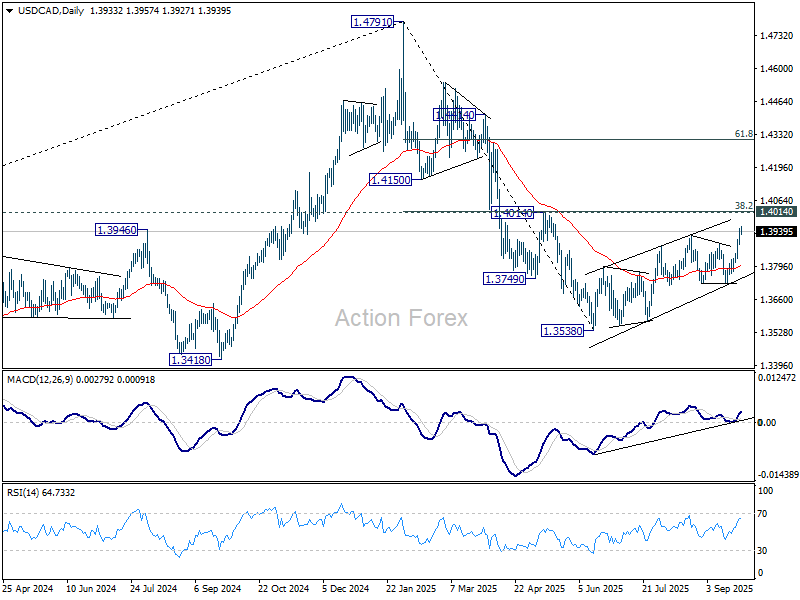
In the bigger picture, price actions from 1.4791 medium term top could either be a correction to rise from 1.2005 (2021 low), or trend reversal. In either case, further decline is expected as long as 1.4014 cluster resistance (38.2% retracement of 1.4791 to 1.3538 at 1.4017) holds. Next target is 61.8% retracement of 1.2005 (2021 low) to 1.4791 (2025 high) at 1.3069. However, sustained break of 1.4014 will argue that fall from 1.4791 has completed, and bring stronger rally to 61.8% retracement at 1.4312.
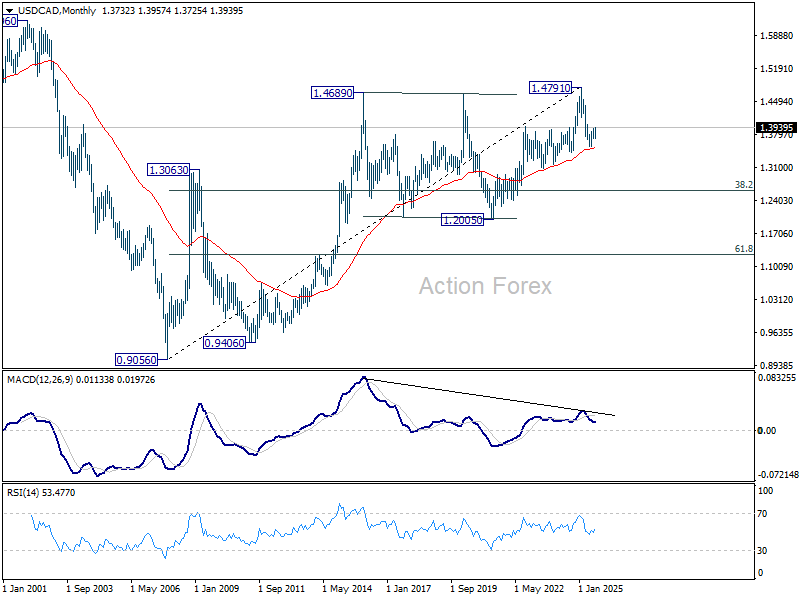
In the long term picture, considering bearish divergence condition in M MACD, up trend from 0.9506 (2027 low) might have completed with five waves up to 1.4791. Sustained trading below 55 M EMA (now at 1.3520) will solidify this case and bring deeper medium term fall to 38.2% retracement of 0.9056 to 1.4791 at 1.2600, even as a correction. Nevertheless, strong rebound from the 55 E MEA will retain bullishness for up trend resumption through 1.4791 later.
GBP/JPY Weekly Outlook
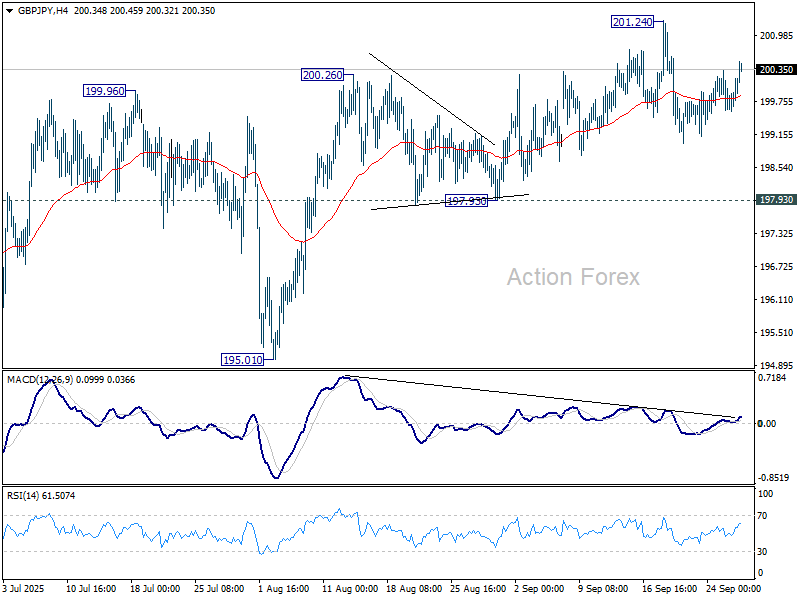
GBP/JPY stayed in sideway trading below 201.24 last week and outlook is unchanged. Initial bias stays neutral this week first. With 197.93 support intact, further rally is in favor. Firm break of 201.24 will target 100% projection of 180.00 to 199.79 from 184.35 at 204.14. However, considering bearish divergence condition in both D and 4H MACD, firm break of 197.93 will indicate bearish reversal and bring deeper fall back to 195.01 support first.
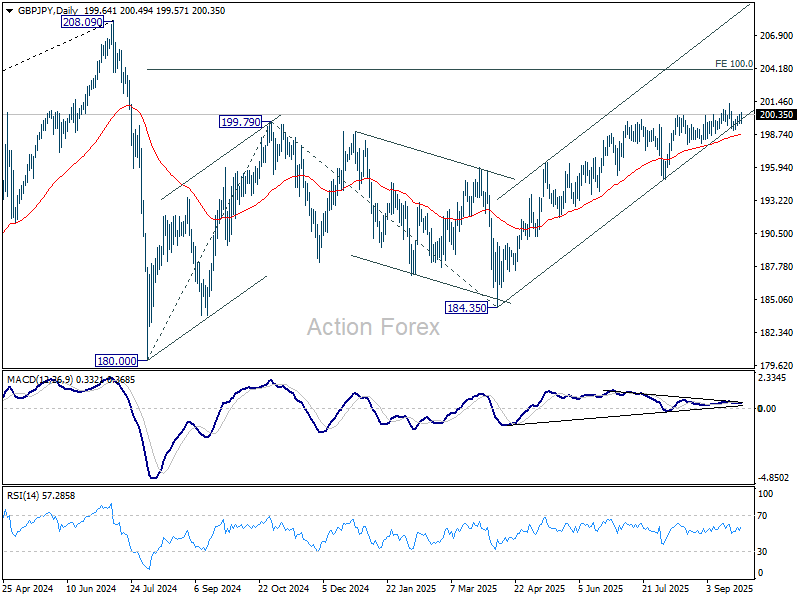
In the bigger picture, price actions from 208.09 (2024 high) are seen as a correction to rally from 123.94 (2020 low). The pattern might still extend with another falling leg. But in that case, strong support should be seen from 38.2% retracement of 123.94 to 208.09 at 175.94 to contain downside. Meanwhile, decisive break of 208.09 will confirm long term up trend resumption.
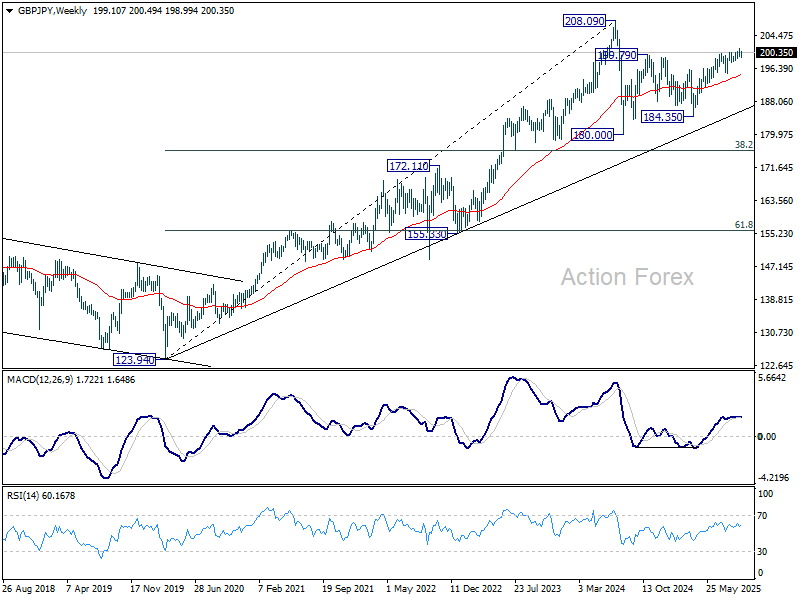
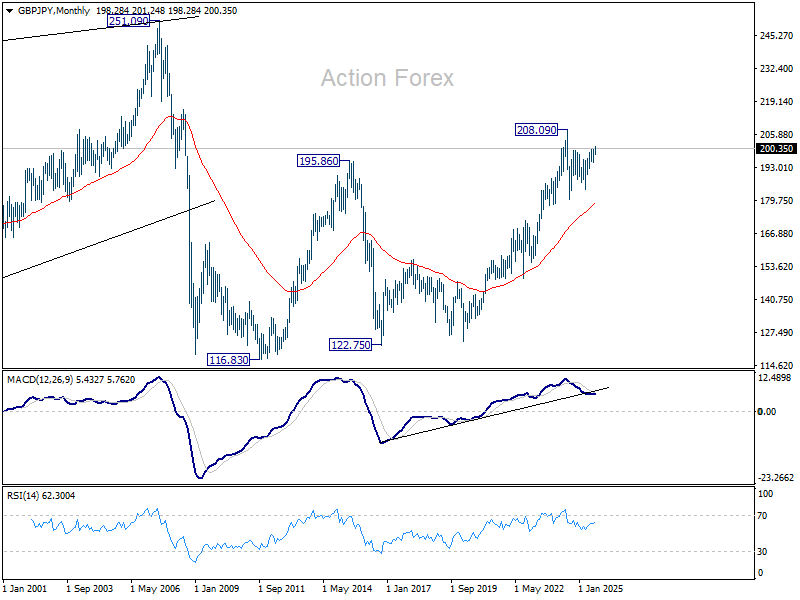
In the long term picture, there is no sign that the long term up trend from 122.75 (2016 low) has concluded. But firm break of 208.09 is needed to confirm resumption. Otherwise, more medium term range trading could still be seen.
EUR/JPY Weekly Outlook
EUR/JPY's rally continued last week. While momentum is relatively unconvincing as seen in 4H MACD, there is no sign of topping. Initial bias stays on the upside for 175.41 high. Decisive break there will resume larger up trend. On the downside, however, firm break of 173.88 resistance turned support will turn bias back to the downside for deeper pullback to 172.11 support instead.
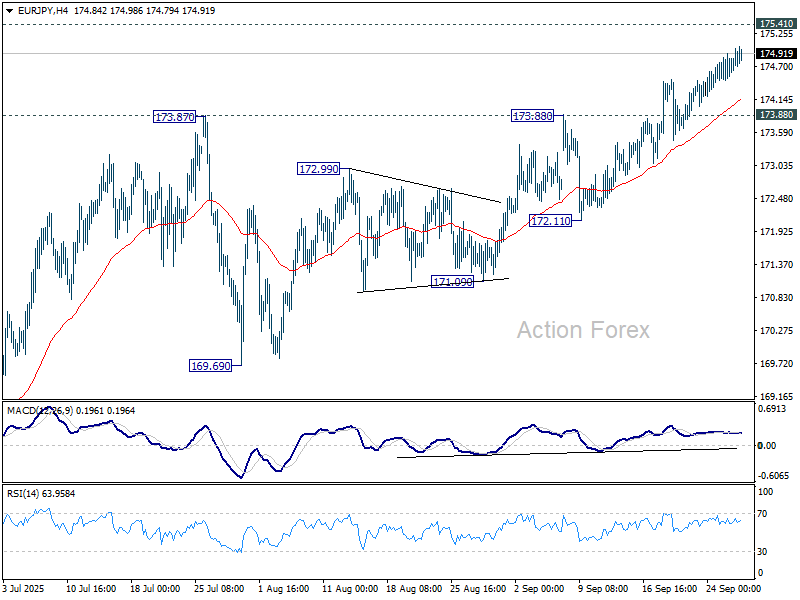
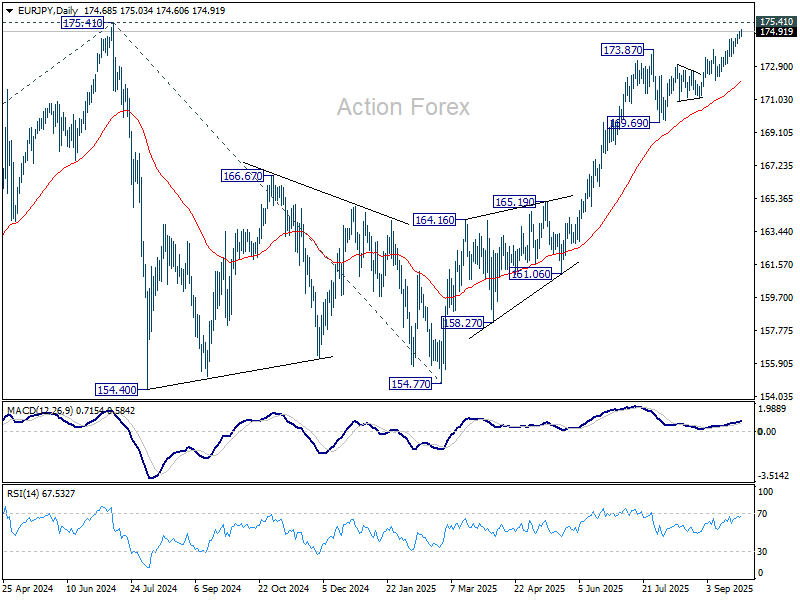
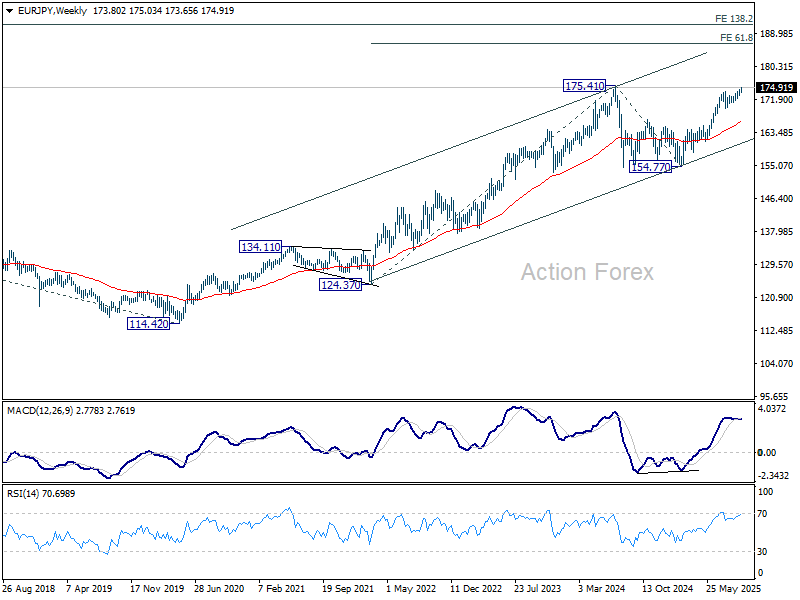
In the bigger picture, current rally from 154.77 is still tentatively seen as resuming the larger up trend. Firm break of 175.41 (2024 high) will confirm and target 61.8% projection of 124.37 (2022 low) to 175.41 from 154.77 (2025 low) at 186.31. However, sustained break of 55 D EMA (now at 171.96) will delay this bullish case, bring deeper pullback to 169.69 support first.
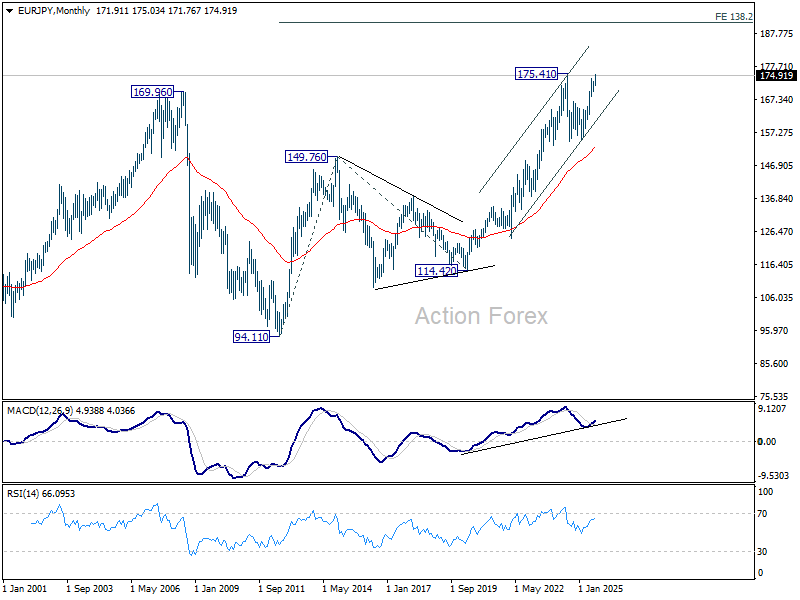
In the long term picture, up trend from 94.11 (2021 low) is still in progress. On resumption, next target is 138.2% projection of 94.11 to 149.76 (2014 high) from 114.42 (2020 low) at 191.32.
EUR/GBP Weekly Outlook
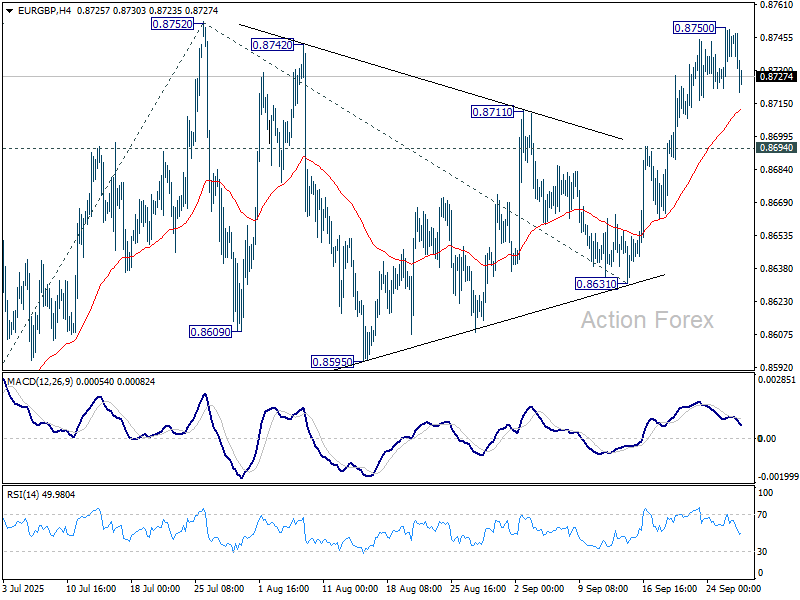
EUR/GBP rose further to 0.8750 last week but retreated ahead of 0.8752 resistance. Initial bias turned neutral this week first. Further rally is expected as long as 0.8694 support holds. Firm break of 0.8752 will resume larger rally to 61.8% projection of 0.8354 to 0.8752 from 0.8631 at 0.8877, which is close to 0.8867 However, break of 0.8694 will turn bias back to the downside for 0.8631 support instead.
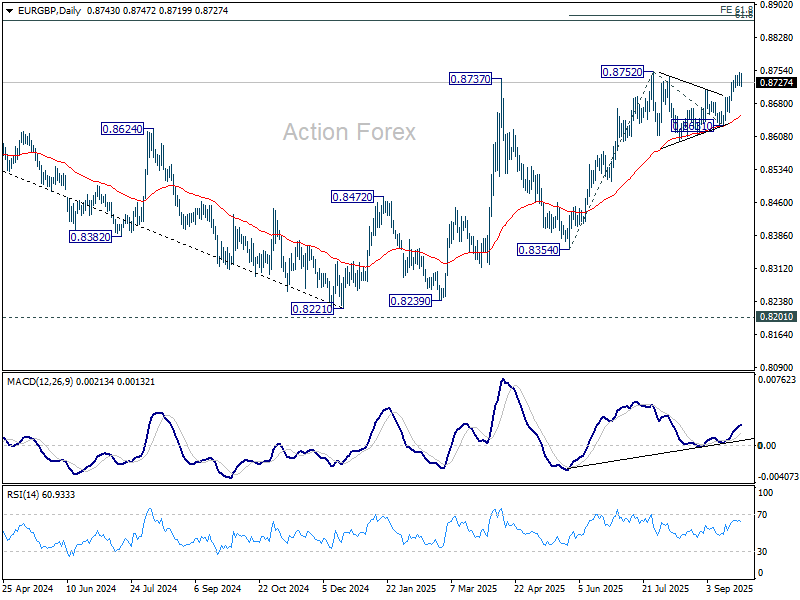
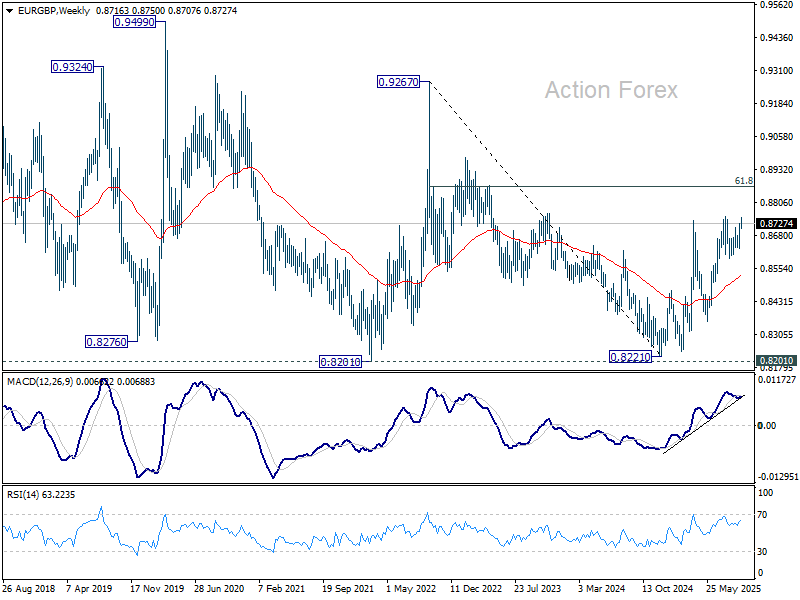
In the bigger picture, the structure from 0.8221 medium term bottom are not impulsive enough to suggest that it's reversing the down trend from 0.9267 (2022 high). But even if it's a correction, further rise could still be seen to 61.8% retracement of 0.9267 to 0.8221 at 0.8867. Nevertheless, sustained trading below 55 W EMA (now at 0.8533) will argue that the pattern has completed and bring retest of 0.8221 low.
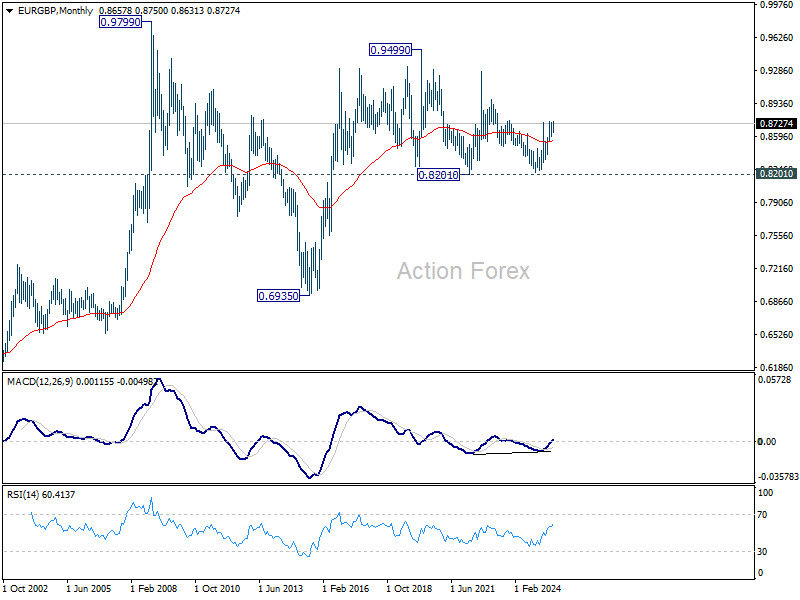
In the long term picture, price action from 0.9499 (2020 high) is seen as part of the long term range pattern from 0.9799 (2008 high). Range trading should continue between 0.8201 and 0.9499, until there is clear signal of imminent breakout.
EUR/AUD Weekly Outlook
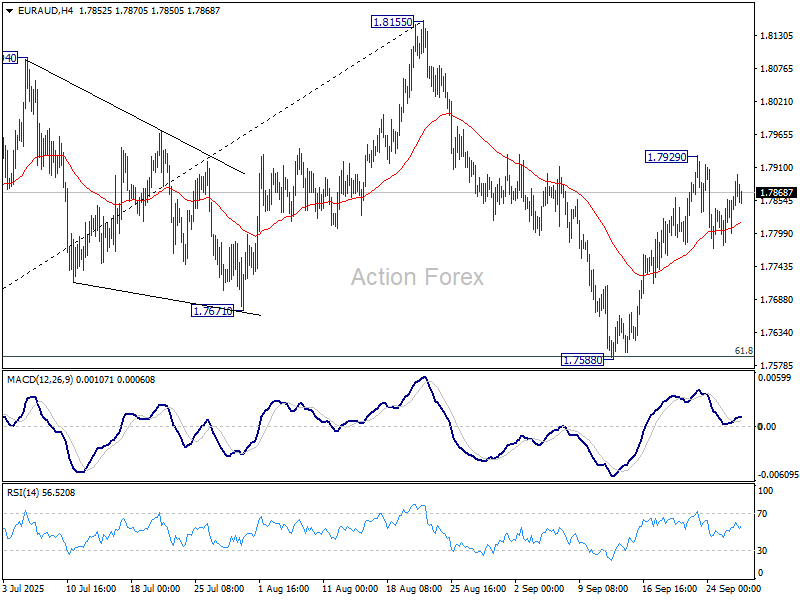
EUR/AUD edged higher to 1.7929 last week but turned sideway since then. Initial bias remains neutral this week first. Pullback from 1.8155 could have completed at 1.7588 already, after defending 61.8% retracement of 1.7245 to 1.8155 at 1.7593. Above 1.7929 will resume the rebound from 1.7588 to retest 1.8155. However, sustained break of 1.7588 will bring deeper fall to 1.7245 resistance, as part of the corrective pattern from 1.8554 high.
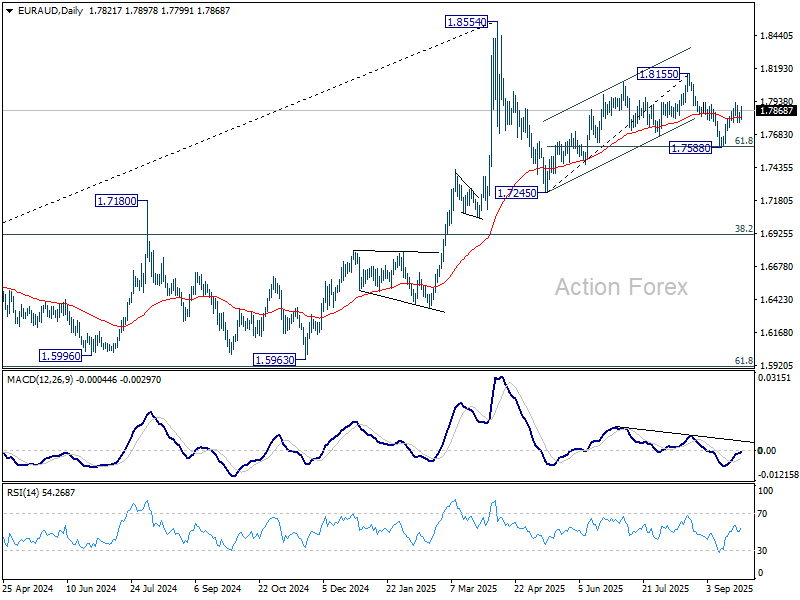
In the bigger picture, price actions from 1.8554 medium term top are seen as a corrective pattern. Deeper fall could be seen as the pattern extends, but downside should be contained by 38.2% retracement of 1.4281 (2022 low) to 1.8554 at 1.6922 to bring rebound. Uptrend from 1.4281 is expected to resume at a later stage.
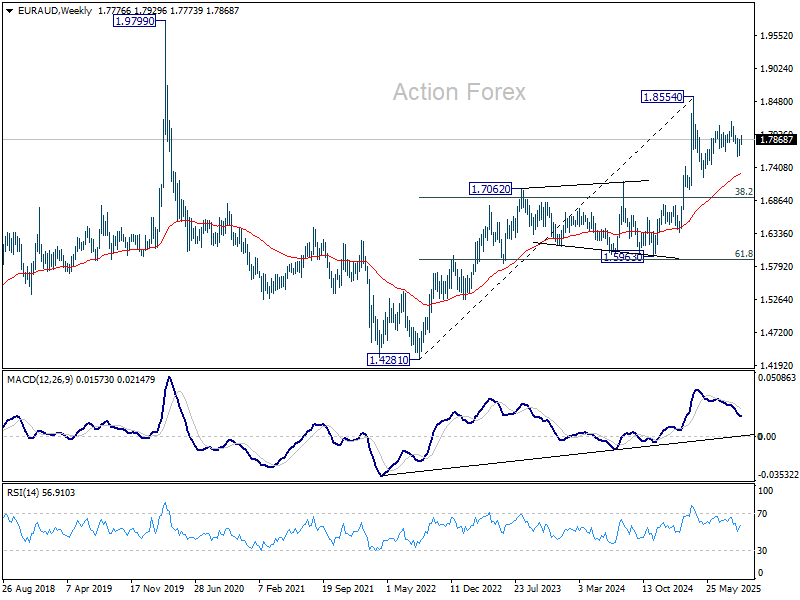
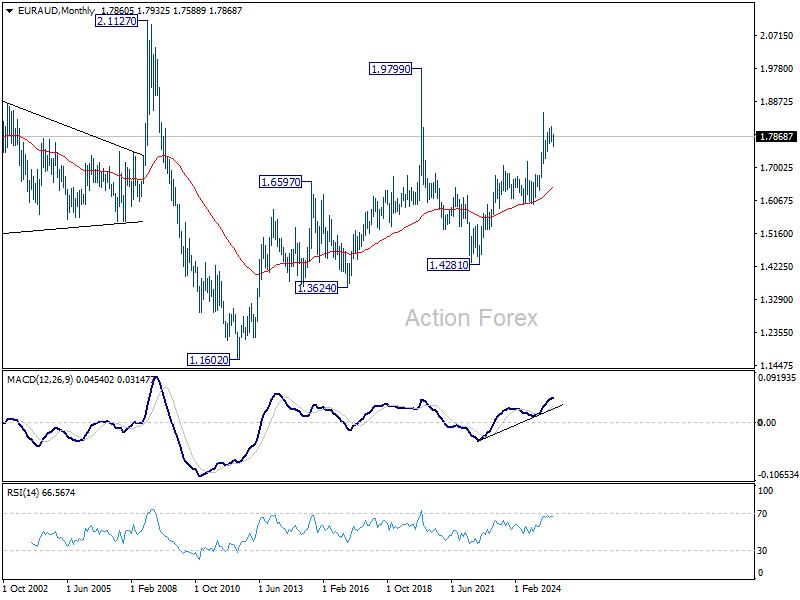
In the longer term picture, rise from 1.4281 is seen as the second leg of the pattern from 1.9799 (2020 high), which is part of the pattern from 2.1127 (2008 high). As long as 55 M EMA (now at 1.6464) holds, this second leg could still extend higher.
EUR/CHF Weekly Outlook
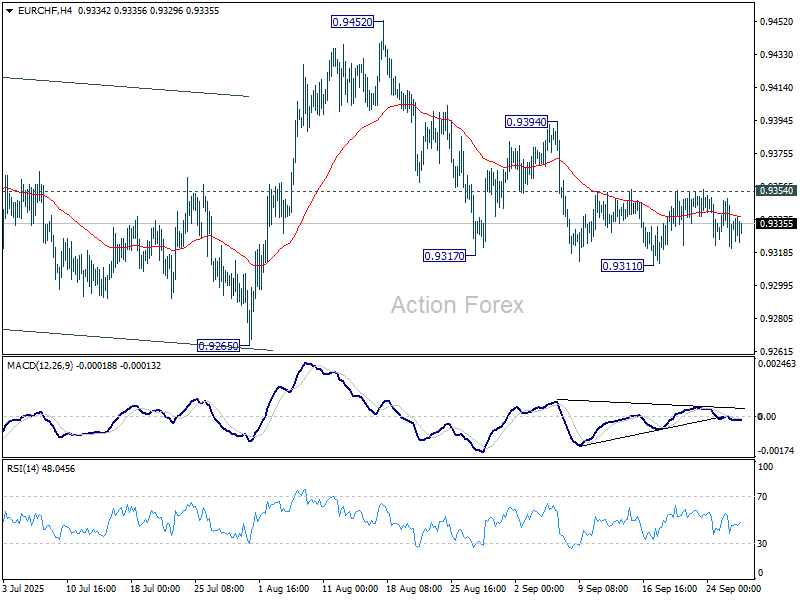
EUR/CHF's recovery was limited by 0.9354 resistance last week as sideway trading continued. Initial bias stays neutral this week first. Risk is mildly on the downside as long as 0.9354 resistance holds. Break of 0.9311 will resume the fall from 0.9452 to 0.9265 support. Nevertheless, firm break of 0.9354 will turn bias back to the upside for 0.9452 resistance instead.
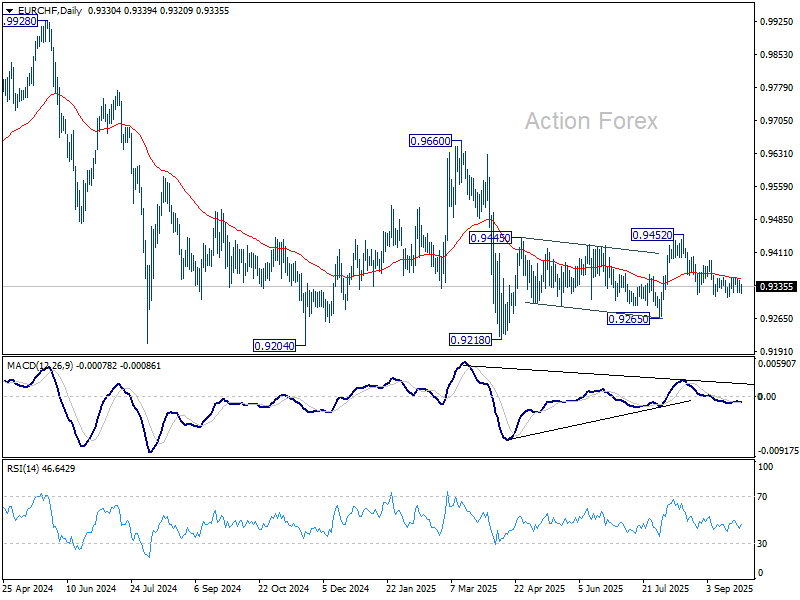
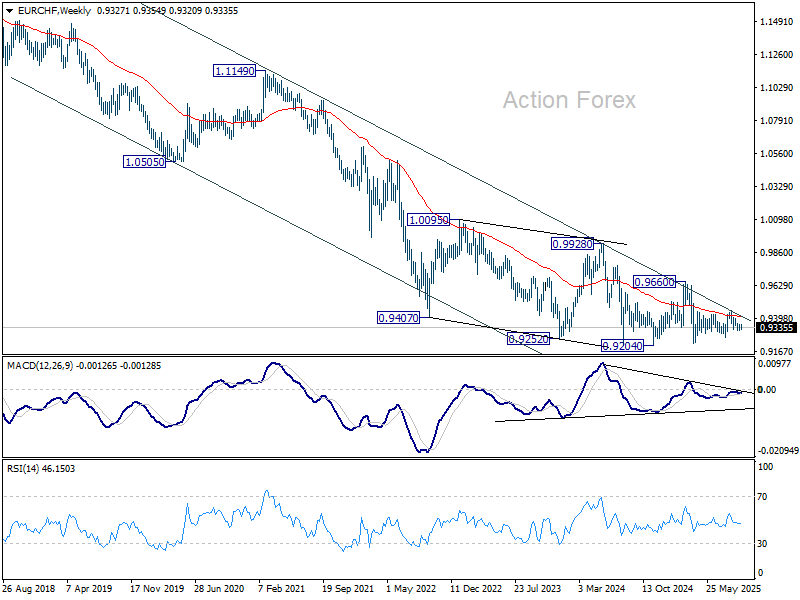
In the bigger picture, the down trend from 0.9204 (2018 high) might still be in progress considering that EUR/CHF is staying well inside the long term falling channel. However, with bullish convergence condition in W MACD, downside potential should be limited in case of another fall. Instead, firm break of 0.9660 resistance will be an important sign of medium term bullish trend reversal.
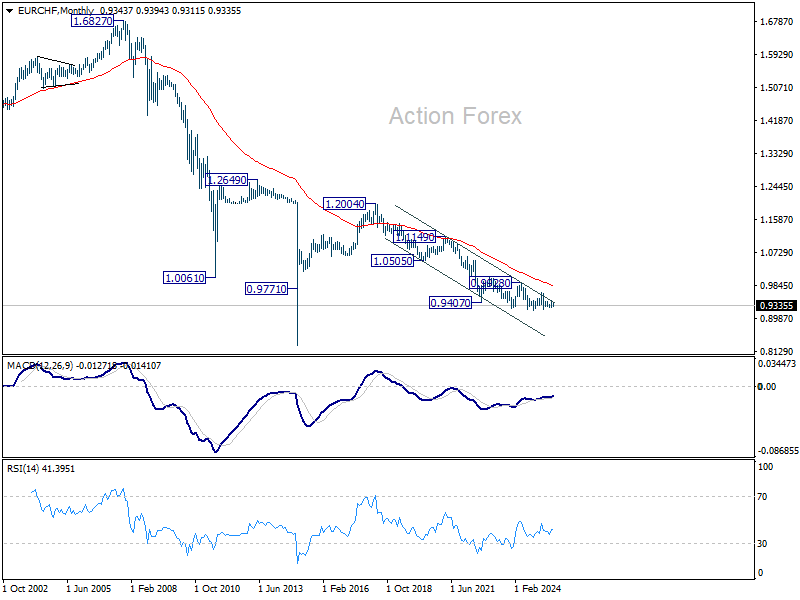
In the long term picture, overall long term down trend is still in progress in EUR/CHF. Outlook will continue to stay bearish as long as 55 M EMA (now at 0.9839) holds.
Markets Weekly Outlook – Getting Ready for September NFP Week
Week in review – UN Assembly, ever-stronger metals, Powell and a huge USD performance,
A week dominated by central bank communications and seasonal dynamics kept investors on edge, even as the UN General Assembly passed without major geopolitical surprises except for some memorable US President Trump quotes.
Instead, markets focused on Fed officials and their global counterparts weighing in on shifting economic conditions.
Powell’s Rhode Island appearance delivered another shift to Market focus, highlighting rising downside risks to employment and how hiring momentum has “dropped very sharply.”
Fed Governor Bowman, a known dove, pushed the point further, calling for a more proactive stance to avoid falling “behind the curve”.
Further north, Bank of Canada Governor Macklem stressed that trade is under attack, citing a sharp slowdown in exports and weaker investment trends tied to US policy uncertainty.
He also had a few words to say on the FED’s independence and shed some light on Jerome Powell’s solid performance amid all the menaces.
Markets responded in seasonal fashion, following the classic “sell Rosh Hashanah” adage pattern as volumes thinned and equities corrected from recent highs, leading to a three-day correction in Equities.
Happy New Year to those who celebrate, and peace to markets and communities alike.
Powell’s reminder that “equity prices are fairly highly valued” added pressure, with the S&P 500 and broader indices retracing into familiar September headwinds.
The US Dollar, however, stood out, rallying on strong technical catalysts and better-than-expected US data that pushed back against optimistic 2026 rate cut bets.
Resilient job numbers, as seen in the latest Jobless Claims report, and decent macro conditions for now helped the greenback regain ground, underscoring the relative strength of the US economy against global peers.
A tense vibe can also be seen in the latest headline from US Secretary of War Pete Hegseth, who is convening all army generals next week.
This vibe actually might have been one of the reasons for such a huge performance in metals, with Gold again marking fresh record highs on Tuesday, Platinum reaching 12 year highs and Silver pushing to reach new all-time highs, breaching $46 just today.
Weekly performance from different asset classes
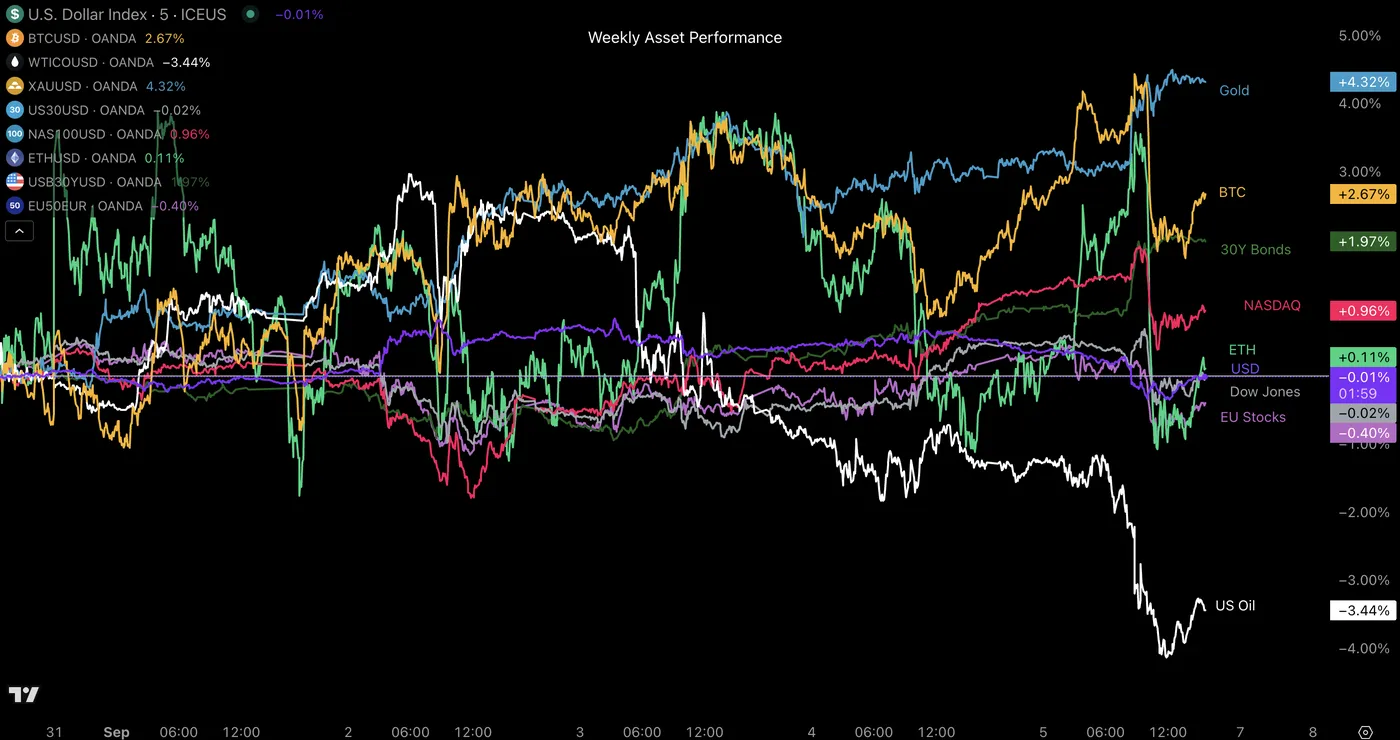
Weekly Asset Performance, September 26, 2025 – Source: TradingView
As mentioned in the introduction, metals and the US Dollar have both sustained a consistent, strong performance but the commodity that stood out the most was easily Oil.
Black gold silently rose close to 5% just this week and closing the week at its highs. It seems that Europe turning away from Russian oil as this theme progresses is starting to have an influence on the pricing itself.
The real outperformers of the week, to the downside unfortunately, have been cryptocurrencies which took a dent to their strong yearly performance.
They maintain at fairly high levels but their price action resembles more one of a small correction rather than a simple pullback: Ethereum now stands below the $4,000 mark, and Bitcoin is closing the week shy of $110,000
Let's also see if a further correction in cryptocurrencies could trigger further reactions to the current stubbornly ecstatic market sentiment.
Let’s dive into next week’s action, with a week that should be pretty busy.
The Week Ahead – NFP week and RBA meeting
Asia Pacific Markets - A new RBNZ Governor and a well-anticipated RBA meeting
Not mentioned in the introduction but Markets are welcoming the new Royal Bank of New Zealand Governor Anna Breman.
The week in Asia-Pacific kicks off with Japanese retail trade data and China’s official PMIs on Monday but the week really starts the following day for APAC trading.
The main focus lands squarely on Tuesday, when the Reserve Bank of Australia (RBA) delivers its interest rate decision, statement, and rate outlook, followed by Governor Bullock’s press conference.
The market is largely priced for a pause with only 6% of a cut priced in and only 16 bps of cut premiums priced through the end of 2025.
Later in the day, Japan’s Tankan survey offers fresh insights into business sentiment, while New Zealand reports on building permits.
On Wednesday, Australia publishes its monthly trade balance, exports, and imports, alongside the RBA’s Financial Stability Review, keeping AUD traders busy for the week. As a matter of fact, the week doesn't end here for Australian data.
Thursday turns to high-frequency indicators with Australia’s S&P Global PMIs and Japan’s unemployment rate, while Bank of Japan Governor Ueda’s speech will be closely watched for hints on upcoming policy.
Indeed, more talks around a hawkish BoJ are starting to appear, with data corroborating a potential future hike at the October 30th rate decision.
Remember that Bank of Japan rate decisions are huge for markets, particularly regarding Basis trades.
The week rounds off on Friday with Japan’s ruling LDP presidential election — a political event that could indirectly shape the BoJ’s stance and the yen outlook under new party leadership.
US, Europe and UK Markets - US Non-Farm Payrolls, UK GDP, Swiss CPI and many speakers
The week starts with an army of central bank voices on Monday, as both the Fed (Williams, Waller, ..) and the ECB unleash a wave of speakers, setting the tone for rates and policy expectations.
Since the September meetings have passed, markets wnow await what CB speakers will have to say regarding upcoming decisions and what they are looking at.
On Tuesday, attention shifts to the UK with Q2 GDP (QoQ/YoY) and to the eurozone with German CPI and euro-wide HICP prints, crucial for inflation watchers. ECB President Lagarde also speaks at the Bank of Finland’s 4th International Monetary Policy Conference
Wednesday brings more eurozone inflation data, this time the core HICP, alongside the US ADP employment change and ISM Manufacturing PMI — a solid preview into Friday’s labour market release.
On Thursday, Switzerland releases its CPI report, potentially steering CHF volatility, particularly with the ongoing deflation and the SNB hinting that they would be ready to cut rates to negative territory if needed.
The week’s climax lands on Friday with the US Non-Farm Payrolls, wages data, and unemployment rate for the month of September— This report will be essential as per usual, as the mood seems to relax regarding the US employment: the recent decreases could be relating to a lower labor demand from tighter immigration rather than actual economic slowdown.
But always remember that NFP can bring some surprises.
Of course, don't forget the ISM Services PMI at 10:00 A.M. that day.
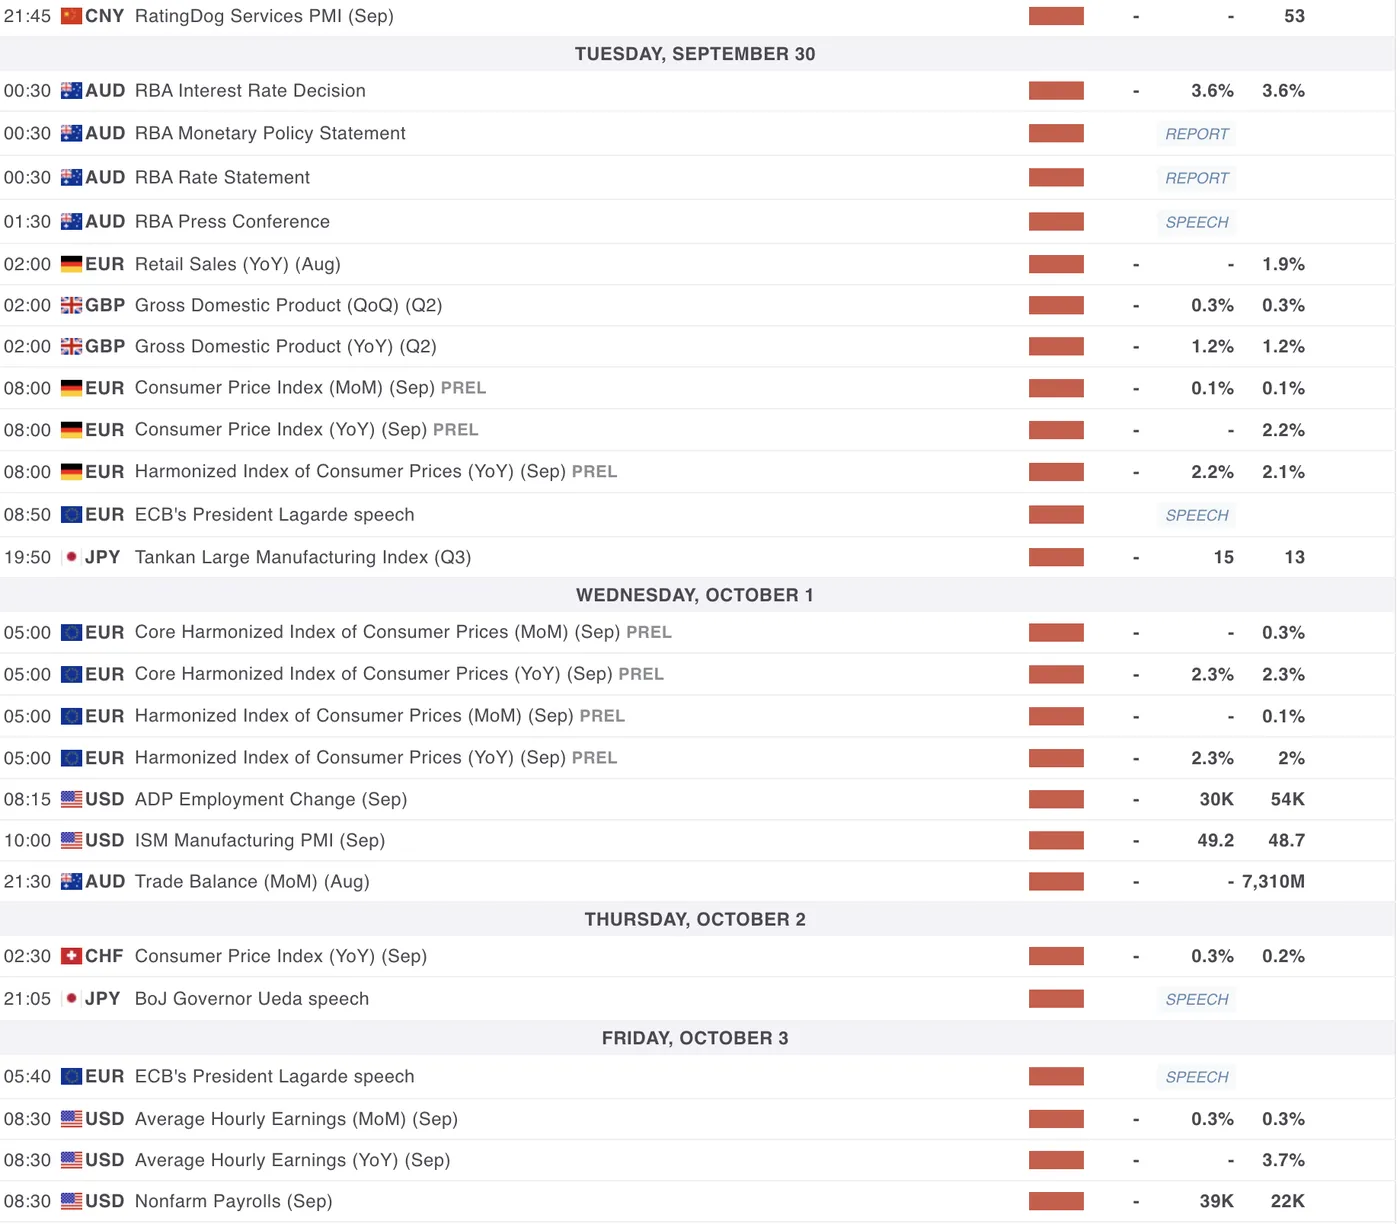
For all market-moving economic releases and events, see the MarketPulse Economic Calendar. (High-tier data only)
Not on the picture but do not forget the Chinese NBS Manufacturing PMI data on Monday evening (21:30).
Safe Trades and enjoy your weekend!