
Sample Category Title
S&P 500 Index Remains Positive Against the Odds
Today, the S&P 500 Index (US SPX 500 mini on FXOpen) is trading close to a new all-time high, having opened Monday above 6,675 points. This reflects continued optimism among market participants despite factors such as:
→ The risk of a U.S. government shutdown on 1 October.
Today, President Trump will meet with Democratic and Republican leaders in Congress to try to prevent a halt to government funding. However, Reuters reports that chances of reaching an agreement are slim. At the same time, Bank of America analysts remain calm, noting that a shutdown would shave only around 0.1% off GDP per week, and historically such closures have had little impact on financial markets.
→ Jerome Powell’s hawkish stance at the September Federal Reserve meeting.
Nevertheless, most market participants expect the Fed to make another move towards cutting rates at its next meeting on 29 October. The publication of the PCE index on Friday increased this likelihood, as the figures came in line with forecasts, reducing the risk of a renewed inflation surge.
Technical Analysis of the E-mini S&P 500 Chart
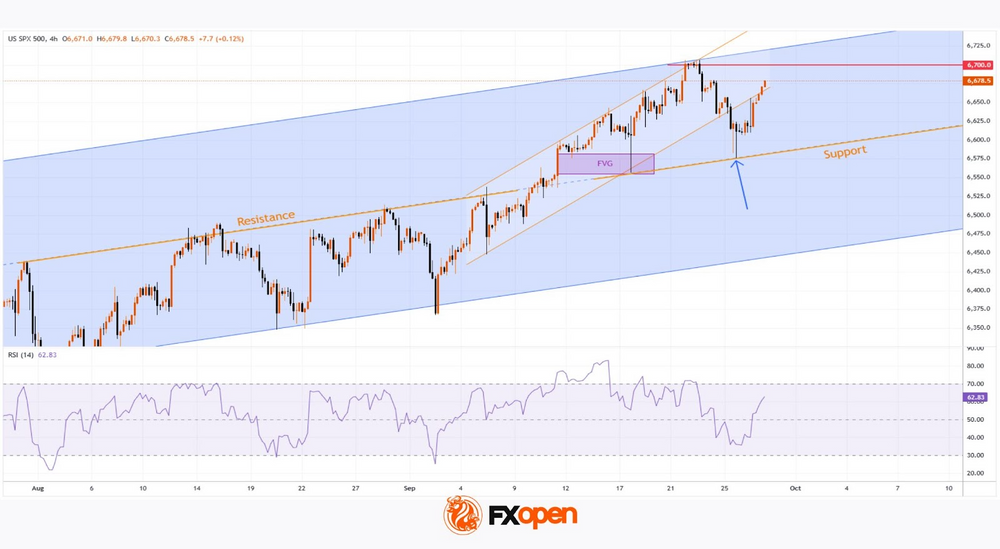
On 17 September, analysing the 4-hour chart of the S&P 500 Index (US SPX 500 mini on FXOpen), we noted:
→ the price continues to fluctuate within an ascending channel, highlighted in blue;
→ the long body of the bullish candle on 11 September points to strong buyer pressure, indicating an imbalance, or, in Smart Money Concept terminology, a Fair Value Gap (FVG).
At present, the channel remains relevant, but it has expanded — bullish sentiment has shifted the key line (marked in orange) from resistance to support. At the same time, the FVG zone has confirmed its role as support.
Possible developments: the chart indicates a buyer advantage:
→ strong demand near the channel’s median (evident in the long lower shadows from Friday, marked with an arrow);
→ buying activity has been strong enough to push the price back (for now) within the ascending channel.
If buyer dominance continues, this could lead to a new all-time high, testing the upper boundary of the channel. From a bearish perspective:
→ the psychological level of 6,700 could act as resistance;
→ continued growth at Monday’s open could push the RSI indicator into overbought territory, creating potential for a correction.
However, as long as the S&P 500 Index (US SPX 500 mini on FXOpen) remains above the orange support line, there is reason to believe that the bulls remain in control.
Trade global index CFDs with zero commission and tight spreads. Open your FXOpen account now or learn more about trading index CFDs with FXOpen.
This article represents the opinion of the Companies operating under the FXOpen brand only. It is not to be construed as an offer, solicitation, or recommendation with respect to products and services provided by the Companies operating under the FXOpen brand, nor is it to be considered financial advice.
Gold Rallies 1.5% to Trade Above $3800/oz, US Government Shutdown in Focus & FTSE 100 Runs Into Resistance
Asia Market Wrap - Nikkei Slips
Most stock markets in Asia rose on Monday, while the U.S. dollar eased. This investor reaction was triggered by the possibility of a U.S. government shutdown, which would lead to the delayed publication of the September jobs report and other key economic data.
China's blue-chip stocks added 0.7% ahead of the start of the Golden Week holidays on Wednesday. The broader MSCI index for Asia-Pacific shares (excluding Japan) firmed 0.4%, bringing its monthly gain to almost 4%.
South Korean stocks bounced 1.5%, contributing to their strong 7.8% gain for September.
The exception was Japan's Nikkei index, which slipped 0.8% as investors focused on the upcoming weekend vote for the new leader of the ruling party, a decision that will have implications for Japan's future fiscal and monetary policy.
European Session - Healthcare and Tech Stocks Lead to Positive Open
European stock markets saw a slight increase on Monday, driven by gains in healthcare and technology company shares.
Investors were keeping a close watch on the possibility of a U.S. government shutdown, which would likely postpone the release of important economic data.
The main pan-European index, the STOXX 600, rose by 0.2%.
Healthcare stocks were among the biggest gainers, with Britain's GSK jumping 3.3% after the drugmaker announced that its CEO, Emma Walmsley, will step down and be replaced by Luke Miels in January.
The UK's AstraZeneca added 1.3% after stating it will keep its listing and headquarters in London but will now directly list its shares on the New York Stock Exchange, moving away from its current depository shares system.
Technology shares advanced by 0.6%, with chipmakers ASMI and BE Semiconductor both rising by over 1%. The industrial goods and services sector also performed well, gaining 0.4%.
On the FX front, the US dollar slightly weakened on Monday. The dollar index, which tracks its value against other major currencies, was down by 0.22% to 97.90, following a gain of 0.5% last week.
The dollar fell against the Japanese yen by 0.6%. Meanwhile, the euro and the British pound both strengthened against the dollar, rising by 0.25% and 0.34%, respectively.
In other news, the Australian dollar rose by 0.35%, reaching $0.6571. Investors are currently looking ahead to the Reserve Bank of Australia's interest rate decision on Tuesday, where the central bank is widely expected to keep rates unchanged.
Currency Power Balance
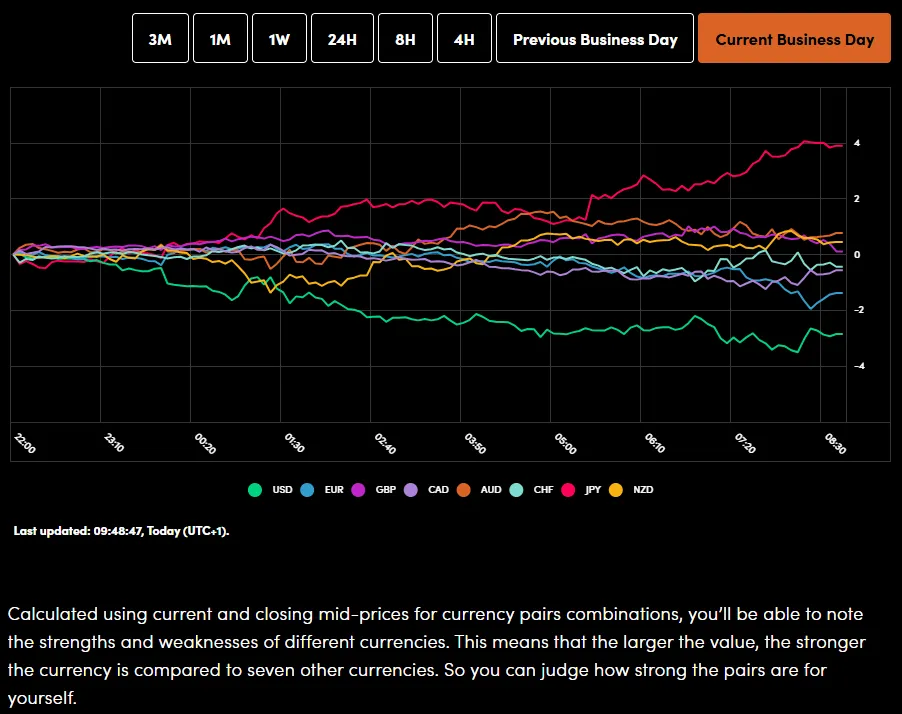
Source: OANDA Labs
Oil prices fell on Monday due to two main reasons that signal an increase in global supply. First, Iraq's Kurdistan region started shipping crude oil again through Turkey over the weekend. Second, the group of major oil producers, OPEC+, plans to increase oil production again in November.
Specifically, Brent crude futures dropped by 43 cents (0.6%) to $69.70 a barrel, pulling back after reaching their highest price since July 31 on Friday. US West Texas Intermediate (WTI) crude also fell by 49 cents (0.8%) to $65.23 a barrel, giving back most of the gains it made on Friday.
Gold prices soared past the $3,800 an ounce mark for the first time ever on Monday. This major surge was fueled by rising market expectations that the US Federal Reserve will soon cut interest rates, a prospect that weakened the US dollar and made the precious metal more attractive.
Furthermore, concerns over a potential US government shutdown encouraged investors to seek safety in gold, a traditional safe-haven asset. The price of spot gold jumped 1.4% to $3,812.49 per ounce, having peaked at $3,819.59 earlier in the trading session.
Economic Calendar and Final Thoughts
Looking at the economic calendar, the European session will be a quiet one from a data perspective but we do have a host central bank speakers on the docket.
Later in the day, markets will focus on US pending homes index as well as Federal Reserve policymakers who are scheduled to speak. Markets will also hope for a resolution on a potential US government shutdown. The lack of a resolution could add to uncertainty and stoke further haven demand.
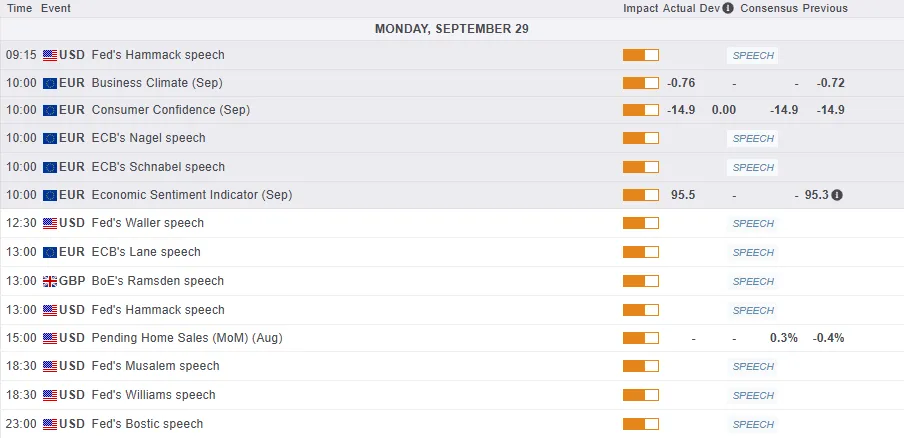
For all market-moving economic releases and events, see the MarketPulse Economic Calendar. (click to enlarge)
Chart of the Day - FTSE Index
From a technical standpoint, the FTSE 100 index finished last week on the front foot.
Gains have continued this morning but the index is currently in overbought territory and a short-term pullback could be on the cards
The 9357 handle remains key, with a break above this level potentially leading to further upside toward the 9500 level.
A pullback from here could find support at the swing high around 9280 before the 100-day MA at 9254 comes into focus.
FTSE 100 Four-Hour Chart, September 29. 2025
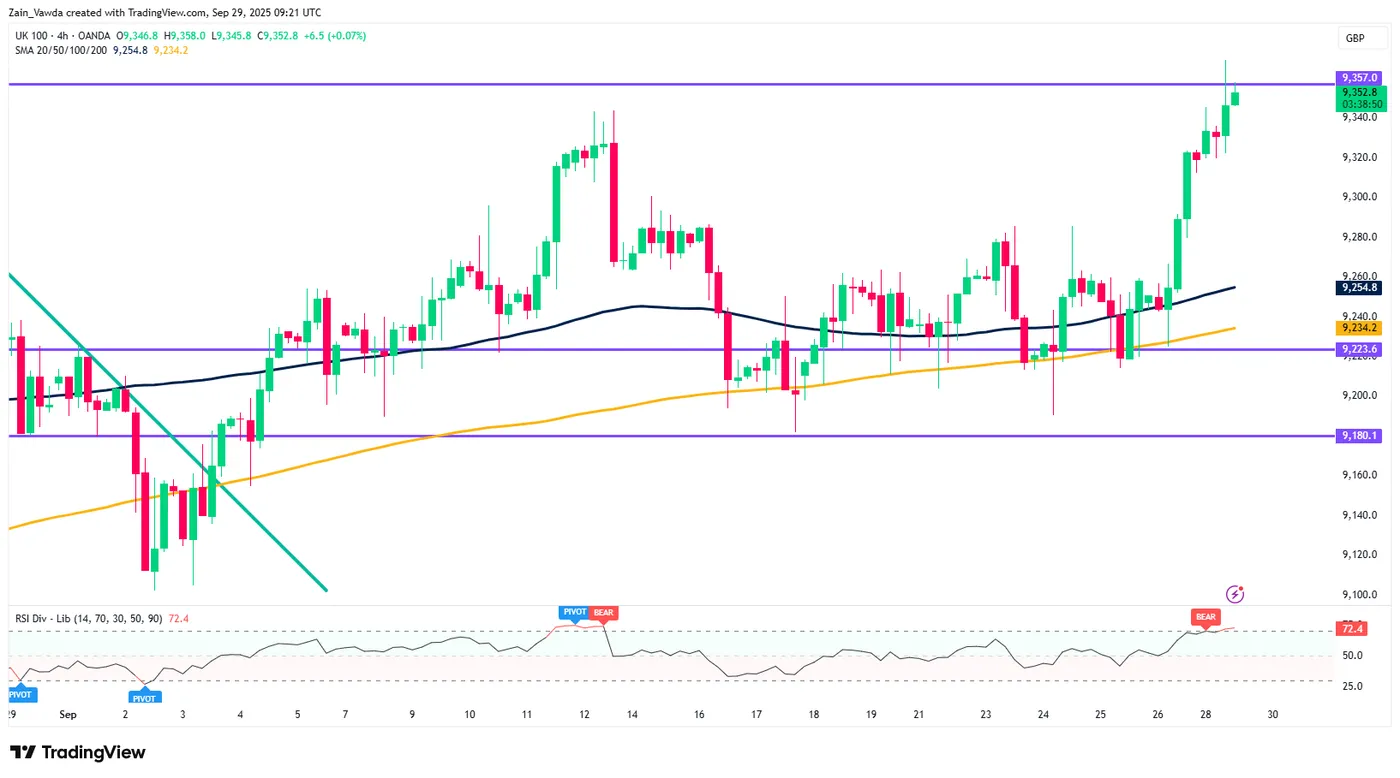
Source: TradingView.com (click to enlarge)
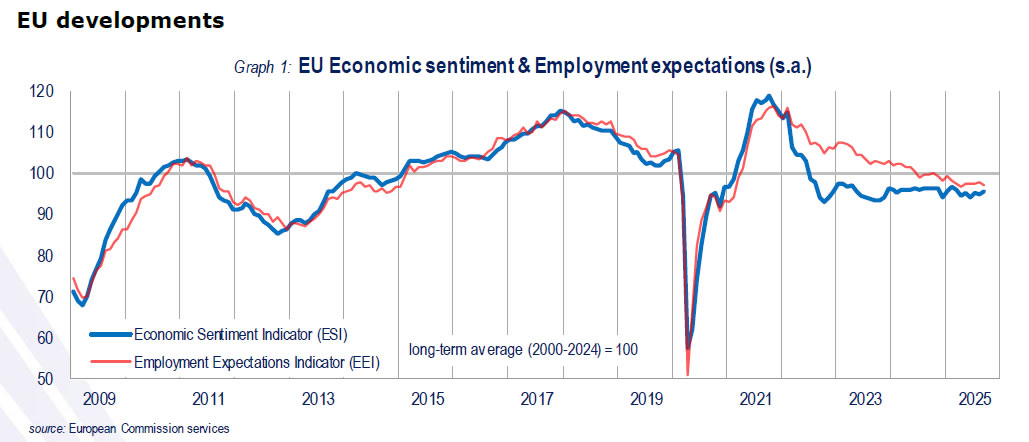
Eurozone economic sentiment inches higher to 95.5, jobs outlook softer
Economic sentiment in the Eurozone improved slightly in September, with the Economic Sentiment Indicator rising 0.2 points to 95.5. The broader EU also gained 0.6 points to the same level. Despite the uptick, sentiment remains below the long-term average of 100.
The modest gains were driven by stronger confidence in industry, services, and among consumers, offset partly by weaker retail sentiment and stable conditions in construction.
By contrast, labor market expectations slipped, with the Employment Expectations Indicator dropping -0.9 points in the EU and -1.3 points in the euro area, suggesting hiring momentum is fading.
Country-level trends were uneven. Spain led with a notable 3-point jump, followed by Italy (+0.7), while sentiment weakened in the Netherlands (-0.7) and Germany (-0.4). France (+0.3) and Poland (+0.1) saw little change.
Full EU and Eurozone economic sentiment indicator release here.
GBP/USD Bounces Back, USD/CAD Maintains Bullish Consolidation
GBP/USD is attempting a recovery wave from 1.3325. USD/CAD is showing positive signs and might aim for more gains above 1.3960.
Important Takeaways for GBP/USD and USD/CAD Analysis Today
- The British Pound started a recovery wave above 1.3370 and 1.3400.
- There was a break above a key bearish trend line with resistance near 1.3390 on the hourly chart of GBP/USD at FXOpen.
- USD/CAD rallied above 1.3880 and 1.3920 before the bears appeared.
- There is a connecting bullish trend line forming with support at 1.3915 on the hourly chart at FXOpen.
GBP/USD Technical Analysis
On the hourly chart of GBP/USD at FXOpen, the pair started a fresh decline from 1.3530 after a decent increase. The British Pound traded below 1.3450 to again move into a short-term bearish zone against the US Dollar.
The pair even traded below 1.3400 and the 50-hour simple moving average. Finally, the bulls appeared near 1.3325. A low was formed near 1.3323 and the pair is now attempting a short-term recovery wave.
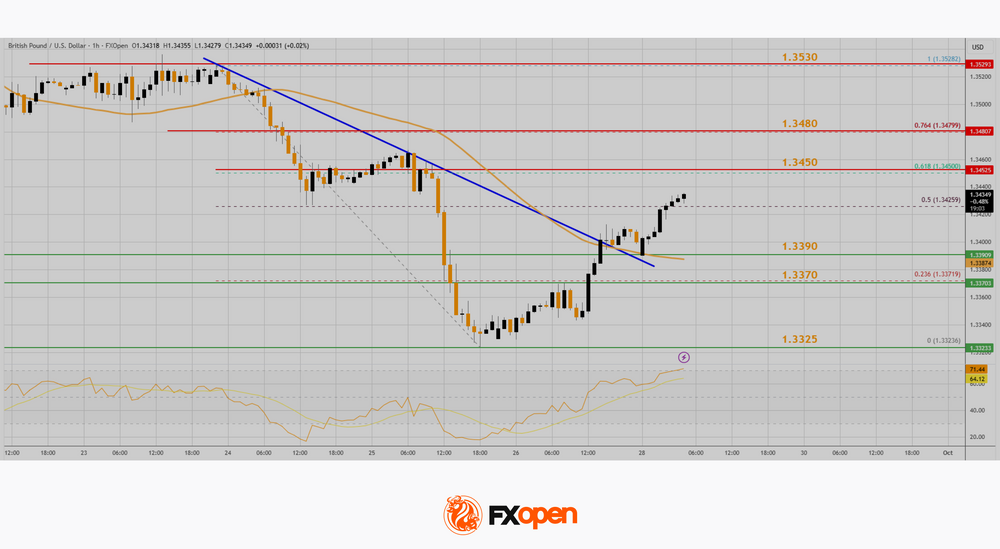
There was a fresh upside above 1.3370 and the 23.6% Fib retracement level of the downward move from the 1.3528 swing high to the 1.3323 low. More importantly, there was a break above a key bearish trend line with resistance near 1.3390.
The pair is now showing positive signs above 1.3420. Immediate resistance on the upside is near the 61% Fib retracement at 1.3450. The first major hurdle for the bulls on the GBP/USD chart is 1.3480.
A close above 1.3480 might spark a decent increase. The next stop for the bulls might be 1.3530. Any more gains could lead the pair toward 1.3620 in the near term. Initial support sits near the 50-hour simple moving average at 1.3390.
The next key area of interest might be 1.3370, below which there is a risk of another sharp decline. In the stated case, the pair could drop toward 1.3325.
USD/CAD Technical Analysis
On the hourly chart of USD/CAD at FXOpen, the pair formed a strong support base above the 1.3770 level. The US Dollar started a fresh increase above 1.3820 against the Canadian Dollar.
The pair cleared the 50-hour simple moving average and climbed above 1.3900. Finally, it tested the 1.3960 zone before the bears appeared. The pair traded below 1.3940 and the 50-hour simple moving average.
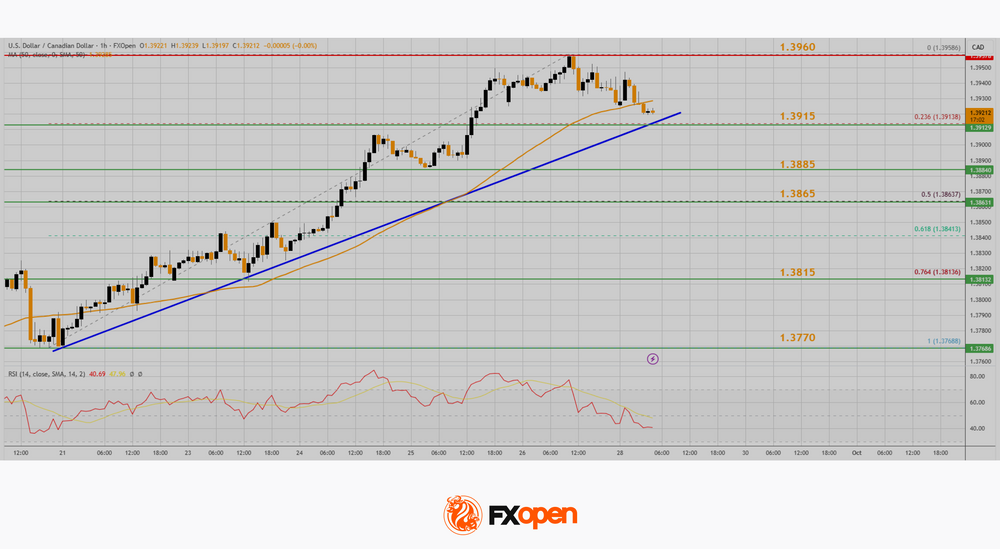
Initial support is near a connecting bullish trend line at 1.3915. It coincides with the 23.6% Fib retracement level of the upward move from the 1.3768 swing low to the 1.3958 high.
A downside break below the trend line might send the pair toward 1.3885. The next major area on the same USD/CAD chart could be the 50% Fib retracement at 1.3865. A close below 1.3865 could push the pair further lower. In the stated case, the bears might aim for a test of 1.3815.
On the upside, initial resistance sits near 1.3930 and the 50-hour simple moving average. The main breakout zone could be 1.3960. A clear upside break above 1.3960 could start another steady increase. The next major stop for the bulls might be 1.4000. Any more gains could open the doors for a test of 1.4050.
Trade over 50 forex markets 24 hours a day with FXOpen. Take advantage of low commissions, deep liquidity, and spreads from 0.0 pips. Open your FXOpen account now or learn more about trading forex with FXOpen.
This article represents the opinion of the Companies operating under the FXOpen brand only. It is not to be construed as an offer, solicitation, or recommendation with respect to products and services provided by the Companies operating under the FXOpen brand, nor is it to be considered financial advice.
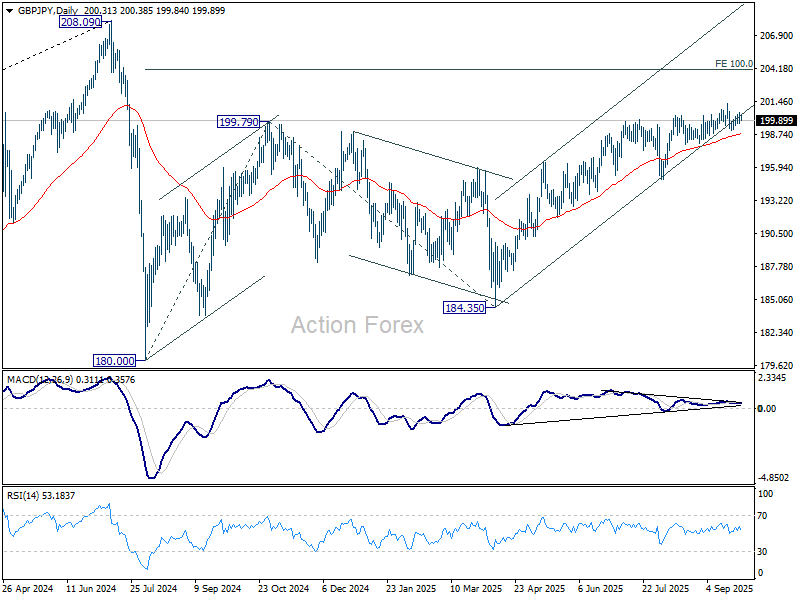
GBP/JPY Daily Outlook
Daily Pivots: (S1) 199.82; (P) 200.17; (R1) 200.64; More...
No change in GBP/JPY's outlook and intraday bias stays neutral. With 197.93 support intact, further rally is in favor. Firm break of 201.24 will target 100% projection of 180.00 to 199.79 from 184.35 at 204.14. However, considering bearish divergence condition in both D and 4H MACD, firm break of 197.93 will indicate bearish reversal and bring deeper fall back to 195.01 support first.
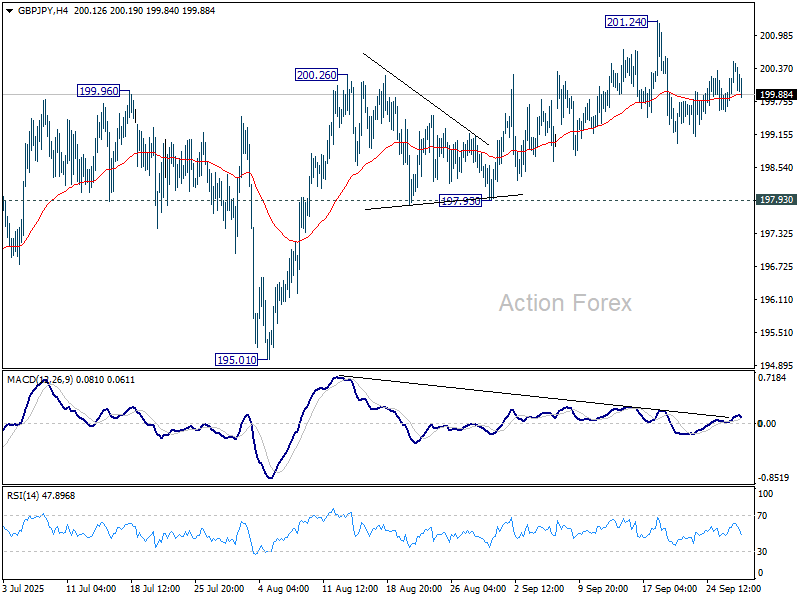
In the bigger picture, price actions from 208.09 (2024 high) are seen as a correction to rally from 123.94 (2020 low). The pattern might still extend with another falling leg. But in that case, strong support should be seen from 38.2% retracement of 123.94 to 208.09 at 175.94 to contain downside. Meanwhile, decisive break of 208.09 will confirm long term up trend resumption.
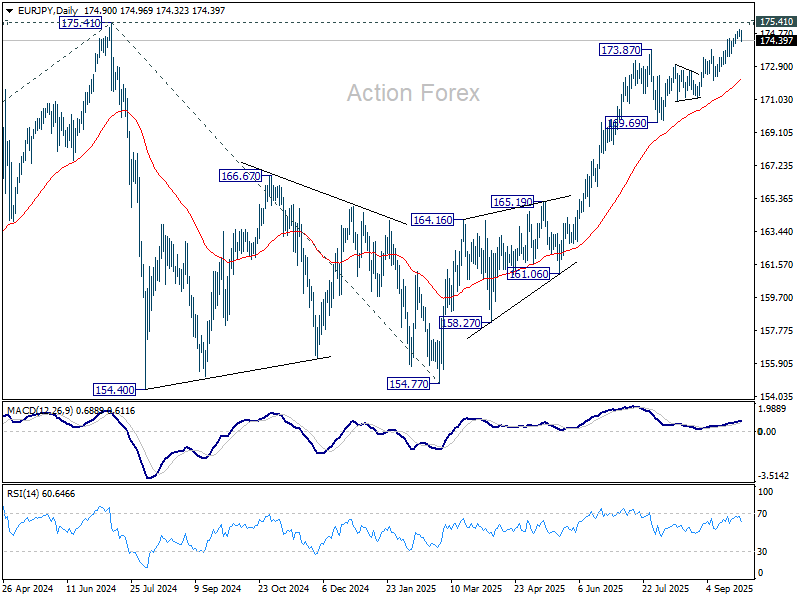
EUR/JPY Daily Outlook
Daily Pivots: (S1) 174.57; (P) 174.82; (R1) 175.15; More...
Intraday bias in EUR/JPY is turned neutral first with current retreat. Above 175..03 will resume larger rise to 175.41 high. Decisive break there will resume larger up trend. On the downside, however, firm break of 173.88 resistance turned support will turn bias back to the downside for deeper pullback to 172.11 support instead.
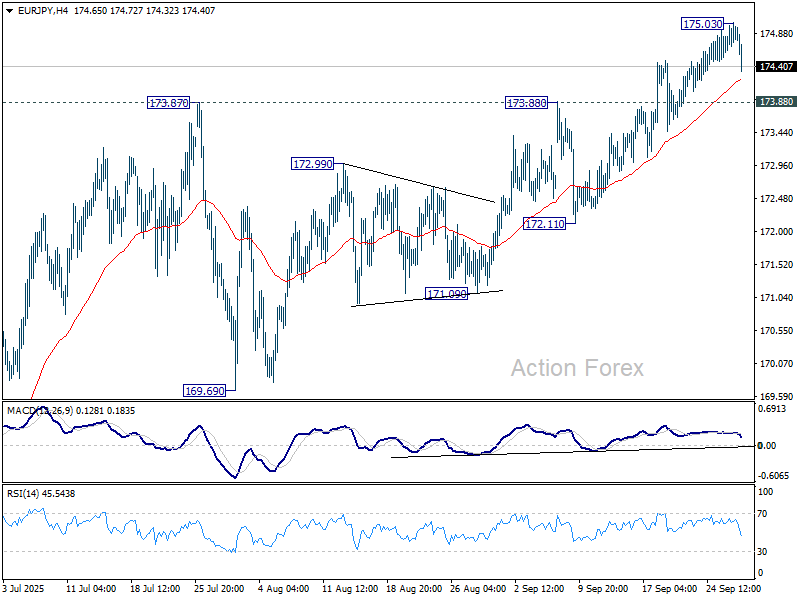
In the bigger picture, current rally from 154.77 is still tentatively seen as resuming the larger up trend. Firm break of 175.41 (2024 high) will confirm and target 61.8% projection of 124.37 (2022 low) to 175.41 from 154.77 (2025 low) at 186.31. However, sustained break of 55 D EMA (now at 172.15) will delay this bullish case, bring deeper pullback to 169.69 support first.
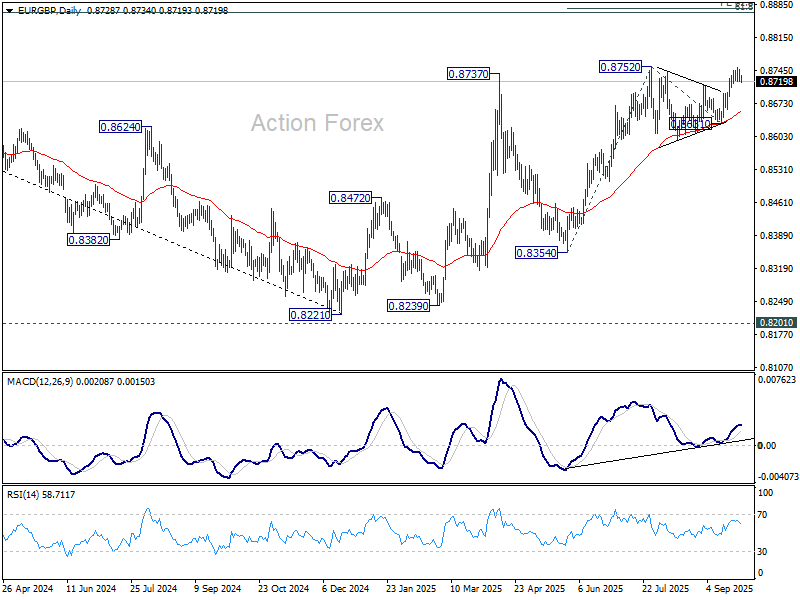
EUR/GBP Daily Outlook
Daily Pivots: (S1) 0.8718; (P) 0.8734; (R1) 0.8747; More...
Intraday bias in EUR/GBP remains neutral for consolidations below 0.8750. Further rally is expected as long as 0.8694 support holds. Firm break of 0.8752 will resume larger rally to 61.8% projection of 0.8354 to 0.8752 from 0.8631 at 0.8877, which is close to 0.8867 fibonacci level. However, break of 0.8694 will turn bias back to the downside for 0.8631 support instead.
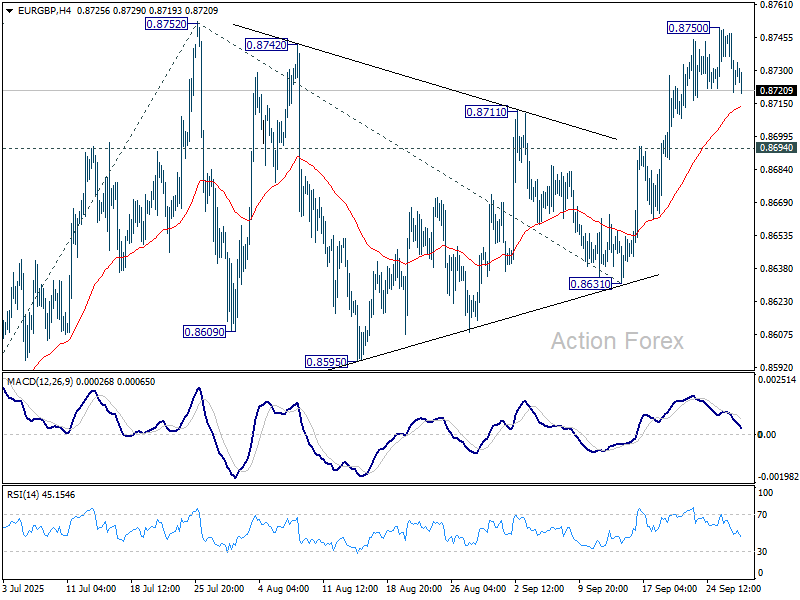
In the bigger picture, the structure from 0.8221 medium term bottom are not impulsive enough to suggest that it's reversing the down trend from 0.9267 (2022 high). But even if it's a correction, further rise could still be seen to 61.8% retracement of 0.9267 to 0.8221 at 0.8867. Nevertheless, sustained trading below 55 W EMA (now at 0.8533) will argue that the pattern has completed and bring retest of 0.8221 low.
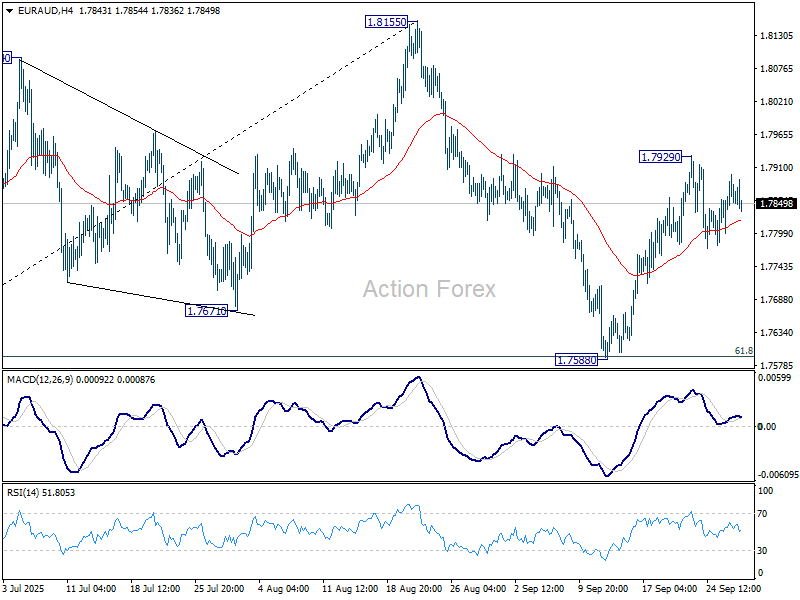
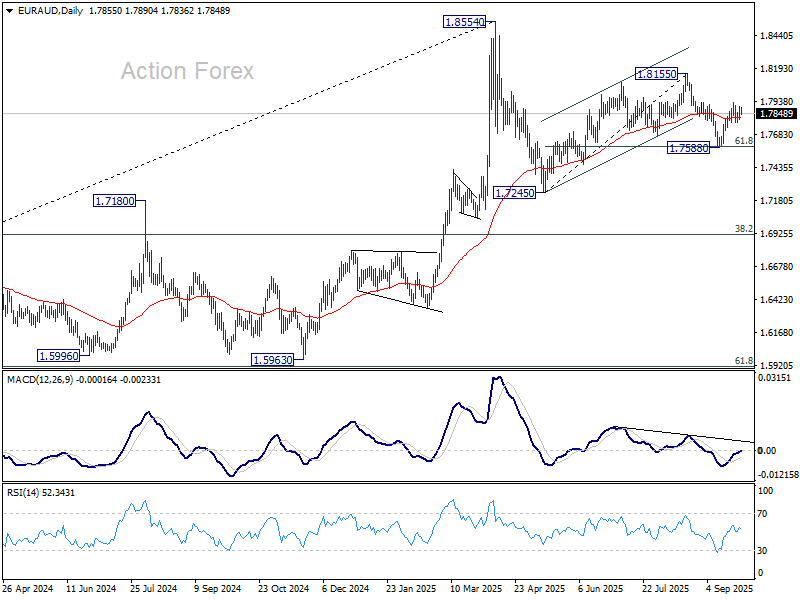
EUR/AUD Daily Outlook
Daily Pivots: (S1) 1.7823; (P) 1.7861; (R1) 1.7911; More...
Intraday bias in EUR/AUD stays neutral as consolidations continue below 1.7929. Pullback from 1.8155 could have completed at 1.7588 already, after defending 61.8% retracement of 1.7245 to 1.8155 at 1.7593. Above 1.7929 will resume the rebound from 1.7588 to retest 1.8155. However, sustained break of 1.7588 will bring deeper fall to 1.7245 resistance, as part of the corrective pattern from 1.8554 high.
In the bigger picture, price actions from 1.8554 medium term top are seen as a corrective pattern. Deeper fall could be seen as the pattern extends, but downside should be contained by 38.2% retracement of 1.4281 (2022 low) to 1.8554 at 1.6922 to bring rebound. Uptrend from 1.4281 is expected to resume at a later stage.
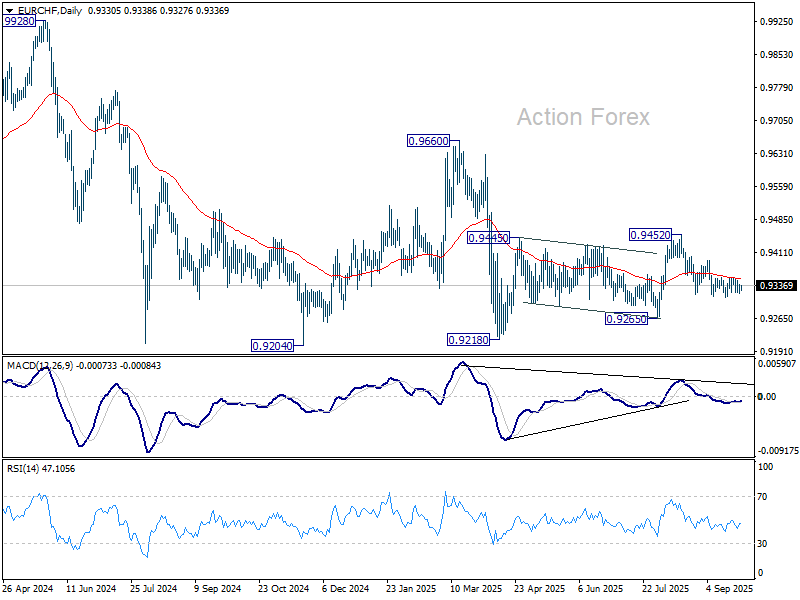
EUR/CHF Daily Outlook
Daily Pivots: (S1) 0.9328; (P) 0.9334; (R1) 0.9344; More...
Intraday bias in EUR/CHF stays neutral as range trading is still in progress above 0.9311. Risk is mildly on the downside as long as 0.9354 resistance holds. Break of 0.9311 will resume the fall from 0.9452 to 0.9265 support. Nevertheless, firm break of 0.9354 will turn bias back to the upside for 0.9452 resistance instead.
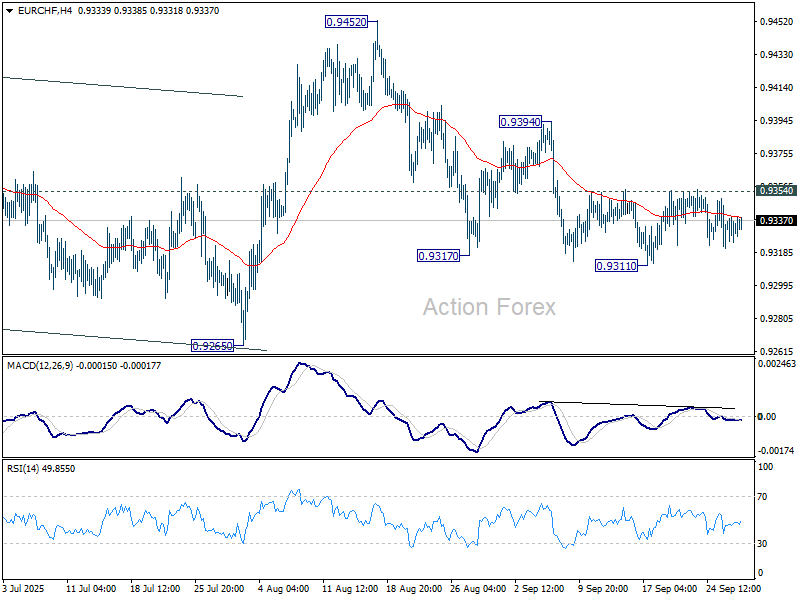
In the bigger picture, the down trend from 0.9204 (2018 high) might still be in progress considering that EUR/CHF is staying well inside the long term falling channel. However, with bullish convergence condition in W MACD, downside potential should be limited in case of another fall. Instead, firm break of 0.9660 resistance will be an important sign of medium term bullish trend reversal.
EMU Data Most Likely Won’t Challenge a Prolonged ECB Status-Quo
Markets
Consensus-matching August PCE deflators (headline 0.3% M/M and 2.7% Y/Y from 2.6%, core 0.2% and 2.9%) halted a technical rebound both in US yields and of the dollar last Friday. Personal income (0.4% M/M) and spending (0.6%) remained solid. Even so, with markets looking forward to this week’s labour data, the PCE provided little reason to further price out Fed rate cuts this year and early next year. US yields changed one bp or less across the curve. US yields in the meantime have created some ‘breathing space’ vis-à-vis the technical levels that were tested around the time of the September 17 Fed meeting (2-y 3.64% vs 3.50% area, 10-y 4.15% vs 4% support area). German yields in technical trading slightly outperformed with yields easing up to 2.7 bps at the belly of the curve. Risk sentiment remained constructive, with little overall impact from the new sector tariffs the US announced on Thursday. The S&P 50 gained 0.59%. The Eurostoxx 50 even added 1%. The (yield-driven) USD rebound on Wednesday and Thursday ran into resistance. DXY failed to test 98.83 resistance and even made a small step back to close the week in the established ST trading range (close 98.15). USD/JPY approached the 150 barrier (close 149.49). EUR/USD finished the week near the 1.17 big figure (vs a week low of 1.1646 on Thursday).
Asian risk sentiment stays constructive this morning. Aside from key eco data, markets also keep a close eye at a meeting between president Trump and Congressional leaders as they seek to reach an agreement on a short-term spending bill (by October 01) to avoid a government shutdown. Regarding the data, first national EMU CPI data will be published today (Spain, Belgium) and tomorrow (France, Germany, Italy …) to be summarized into Wednesday’s EMU release (expected 0.1% M/M and 2.2% Y/Y for headline, 2.3% for core). The EMU data most likely won’t challenge a prolonged ECB status-quo. In the US, the focus evidently stays on labour market data (JOLTS , tomorrow), ADP on Wednesday, jobless claims on Thursday and the payrolls on Friday (if they are not delayed by a US government shutdown). The picture from the labour data will be complemented by the ISM’s (Wednesday manufacturing, Friday services) and by the conference board consumer confidence release. Data probably will have to be materially stronger than expected for markets to leave the idea of a follow-up Fed rate cut end next month. A halt in the US yields’ rebound and maybe some noise on a US government shutdown might also abort the most recent USD rebound. EUR/USD could return higher in the 1.1574/1.1919 range. In Japan, we keep an eye at the Tankan survey, as the BOJ MPC internally debates the timing of the next rate hike, potentially coming as soon as the October 30 meeting. The yen last week tested key support near USD/JPY 150, with EUR/JPY (currently 174.5) only a whisker away from the 175.43 2024 multi-year top. In the UK, the Labour Party Congress in Liverpool will highlight the difficult fiscal balancing act of Chancellor Reeves, with key EUR/GBP resistance at 0.8769 still within reach.
News & Views
People familiar with the plans said that OPEC+ is likely to raise oil output again in November. The oil cartel is considering adding the same amount as they plan to do in October, i.e. 137k barrels a day. It’s technically restoring a layer of previous output curbs (of 1.66 million b/d) that was originally planned to remain in place through the end of this year. It has prompted warnings of a supply glut from the oil industry. So far, though, oil prices withstood the extra supply relatively well with OPEC+ delegates saying that the actual restored output is less than the amounts announced due to production constraints in some countries. Brent this morning holds steady around a two-month high just shy of $70. OPEC+ meets this Sunday.
Moldova’s pro-European ruling Party of Action and Solidarity secured 50% of the votes in yesterday’s ballot, putting president Maia Sandu on track for a second term in office. With the projected 54 seats in the 101-seat parliament, PAS doesn’t rely on support from other parties to form a government. The pro-Russian Patriotic Electoral Bloc won a little over 24% of the votes. Moldova, squeezed between Romania and Ukraine, has a population of just 2.4 mln but with an outsized geopolitical importance. The former Soviet state was granted EU candidate status, along with Ukraine, four months after the Russian invasion in 2022. Its goal is to join the EU by the end of the decade.