

Sample Category Title
Light Crude Oil (CL) Elliott Wave Outlook Points to Lower Prices
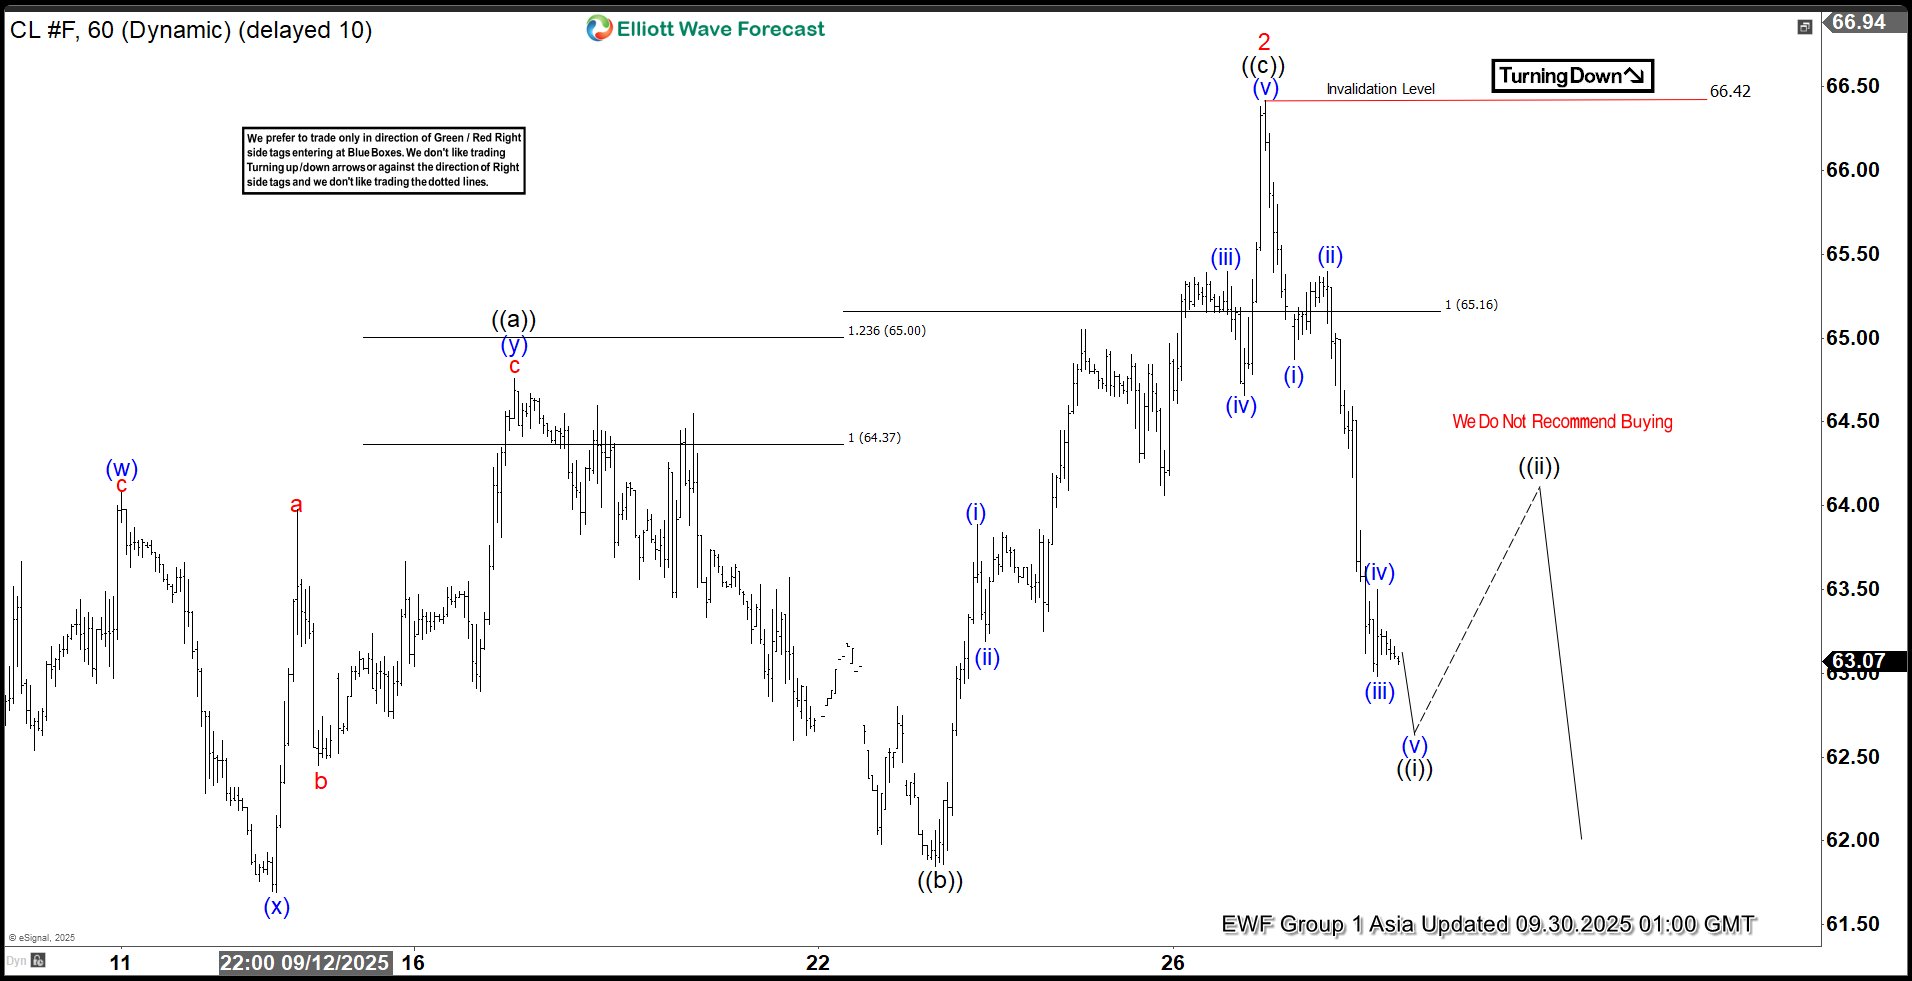
The short-term Elliott Wave structure in crude oil indicates a downward cycle from the June 23, 2025, high, unfolding as a five-wave impulse. Wave 1 concluded at $61.45, and wave 2 rallied to $66.42, as shown on the 1-hour chart. Wave 2 developed as a regular flat structure. From wave 1’s low, wave ((a)) peaked at $64.76. Wave ((b)) fell to $61.85, and wave ((c)) advanced to $66.42, finalizing wave 2.
Oil now declines in wave 3, structured as an impulse. From wave 2’s high, wave (i) reached $64.87, and wave (ii) corrected to $65.40. Wave (iii) dropped to $62.98, followed by wave (iv) at $63.50. Oil should extend lower in wave (v) to complete wave ((i)) of 3. Afterward, a wave ((ii)) rally will likely adjust the decline from the September 26, 2025, high in a 3, 7, or 11-swing pattern before resuming downward. As long as the $66.42 pivot high remains intact, near-term rallies are expected to fail in a 3, 7, or 11-swing sequence, leading to further declines. This structure suggests oil faces continued bearish pressure in the short term, with limited upside potential unless the pivot breaks.
Oil (CL) – 60 Minute Elliott Wave Technical Chart:
CL – Elliott Wave Technical Video:
https://www.youtube.com/watch?v=TCbc-eIu4ns
WTI Wave Analysis
WTI: ⬇️ Sell
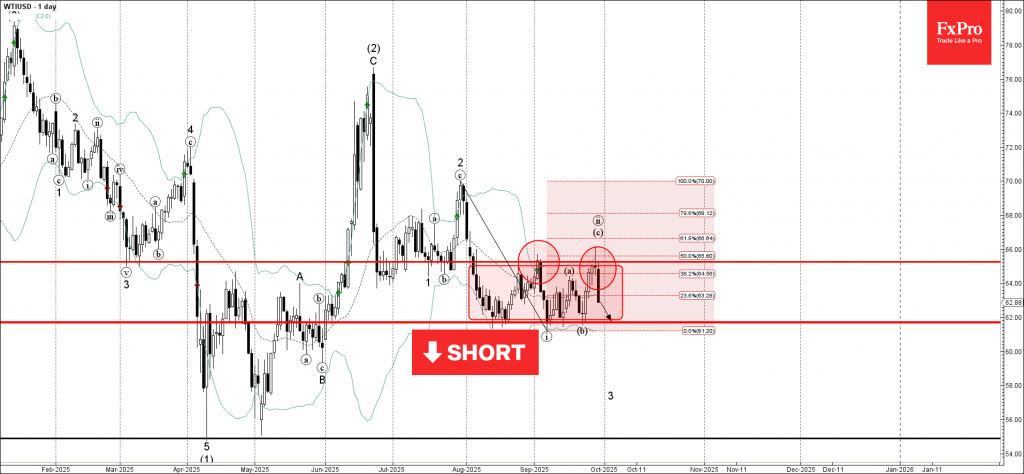
- WTI reversed from resistance level 65.25
- Likely to fall to support level 61.70
WTI crude oil recently reversed down from the the resistance area between the resistance level 65.25 (upper border of the active sideways price range from the start of August).
The resistance level 65.25 was strengthened by the upper daily Bollinger Band and by the 50% Fibonacci correction of the downward impulse from the end of July.
WTI crude oil can be expected to fall to the next support level 61.70 (lower border of the active sideways price range).
Silver Wave Analysis
Silver: ⬆️ Buy
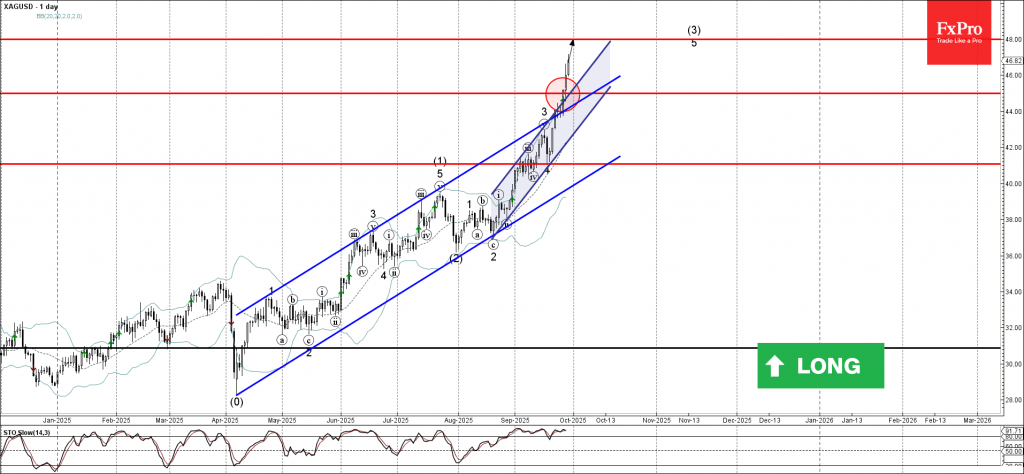
- Silver broke resistance area
- Likely to rise to resistance level 48.00
Silver recently broke the resistance area between the resistance level 45.00 (previous upward target set for Silver) and the resistance trendlines of the 2 up channels from August and April.
The breakout of this resistance area accelerated the active impulse wave 5 of the intermediate impulse wave (3) from July.
Given the strong daily uptrend, Silver can be expected to rise to the next resistance level 48.00 (target price for the completion of the active impulse wave 5).
Bitcoin Wave Analysis
Bitcoin: ⬆️ Buy
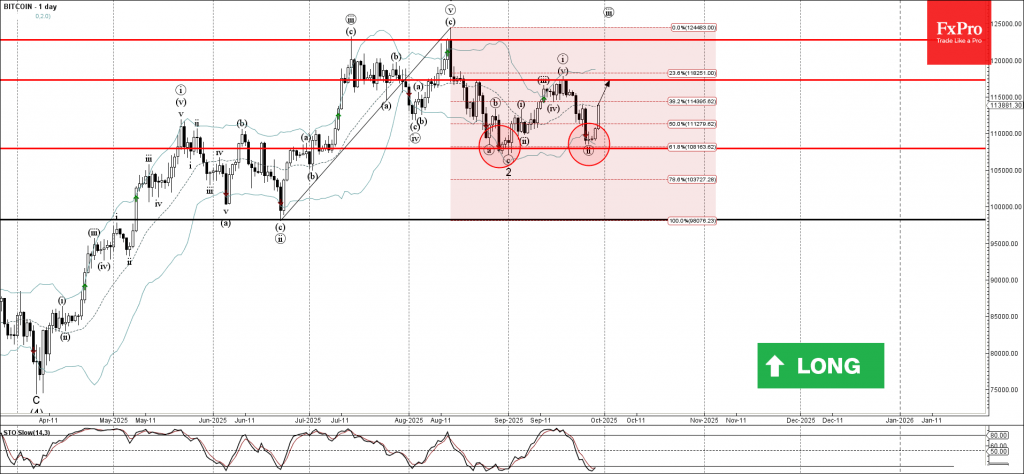
- Bitcoin reversed from support area
- Likely to rise to resistance level 117325.00
Bitcoin cryptocurrency recently reversed from the support area between the pivotal support level 108000.00 (which stopped two previous corrections a and 2 in August), lower daily Bollinger Band and the 61.8% Fibonacci correction of the upward impulse from June.
The upward reversal from this support area started the active short-term impulse wave iii of the intermediate impulse wave (5) from the start of April.
Given the clear daily uptrend and the still oversold daily Stochastic, Bitcoin cryptocurrency can be expected to rise to the next resistance level 117325.00 (which stopped earlier impulse wave i).
US Oil (WTI) Retreats After Yet-Another Failed Breakout
Price movements in the energy commodity markets are known to be volatile, with a huge number of factors influencing its supply and demand.
Between global economic activity fluctuating, OPEC+ countries trying to shake each others out, and persistent wars implying re-routed exports/imports, trying to understand each and every move is a daunting, almost impossible task.
But understanding movements is a task for historians, traders need to focus on the current course of action in an attempt to generate profits (and minimize losses that will always incur).
Over the preceding week, the Trump Administration repeated their discontent over Europe still purchasing Russian oil through different routes, pushing the joint economy to find alternatives.
This was a catalyst for a progressive yet explosive rise, taking prices from $62.20 lows on Monday to $67.80 highs Friday morning, a +7% move.
However, things would be too easy if they were as straightforward: A Friday morning selloff took the commodity down 2% from its highs, and the move is continuing today.
New export routes are re-opening with Iraq allowing Kurdish oil exports to Turkey after 2-and-a-half years of halt, adding even more supply to an oversupplied market.
Oil companies are seeing the pressure, with Total Energies announcing just a few moments ago they would sell their global assets and keeping only their Europe, US and Brazil postiions.
Let's dive into some key charts for WTI Oil.
US Oil (WTI) technical analysis
US Oil Daily Chart
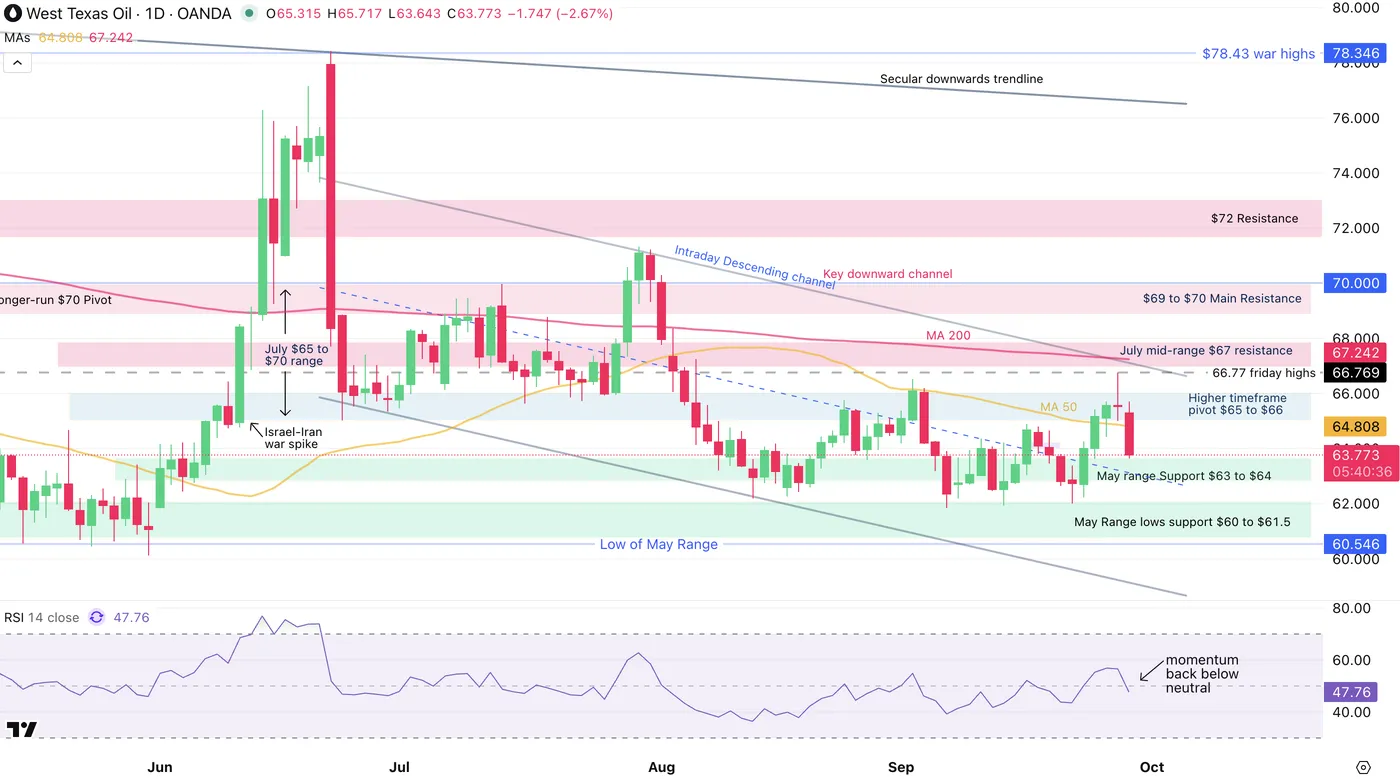
US Oil (WTI) Daily Chart, September 29, 2025 – Source: TradingView
Despite the more rangebound action, bears keep shoving breakout attempts and remain in technical control.
Since the June War spike correction, prices have been forming downward steps in a consolidation - failed breakout - lower rejection pattern.
Prices are now back to test the May range highs that has been acting as key support, but will be subject to a momentum goes into bearish territory and the action still evolves in a downward channel.
Reactions to the current levels will be key to spot if buyers can generate a higher-low in prices. Failing to do so would confirm the ongoing $62 to $66 solid range.
Let's take a closer look to get more details.
US Oil 2H Chart and levels
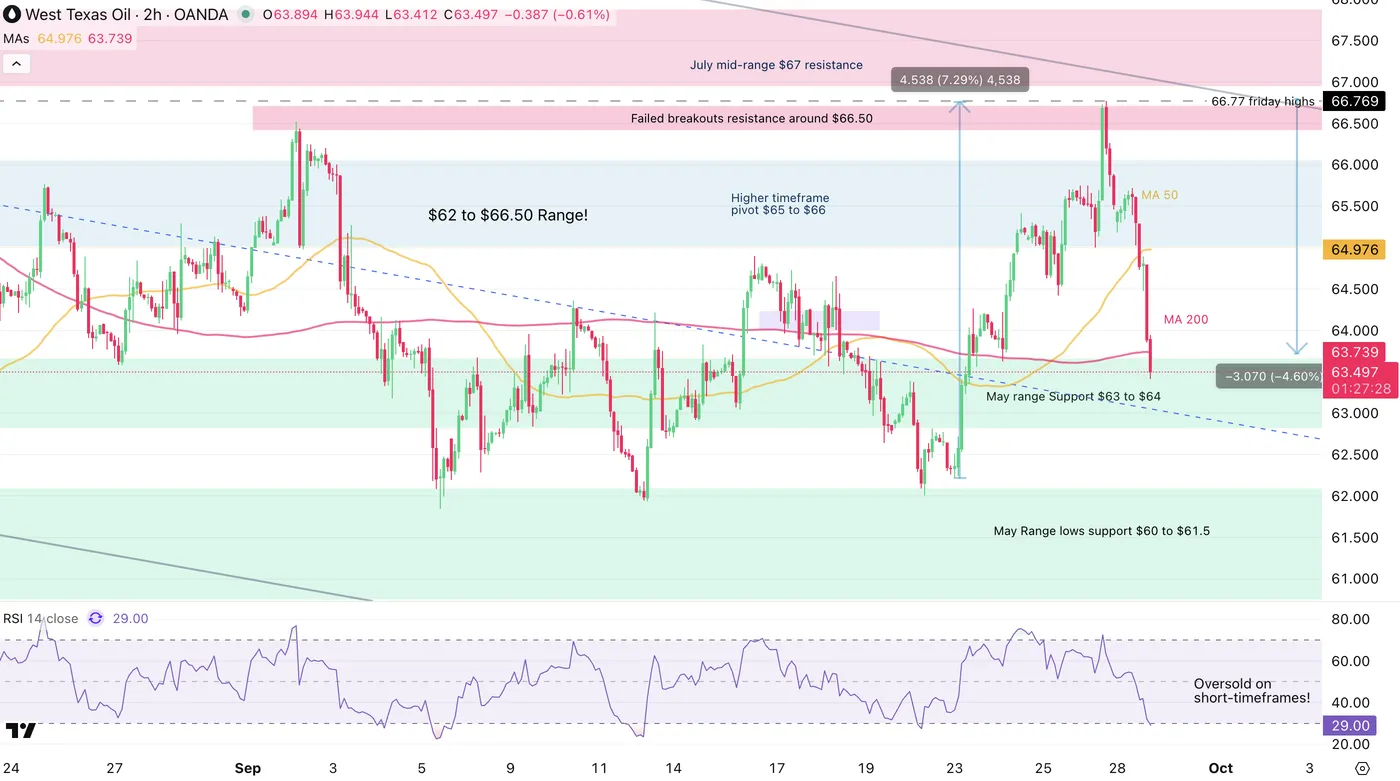
US Oil (WTI) 2H Chart, September 29, 2025 – Source: TradingView
Our preceding oil market analysis had spotted a touch of the channel lower bound leading to a triple bottom rebound.
However, the new supply channel news have scared bulls again even before reaching the highs of the downward channel seen on the daily chart.
Momentum is now reaching oversold levels and reactions are now to be monitored closely.
With the $63 to $64 support zone coming into play, bulls will have to hold to maintain a more balanced technical outlook.
Failing to do so may lead to a repeat of the failed breakout into new lows pattern.
Levels to place on your WTI charts:
Resistance Levels
- Higher timeframe pivot $65 to $66
- Mini resistance $66.50
- Shorter timeframe Consolidation Highs ($64.35 to $65 testing)
- 50-Day MA $65.00
- July mid-range $67 resistance
Support Levels
- $63 to $64 support zone
- Shorter timeframe Consolidation Lows ($62 to 62.50)
- September lows $61.84 to $62
- $60.5 Low of May Range
Gold (XAU/USD) Soars to Fresh All-Time Highs in Today’s Session – Potential Targets and Price Forecast
Trading at $3825.41 per troy ounce in today’s session, up a remarkable +1.74%, gold (XAU/USD) has once again renewed all-time highs, further extending yearly gains.
As things stand, the yellow metal is on pace for its best yearly performance since 1979, up an astounding +45.75% year-to-date.
Let’s examine the market fundamentals alongside some likely price targets in the upcoming sessions.
Gold (XAU/USD): Key takeaways 29/09/2025
- Benefitting from a ‘perfect storm’ of macroeconomic factors, gold pricing has rallied to new highs in today’s session, and crucially, has broken above the key level of $3,800 for the first time in history.
- While gold prices have been rising throughout 2025, a more dovish Federal Reserve has given a new lease of life to the current uptrend, alongside a general depreciation in the US dollar’s value this year.
- General market risk aversion, owing to geopolitical tensions, US trade policy, and questions over sovereign debt, continues to contribute to the current rally in precious metal pricing.
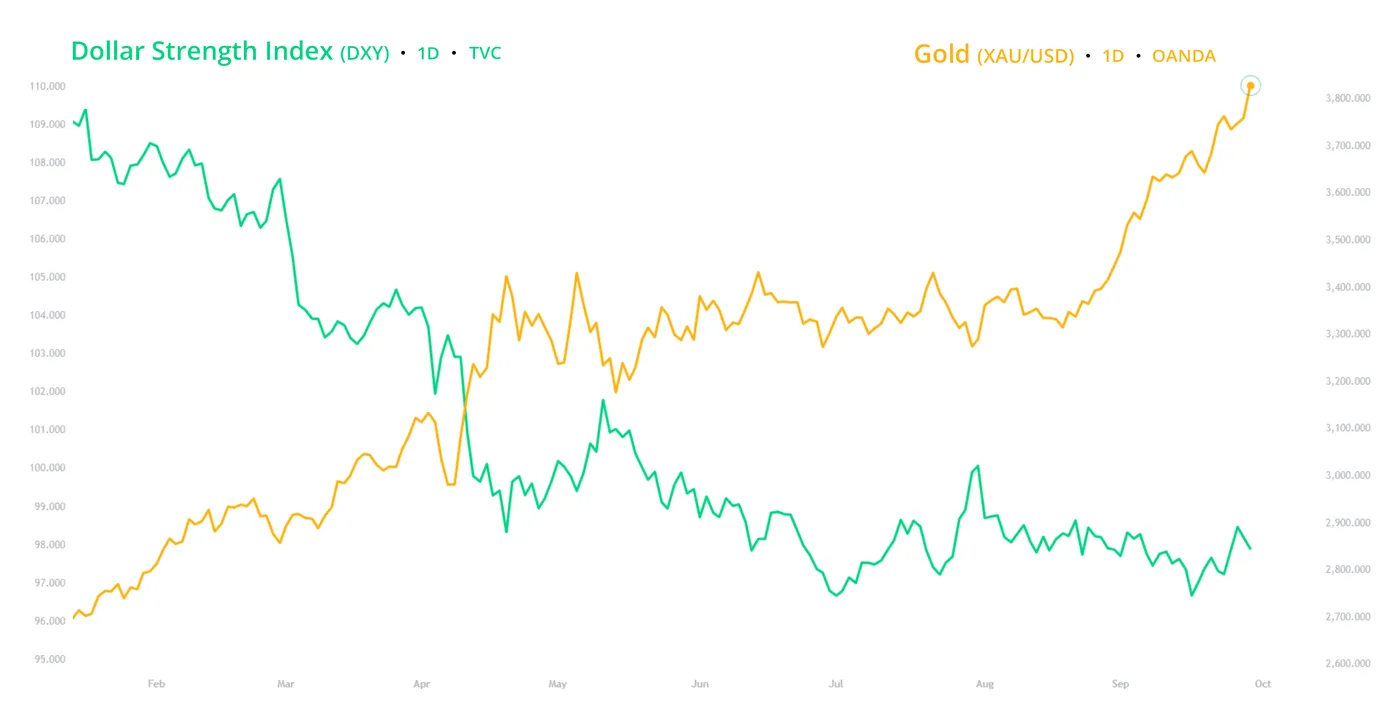
Dollar Strength Index (DXY) vs. Gold (XAU/USD) year-to-date. OANDA/TVC, TradingView, 29/09/2025
Gold renews highs, breaking above $3,800 for the first time in history
To say 2025 has been a good year for precious metals would be an understatement.
While both gold and silver are on track for their best yearly performance in quite some time, this trend shows little sign of stopping as we approach the final quarter of 2025.
To refresh your memory, here’s a quickfire round of three fundamental themes that have contributed to the current rally:
- Dovish Federal Reserve pivot: Despite a majority hawkish Fed for much of the year, gold continued its rally to new highs in 2025. More recently, however, a more dovish narrative, both from the reduction in the funds rate and commentary from Federal Reserve policymakers, has introduced a new tailwind to precious metal pricing, with lower interest rates directly benefitting non-yielding assets like gold. At the time of writing, markets overwhelmingly predict that the two remaining decisions of 2025 are likely to be in favour of further rate cuts:
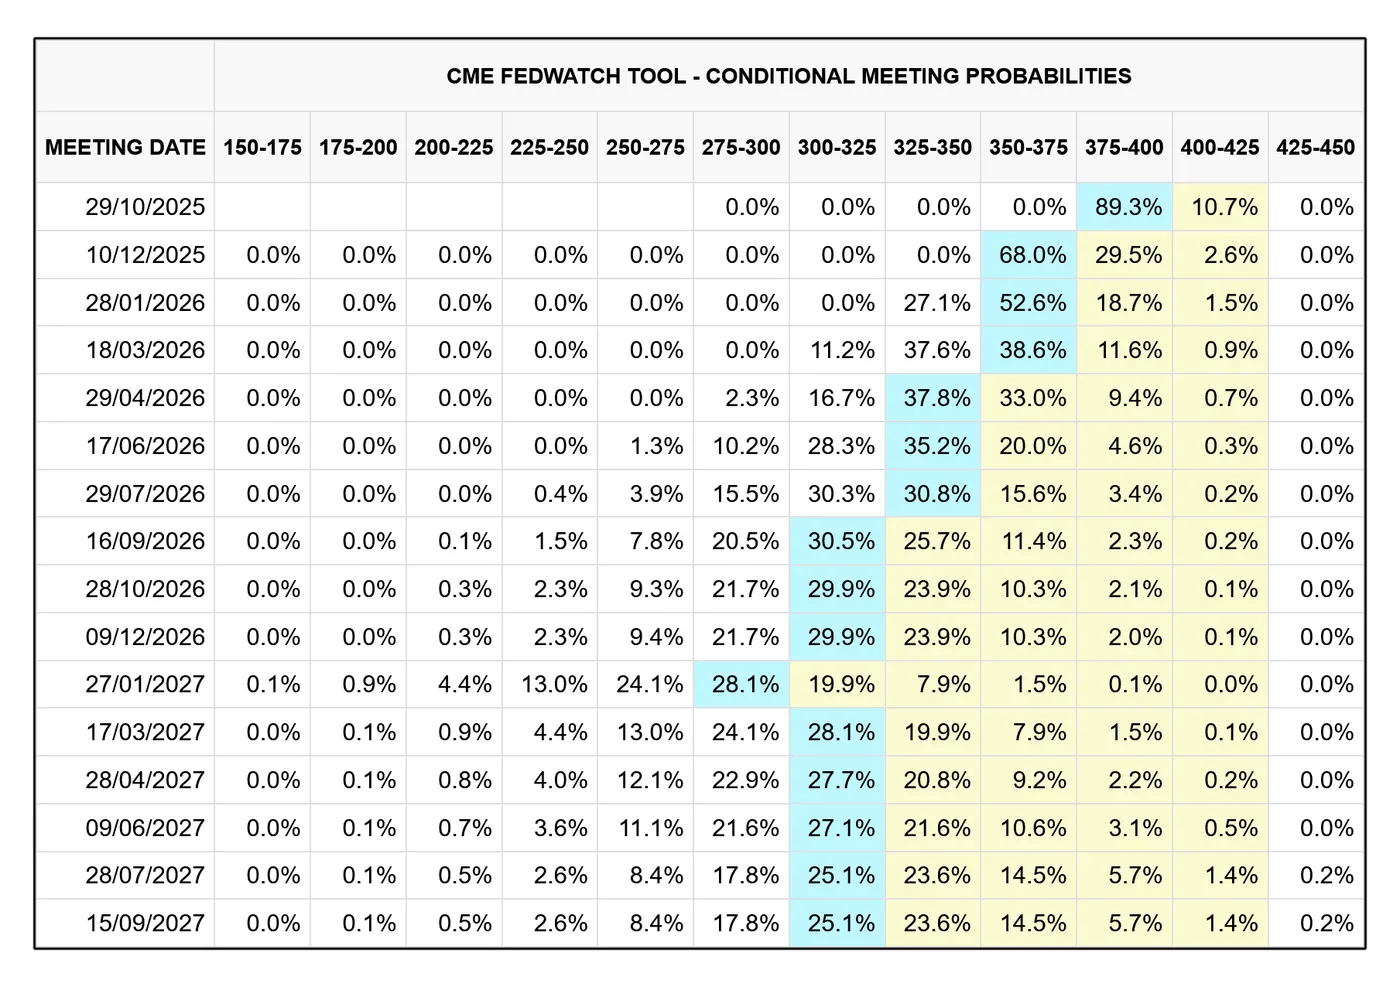
CME FedWatch, 29/09/2025
- The fallout of dollar devaluation: Typically priced in USD, it seems intuitive that if the value of the dollar falls, precious metal prices will rise. While there is some truth to this, a broad-scale devaluation of the dollar, especially following concerns about sovereign debt, provides a larger catalyst to increasing gold prices than purely exchange rates alone. Ultimately, markets feel less comfortable this year using the dollar as a store of wealth than in years previous, opting for gold instead, and further compounding the effect of falling dollar pricing.
- Safe-haven inflows: While I use the term ‘safe-haven’ somewhat loosely, considering US equities have consistently pushed higher throughout 2025, a persistent feeling of economic uncertainty has made valuable contributions to the current rally in gold pricing. While recent rallies can be somewhat attributed to monetary policy expectations, demand for a secure store of wealth has steadily risen this year, with gold, silver, and the Swiss franc among the best-performing instruments of 2025 within their respective asset classes. This effect has been further amplified by considering that the safe-haven appeal of other major currencies, such as the dollar and the yen, is comparatively lower than it has been in recent memory.
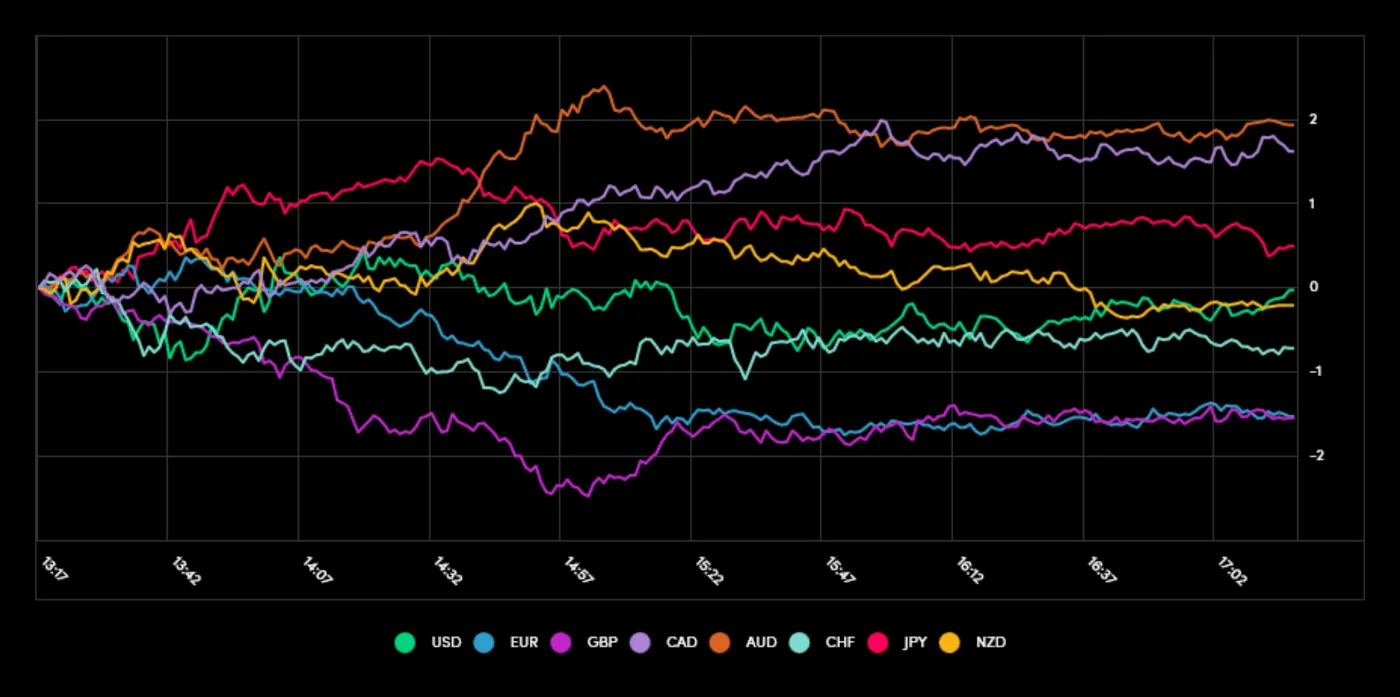
Currency Power Balance, 4H, OANDA Global Markets, 29/09/2025
Gold (XAU/USD): Technical Analysis 29/09/2025
As promised, let’s take a look at market technicals, starting with the daily, then moving on to the 4-hourly.
Gold (XAU/USD): Daily (D1) chart analysis (29/09/2025)
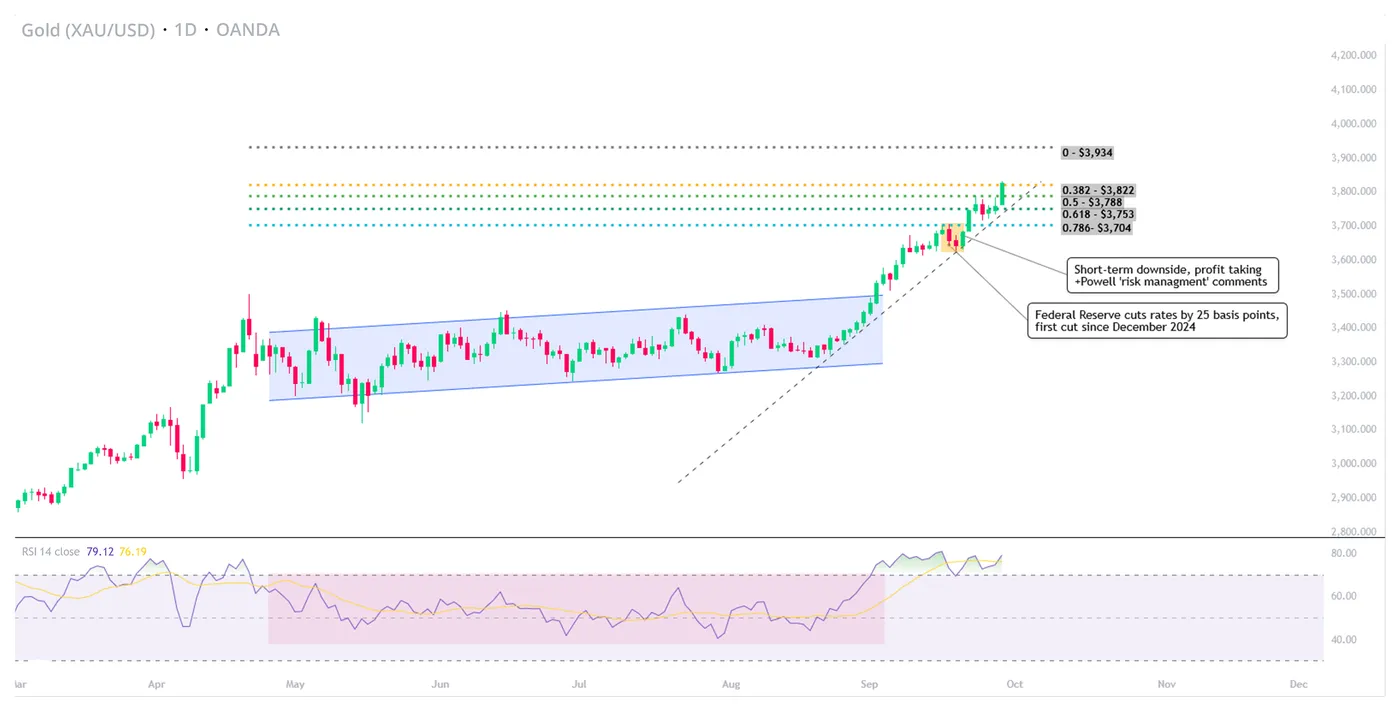
Gold (XAU/USD) D1, OANDA, TradingView, 29/09/2025
For gold bulls, current price action on the daily chart is nothing short of picture-perfect.
Blasting through multiple key levels throughout 2025, most significantly the $3,000 mark first achieved in early March, gold pricing currently trades in excess of $3,800 per troy ounce for the first time in history, growing ever closer to $4,000.
Having found a base of around $3,250, forming a slight upwards trending channel, price action in early September would break this period of consolidation and mark the start of the current rally, which, at least so far, shows little sign of exhaustion.
With that said, we are currently in ‘overbought’ territory according to the RSI and trade some distance from the trendline, suggesting that short-term retracements are possible if the uptrend wishes to continue.
As ever, data suggesting the Federal Reserve outlook is to become more dovish will likely support metal pricing further, with the opposite being true if the Fed is seen to become more hawkish ahead of their October decision.
In line with Fibonacci theory, here are some key levels to watch:
- Price target: 0% Fib - $3,934
- Support 1: 50% Fib: $3,788
- Support 2: 61.8% Fib: $3,753
- Support 3: 78.6% Fib: $3,704
Otherwise, and when considering current conditions, price would have to fall considerably and break support held around $3,643 to question the longevity of the current move to the upside.
Gold (XAU/USD): 4-hourly (H4) chart analysis (29/09/2025)
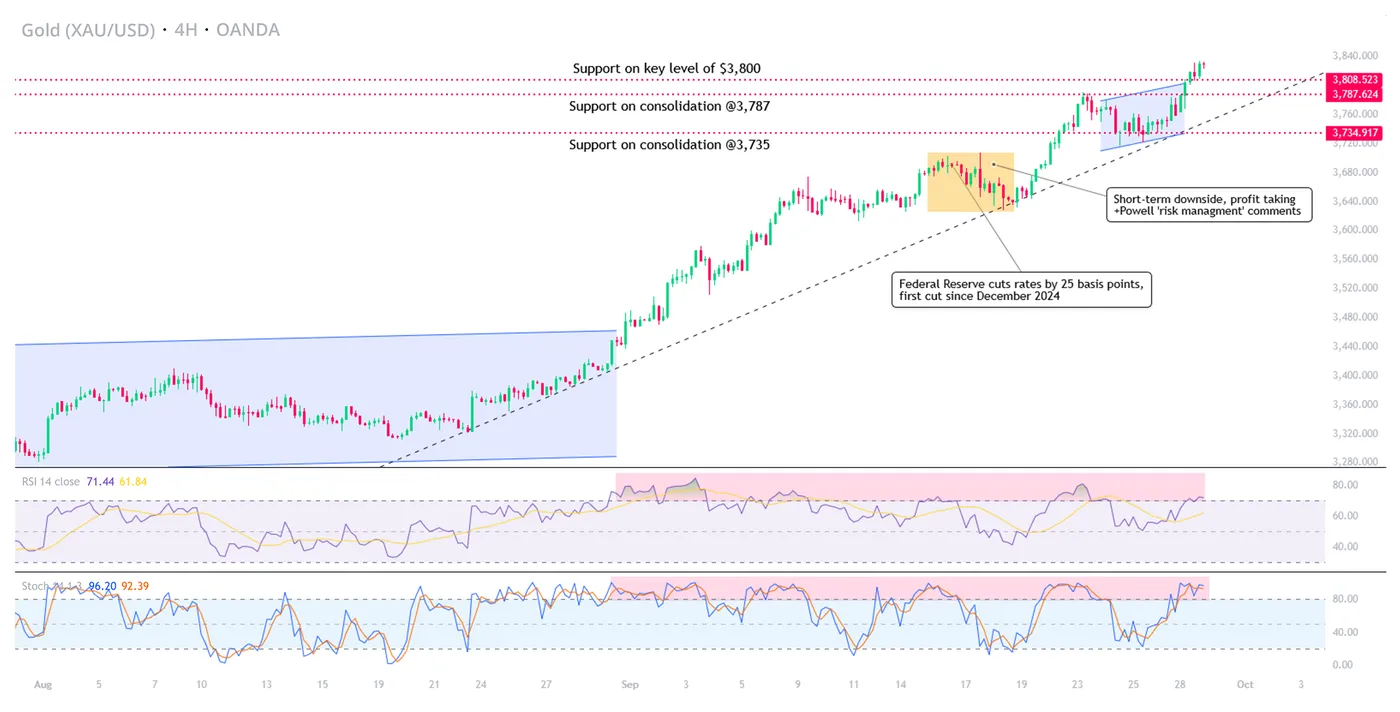
Gold (XAU/USD) H4, OANDA, TradingView, 29/09/2025
With gold once again meeting all-time highs in today’s session, there is nothing above current price action to form a resistance to the current upside, while there is plenty to support to be found should price form a short-term correction.
- Support 1: $3,800 key psychological level
- Support 2: $3,787 major support on previous resistance turned support
- Support 3: $3,735 major support
While predicting further upside can be tricky, considering the quite literally uncharted territory, current readings from both the Stochastic and RSI oscillators suggest that a price is currently ‘overbought’, and due for a retracement towards the trendline.
Albeit unlikely, considering current conditions, if price falls below the third level of support, this could spell trouble for the current uptrend.
Bitcoin Climbs 5% from Recent Lows But Crypto Rally Lacks Depth
Bitcoin has been rallying back slowly but steadily since reaching an intermediate bottom last Friday at $108,600 (it is currently trading about $5,000 higher, or close to 5%).
Risk assets are enjoying a mixed but decent session for the most part, particularly in the tech sector. The sentiment is spreading to cryptocurrencies, but here's the catch:
Only the most significant altcoins by market cap are up or around unchanged in today’s session, while smaller altcoins are selling off.
UPDATE: Everything rallied towards the final hours in the afternoon with bulls pushing the key coins above their recent downward price action like ETH, SOL and AVAX, the leader of today's board. Bitcoin surpassing $114,000 might have had something to do with the better mood.
The Bitcoin analysis is of course still relevant in case one may ask.
Early afternoon Crypto Market
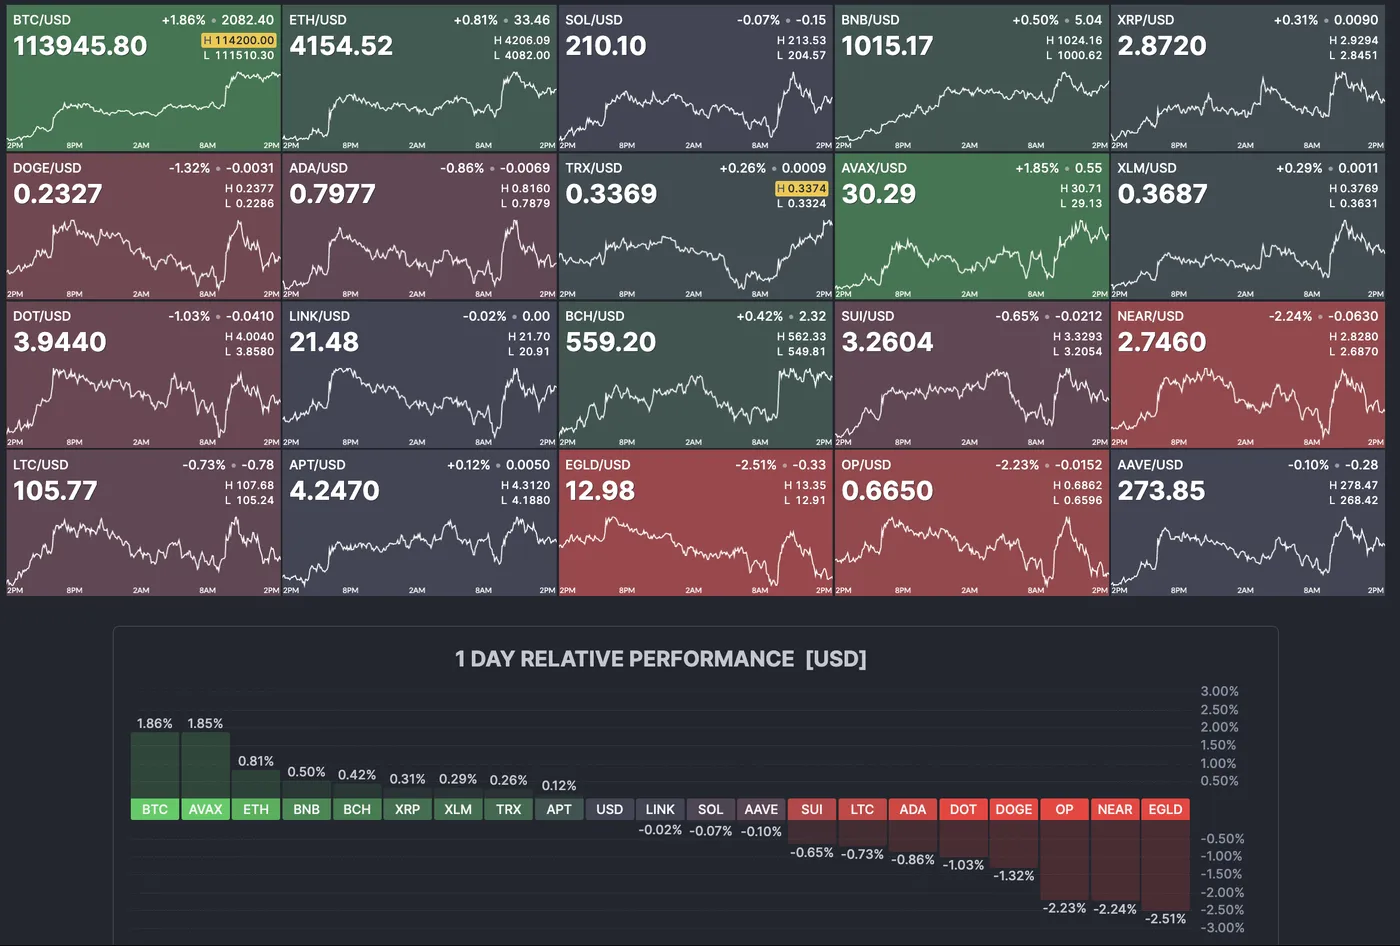
Daily overview of the Crypto Market (14:41 ET), September 29, 2025 – Source: Finviz
Update to the current state of the crypto Market (16:54)
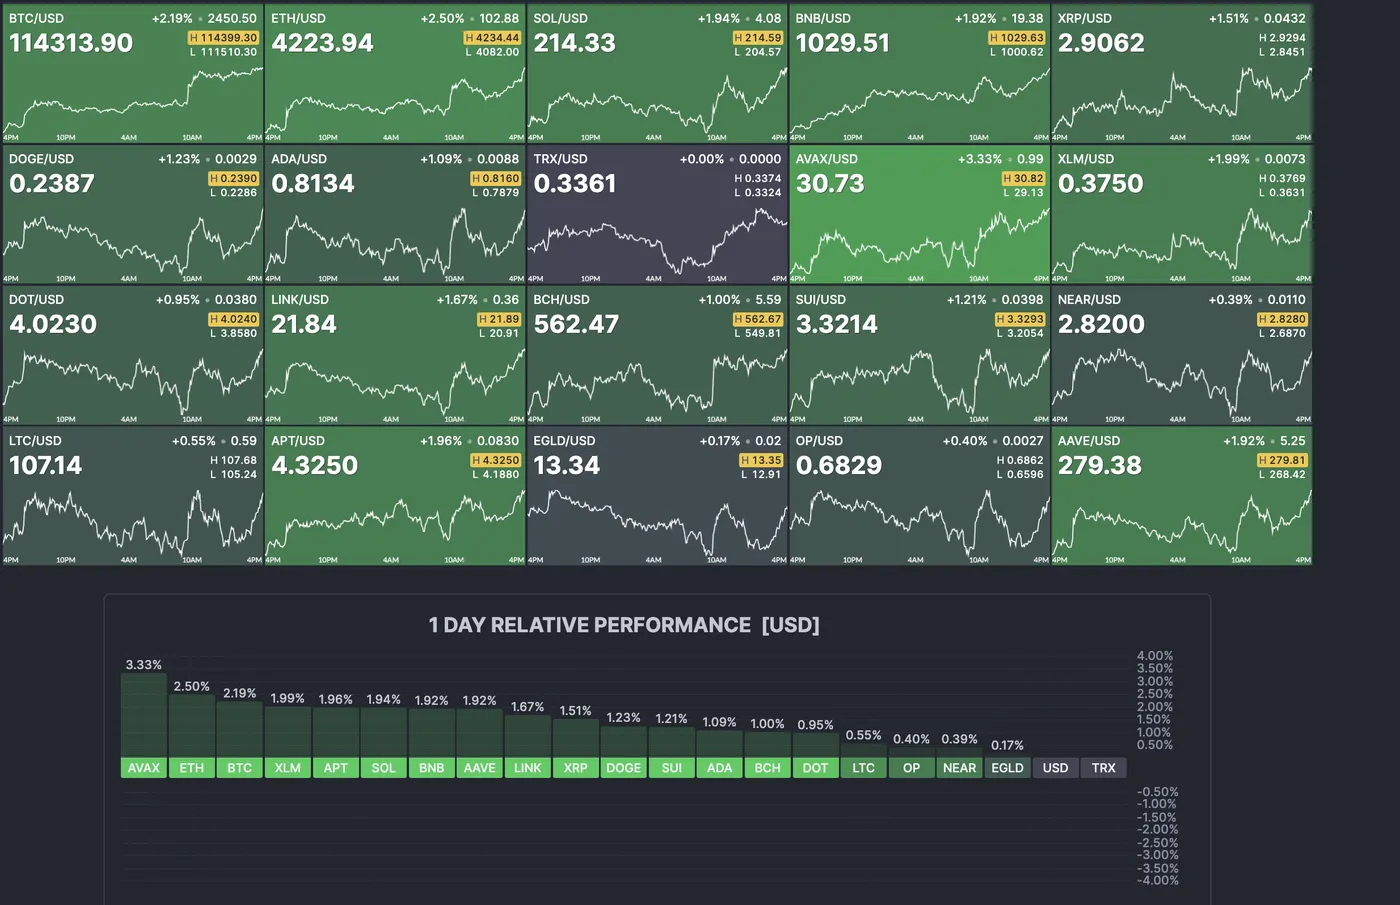
Daily overview of the Crypto Market (16:54 ET), September 29, 2025 – Source: Finviz
Memecoins are also caught in the mix, providing a fairly unusual outlook for the digital asset market – even on differing scales, cryptos tend to move in tandem.
Market depth is when a general market gets dragged upwards, and most of the components of the market are also rallying.
A lack of depth is seen when only a few names drag the asset class.
This was seen in Equities throughout the first part of the 2023 rebound, when the Mag 7 dragged the market higher before the bull market spread elsewhere, and today, cryptos are doing the same.
Let's take a look at Bitcoin to see what's going on there.
A multi-timeframe Bitcoin technical analysis
Bitcoin (BTC) Daily chart
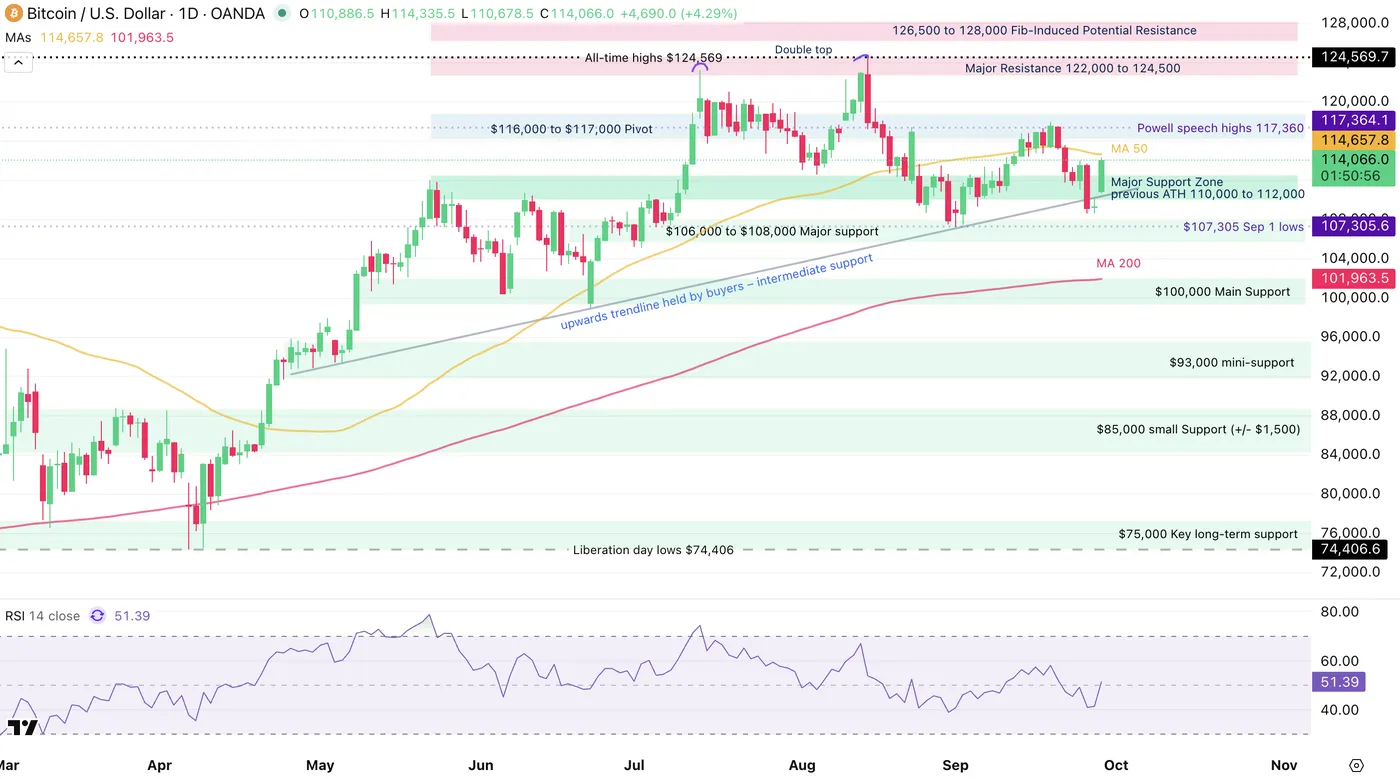
Bitcoin (BTC) Daily chart, September 29, 2025 – Source: TradingView
The latest rebound has taken Bitcoin out of a less-favorable price action, but there is still work to to:
A double-top marked just after marking a new ATH showed a weak acceptance of the $120,000 level, which tends to be a sign of consequent reversal in technical analysis.
The market holding around $110,000, the preceding all-time highs, was a sign of decent appetite and a healthy pullback overall.
However, markets then formed lower highs after the Powell's Jackson Hole speech which also got rejected quite aggressively.
Let's now turn to today: The $107,800 lows marked on September 1 faked-out below the key support before rallying again, and today's rebound marks a higher low, inverting the bearish sequence.
One positive aspect to look for later is that momentum (RSI) is now far from overbought and going back towards positive from just below neutral.
Bulls will have to break above the current range, let's see the details of that range just below.
Bitcoin (BTC) 4H chart and levels
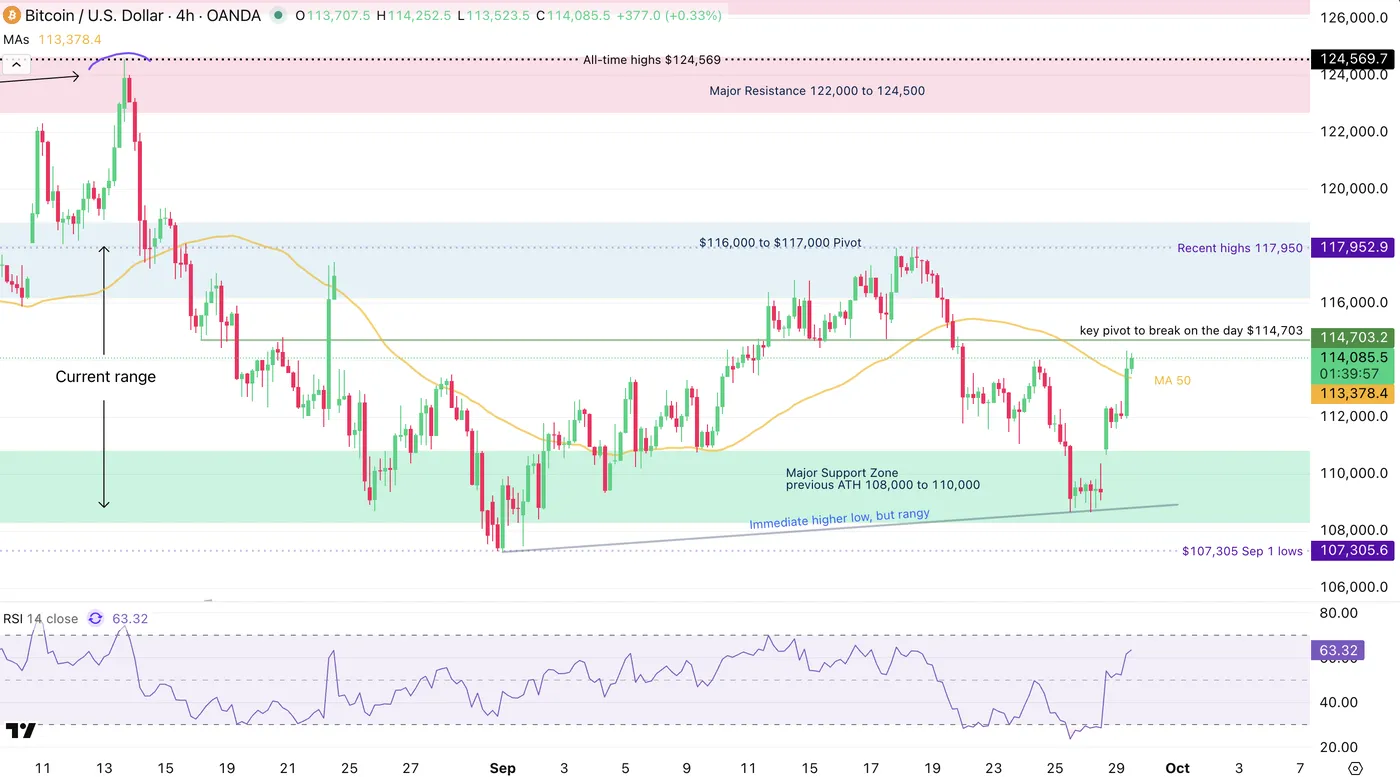
Bitcoin (BTC) 4H chart, September 29, 2025 – Source: TradingView
Despite the price action from today, the outlook is more one of a range rather than a continuation of the preceding trend.
But consolidation is still a good sign for the overall market, as holding above $100,000 marks price and volume confirmation, where participants agree at prices that are way superior to preceding years.
Breaking above the most recent $117,500 high would relaunch the odds of reaching higher levels.
Bears may enter on a break of the most recent lows ($107,600 on September 1).
Levels to place on your BTC Charts:
Support Levels:
- $108,000 to $110,000 previous ATH support zone (freshly tested)
- $107,600 recent lows
- $106,000 to $108,000 key support
- $100,000 main support at the psychological level
Resistance Levels:
- $116,000 to $117,000 key pivot (high of current range)
- $117,950 recent highs to break
- Current all-time high $124,596
- Major resistance $122,000 to $124,500
- $126,500 to $128,000 Fib-extension potential resistance (1.382% from April to May up-move)
Safe Trades!
Sunset Market Commentary
Markets
UK Chancellor Reeves addressed the Labour Party conference in Liverpool against the backdrop of crashing polling rates and the looming November 26 Autumn Budget event. Yougov projected last Friday that Labour would only gain 144 seats in the 650-seat parliament compared with their 411 election victory. Reeves warned that harsh global headwinds will force her to make more controversial decisions later this year. The world has changed, citing global instability, trade barriers and borrowing costs. The Chancellor (and PM Starner) confirmed that Labour’s manifesto commitments with regard to tax hikes still stand. That means no increases in key taxes that working people pay (VAT, national insurance and income tax rates). She refused to rule out other forms of tax increases such as adjustments to tax thresholds, indirect taxes and business taxes to help plug a £30bn budget shortfall to balance her core fiscal rules. The chancellor also revealed that she would make the Office for Budget Responsibility (OBR) only publish one forecast a year rather than two as two full forecasts make it harder to have the one fiscal event per year she promised. Today’s speech didn’t move the needle in UK markets. Gilts follow a global bull flattening trend with UK yields unchanged at the front end of the curve and up to 4 bps lower at the very long end (30-yr). EUR/GBP treads water around 0.8735, holding close to the YtD high at 0.8769.
Bank of Japan board member Noguchi said that various economic indicators for Japan show steady progress in achieving the 2% inflation target. This suggests that the need to adjust the policy rate is increasing more than ever. His words carry quite some weight as the dovish board member dissented against the BoJ’s first two rate hikes this cycle in March and July of last year. The market implied probability of a rate hike at the end of next month (to +0.75%) increases further to 66%. In September, two BoJ members (9-member board) already backed a rate hike proposal. Minutes of that meeting (tomorrow), speeches by deputy governor Uchida (Thursday) and governor Ueda (Friday) and the quarterly Tankan survey (Wednesday) could be pivotal this week in further cementing rate hike bets. The Japanese yen profits today with USD/JPY moving away from the psychologic 150-mark and EUR/JPY calling off a test of the all-time high at 175.43.
News & Views
Belgian inflation decreased by 0.3% M/M in September, but the Y/Y-measure rose from 1.91% from 2.12% due to a sharper monthly decline last year (-0.5% M/M). Core inflation (ex-energy products and unprocessed food) also rose from 2.3% in august to 2.61%. Inflation for services basically held a similar yearly pace (3.47% Y/Y from 3.48%) as was the case for rents prices (3.97% from 3.96%). Inflation for food products (including alcoholic beverages) accelerated from 2.42% Y/Y last month to 3.32% . Food prices also added 0.46 ppts to the overall yearly inflation figure. In a monthly perspective, the main price increases in September concerned clothing (+ 3.1% M/M) as well as travels abroad and city trips (2.4%). However, holiday villages (-12.5%), plane tickets (-14.8%), hotel rooms (-8.3%) , motor fuels (-1.3%), personal care (-1.8%), natural gas (-1.1%) and electricity (-0.7%) had a decreasing effect on the index. The first inflation estimate according to the European harmonized index of consumer prices (HICP flash estimate) amounts to 2.7% in September 2025 (was 2.6% in August).
RBNZ chief economist Conway commented on an update to recommendations from the 2022 policy review. This progress report is released alongside an interim assessment of the recent tightening cycle. Conway states that “the MPC has gained valuable insights into how economic activity, price setting by businesses, and inflation expectations evolve during periods of high inflation and economic volatility”. The RBNZ now has a deeper understanding of supply shocks and structural drivers of inflation. They expanded the use of high-frequency data for more timely and granular monitoring. The RBNZ also developed new tools to estimate neutral interest rates and run scenario analysis. These improvements ensure the MPC is well equipped to navigate future shocks. In evaluating the policy response to 2021-24 above target inflation, a review states that the MPC’s strategy helped reduce inflation from its peak in 2022 and returned it to within the 1 to 3% band by September 2024. This strategy kept inflation expectations near target, but, in hindsight, an earlier or more aggressive tightening might have delivered better outcomes. Regarding communication, improvements can still be made on the interpretation of the forward OCR track.
BoE’s Ramsden confident on disinflation outlook, supports gradual policy easing
BoE Deputy Governor Dave Ramsden said today that the UK’s labor market continues to loosen, with wage growth normalizing and supporting the disinflation process. He noted that while inflation pressures had been substantial, the Bank’s forecast for a temporary rise in CPI to 4% in September was likely to mark the peak.
Ramsden expressed confidence that inflation will return to the 2% target under current restrictive policy settings, aided by market expectations already factored into the Bank’s forecasts.
He added that the MPC’s “gradual and careful” strategy remains the right approach. Looking ahead, Ramsden said there remains “scope for further removal of policy restraint.”