Sample Category Title
Gold Prices Plunge from Historic Peak
As shown by the XAU/USD chart, yesterday gold prices reached a new all-time high, surpassing the $3,870 level for the first time. This rise was supported by concerns over the high likelihood of a US government shutdown.
According to media reports:
→ Vice President J.D. Vance stated that the US is heading towards a government shutdown, blaming the Democrats.
→ “We have very large disagreements,” said Senate Minority Leader Chuck Schumer.
Fears over the potential impact of a shutdown boosted demand for safe-haven assets, including gold. However, today XAU/USD has dropped sharply. What might this mean?
Technical Analysis of the XAU/USD Chart
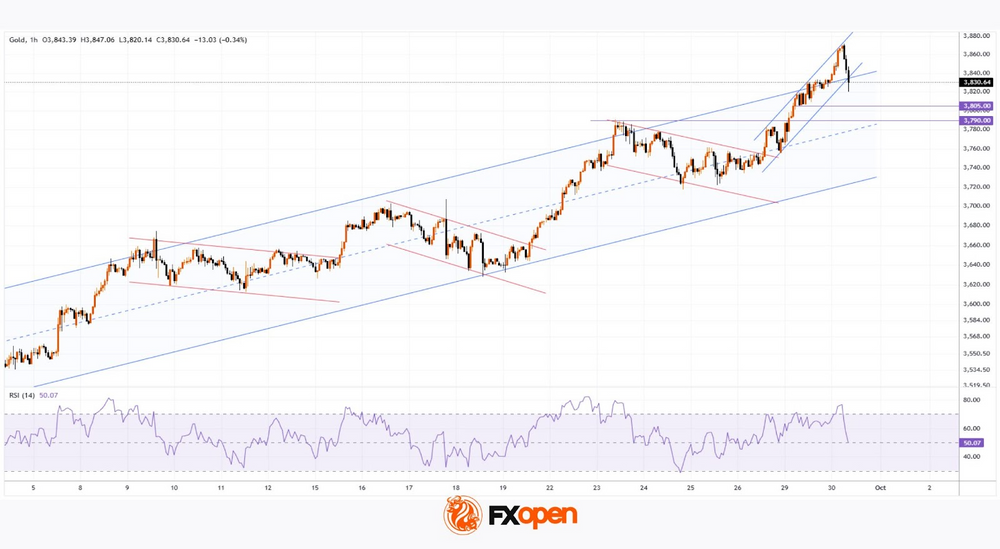
In our previous analysis of gold prices, we drew an ascending channel, which remains intact.
Within the context of this channel, it is worth noting that each time the price exceeds its upper boundary, this tends to trigger a correction, a consequence of the market being overbought (in most cases confirmed by the RSI indicator).
Yesterday, during heightened activity in the US trading session, gold prices moved significantly above the upper boundary of the channel, leaving the market vulnerable to a correction. For this reason, today’s decline during the European session can be explained by traders reassessing risks, as well as profit-taking after a rise of more than 11% since the start of the month.
Note the speed of the decline — it indicates strong conviction among the bears. Overall, yesterday’s rise combined with today’s sharp fall can be interpreted as a bearish engulfing pattern. This strengthens the case for a deeper correction towards the psychological $3,800 level, where the median of the channel lies (possible support levels are marked in purple).
Therefore, it is possible that bulls exhausted their momentum yesterday, and for an upward trend to resume, another consolidation period with the formation of a “bull flag” pattern may be required.
Start trading commodity CFDs with tight spreads. Open your trading account now or learn more about trading commodity CFDs with FXOpen.
This article represents the opinion of the Companies operating under the FXOpen brand only. It is not to be construed as an offer, solicitation, or recommendation with respect to products and services provided by the Companies operating under the FXOpen brand, nor is it to be considered financial advice.
Yen momentum strengthens as technical aligns with policy risks from Tokyo to Washington
Yen extended its rebound today, with momentum picking up across the board during European session. While the immediate driver is not fully clear, technical and fundamental factors are aligning to suggest the potential for a more sustainable turnaround, especially against European majors.
On the technical side, EUR/JPY should have formed a short-term top at 175.03 after rejection at 175.41 key resistance. Deeper retreat toward 55 Day EMA (now at 172.21), is favored in the near term. Sustained break below would imply a correction of the entire five-wave rally from 154.77, opening the way to 38.2% retracement of 154.77 to 175.03 at 167.29.

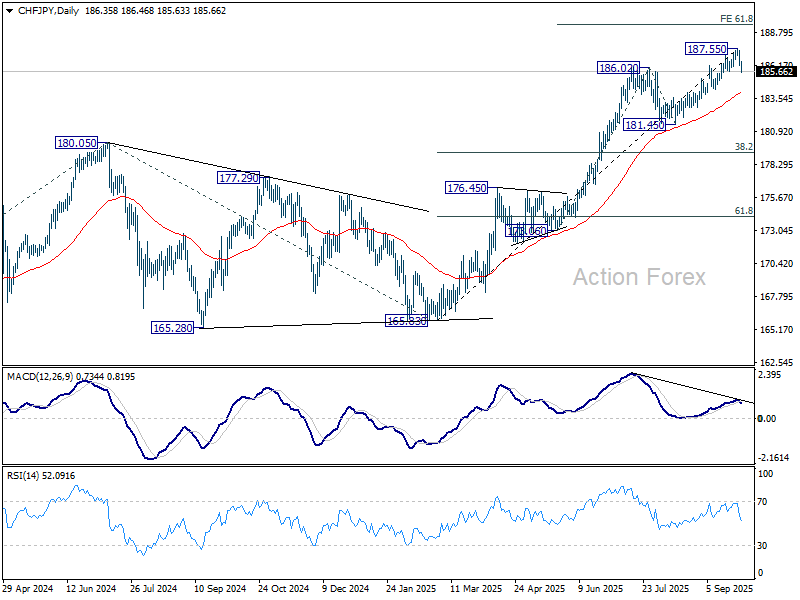
In CHF/JPY, bearish divergence on D MACD is clearer, with a short-term top likely at 187.55. Deeper pullback toward the 55 Day EMA (now at 184.03) is in play. Sustained break there will suggest that it's already correcting whole five-wave rise from 165.83, and bring deeper correction to 38.2% retracement of 165.83 to 187.55 at 179.25.
Fundamentally, several catalysts could lend Yen more support. In the near term, the most immediate risk is the looming US government shutdown. Unless lawmakers agree to a temporary funding deal, government funding will expire at midnight Tuesday, adding uncertainty to risk sentiment.
Also in focus is Friday’s US non-farm payrolls report, assuming it is released on time. The data will be pivotal for shaping Fed expectations, Treasury yields, and risk appetite more broadly — all of which are crucial drivers for Yen.
Looking beyond the US, speculation is building that the BoJ may deliver another rate hike before year-end. The Summary of Opinions from the September meeting showed growing support among policymakers for further tightening. Tomorrow’s Tankan Survey will provide fresh insight into how businesses are coping with US tariffs and the recently signed US-Japan trade deal. A resilient reading would strengthen the hawkish case.
Markets generally expect no move at the October 30 meeting. But with the BoJ’s history of confounding market expectations, investors should not rule out the possibility of action. After all, the event also comes with updated economic projections, which could be used to justify a move. In the meantime, traders will be watching for shifts in tone from BoJ officials in the run-up to the meeting. Even subtle changes in guidance could be enough to tilt the balance.
Ethereum Holds Blue Box Support Zone and Quickly Reverses Higher
Hello traders and welcome to a new blog post highlighting how our proprietary blue box support system helps traders found opportunities in the financial markets. In this post, the spotlight will be on Ethereum – a cryptocurrency.
Ethereum is a decentralized, open-source blockchain platform that enables smart contracts and decentralized applications (dApps). Launched in 2015, it extends beyond digital payments, allowing developers to build financial services, games, and more on its network. Its native currency, Ether (ETH), powers transactions and secures the system.
Ethereum remains in an all-time bullish trend. Bullish cycles comprise sequences of higher-highs and higher-lows. The last corrective bearish cycle started in March 2024 and ended in April 2025 after the preceding bullish cycle from June 2022 couldn’t breach the 4784 precious all-time high. Meanwhile, what’s most important is the sort of rally that followed the April pivot – a clear impulse wave sequence. The momentum of the April 2025 cycle took the bears out completely. Thus the crypto reached a new record high of 4957 on 24th August 2025. From the August high, a pullback started as expected. Prior to the pullback, we mentioned in the live sessions to members, to buy the pullbacks that follow from our proprietary blue box. What happened afterwards?
Ethereum Elliott Wave Trade Setup – 09.28.2025
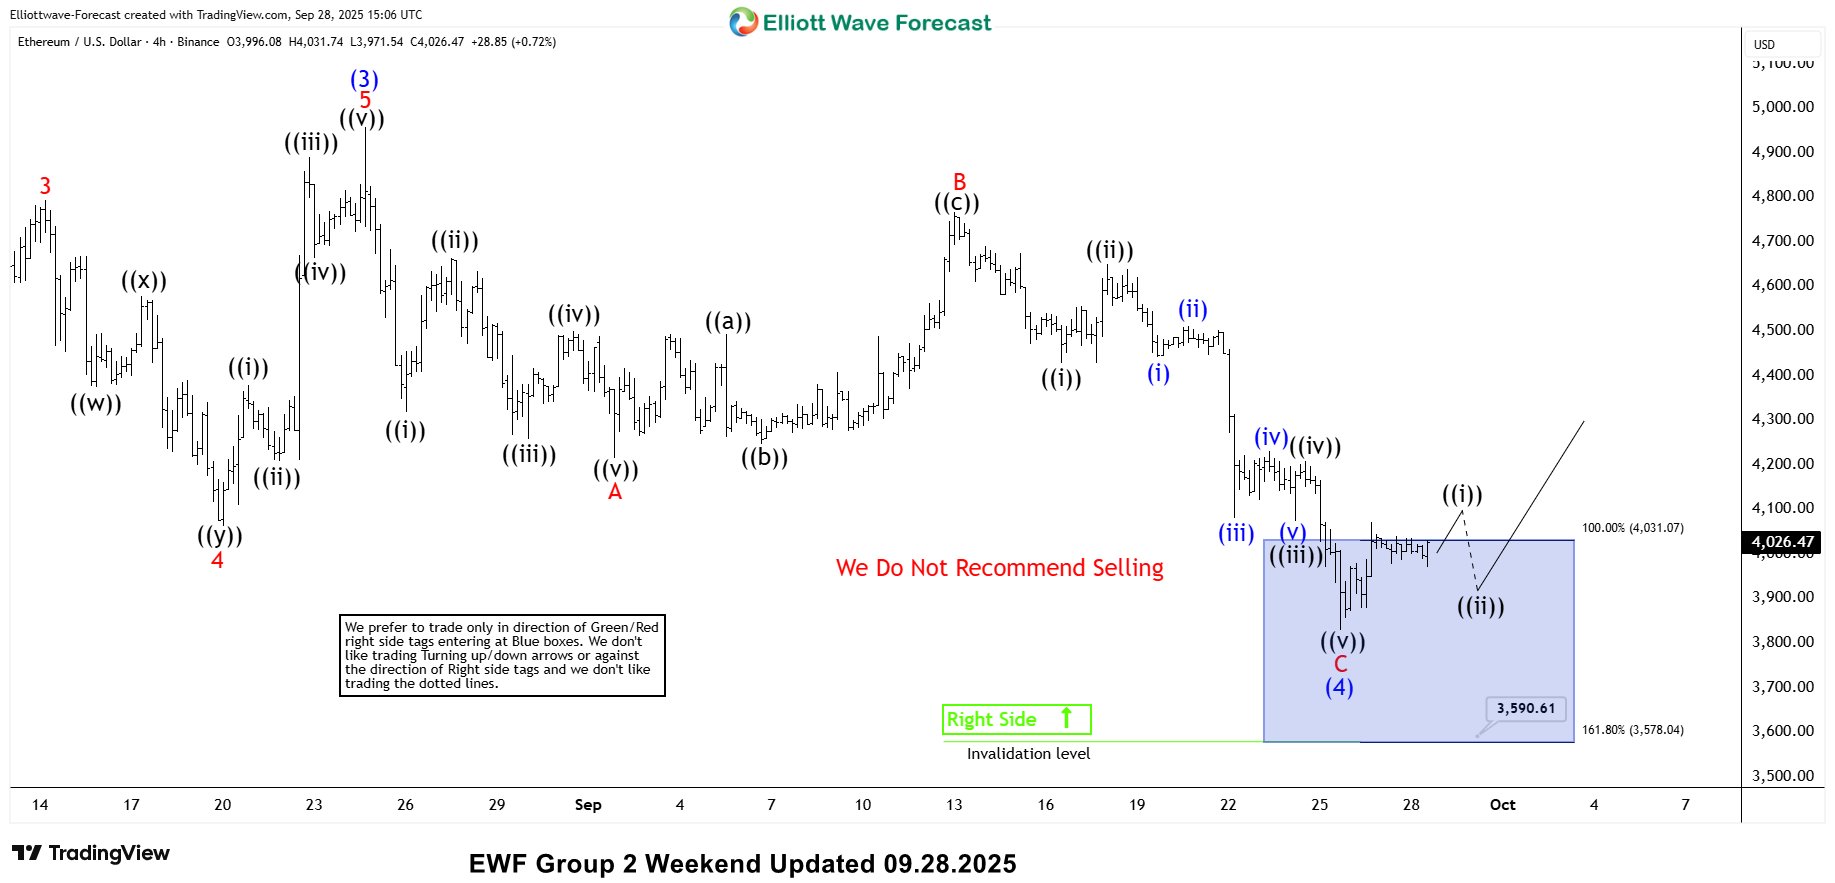
The pullback from August high extended lower into a familiar structure – a zigzag structure. We identified a 3-swing zigzag structure and shared the chart above with Elliottwave-Forecast members who went Long at 4031 and set stop at 3578 anticipating at least a 3-swing bounce to risk free area. However, the ultimate expectation is to see another 5-wave sequence develop from the lows of September to a fresh record high.
Ethereum Elliott Wave Trade Setup – 09.29.2025
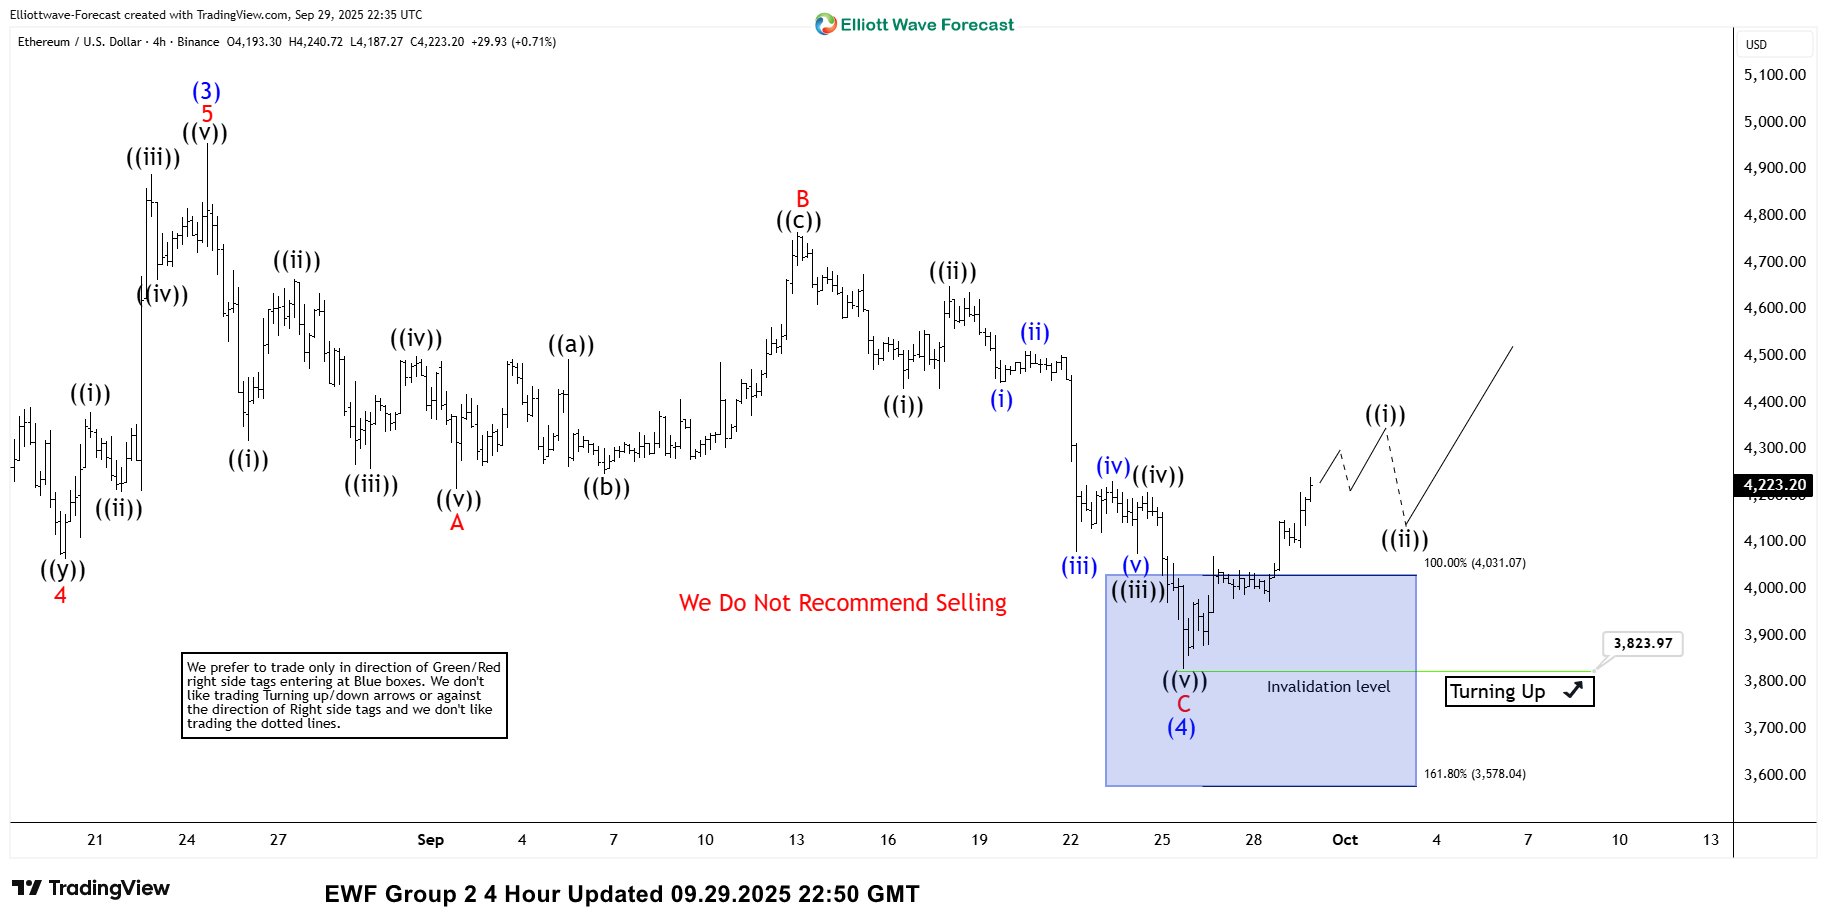
The price left the blue box zone as expected for wave ((i)) of 1 of (5) according to the latest H4 chart update we shared with members. Soon, the price will hit the first target at 4297. At that price, our members will take partial profit and adjust the stop to a risk free position. It’s the just a day after the blue box. The coming days will be interesting, to see how big and fast this recovery would go. As for us, we will continue to provide updates 24 hours daily to our members who are already on the Long side.
RBA Holds Cash Rate at 3.6%, Cautiously Keeps Its Options Open
Rates on hold and ongoing sensitivity to even small upside inflation risks. November cut far from assured but rate-cutting phase is not over.
- RBA Monetary Policy Board (MPB) keeps cash rate on hold at 3.6%, citing recovering private sector demand, an assessment that labour market conditions are stable, and the possibility that inflation might remain persistent in some areas.
- The post-meeting statement acknowledges that inflation is within the 2–3% target range. However, the RBA chose instead to highlight as a subheading that the rate of decline in underlying inflation ‘had slowed’ – hardly a surprise when the comparison is with the rapid decline from almost 7%. The statement noted that inflation would likely be higher in the September quarter than previously forecast but gave no steer on what this implied for subsequent quarters.
- The post-meeting statement was notably cautious and non-committal about the outlook. It also flagged that the MPB would review the outlook (as well as the risks, as in the language in August) in light of the incoming data. Maximum optionality has been retained but in our view, the choice is still when to cut further, not whether. With monetary policy still seen as ‘a bit restrictive’, the rate-cutting phase is not over.
The post-meeting statement again opened by noting that inflation has fallen substantially since 2022. Both headline and underlying inflation were acknowledged as being within the 2–3% target range, but it is noteworthy that this was not the headline in the statement. Rather, the post-meeting statement highlighted that the decline ‘had slowed’. This is hardly surprising as one approaches the desired end-point. Like the attention given to the monthly CPI indicator that the RBA had previously downplayed, the language choice suggests that the RBA remains sensitive to even small upside risks to inflation.
Indeed, in the media conference, the Governor emphasised the upside surprises in market services and housing-related inflation revealed in the August monthly data. Contrast this with the downplaying of the weaker monthly data a few months ago, and one cannot help getting the impression that the weight put on this indicator depends notably on how well it supports an existing broader narrative.
The post-meeting statement characterised conditions in the labour market as ‘remaining stable’, with the unemployment rate and measures of underemployment broadly constant even as employment growth slowed, and by more than the RBA expected. We think this assessment could be too bullish, noting the longer-term underlying trend for the participation rate to rise, and the role of cost-of-living pressures boosting labour supply until recently. The post-meeting statement mentioned liaison and survey measures of labour availability but not the ABS vacancies data, which gives a rather different impression of the direction of travel. (That said, the Governor did list vacancies in an answer in the media conference.) Likewise in the media conference, Governor Bullock contrasted current labour market conditions against an alternative of mass layoffs. This seems like an overly gloomy alternative when the question is whether to withdraw remaining policy restrictiveness.
Productivity growth was characterised as being weak (versus the August language of it not having picked up) and the outlook for productivity growth was described as uncertain, rather than its continued weakness being the uncertainty. This suggests a further evolution in the RBA’s views on this front with the release of the Q2 national accounts, following the major pivot in the RBA’s thinking on productivity outlines in the August SMP.
The statement also highlighted the ‘stronger-than-expected’ consumption growth data, attributing this to households possibly ‘becoming more comfortable consuming as real incomes and wealth rise’. Again, some recovery should be expected given that real incomes are finally rising. The risks around the consumption outlook and its implications for inflation were framed around whether current growth ‘persists’. We would note, however, that the ongoing unwind in growth in public demand means that growth in private demand (mostly consumption) needs to keep recovering to avoid an ‘air pocket’ in overall domestic demand. We also observe that the risk noted in the post-meeting statement of businesses potentially using this strength in demand to pass on cost increases was not evident in any data. In the media conference, the Governor acknowledged that this was merely a risk scenario.
Overall, this was a remarkably non-committal set of communications, making no mention of the previous forecasts being predicated on further cuts to the cash rate. The Governor mentioned that monetary policy is ‘still a bit restrictive’ in the media conference but there was no clear mention of the stance of policy in the post-meeting statement. If there was a skew to the messaging, it was in the direction of highlighting inflation risks. The RBA considers that the easier financial conditions stemming from the prior cash rate cuts are working their way through the economy broadly as expected, and that this will take time to be fully evident.
The MPB is clearly trying to give itself maximum optionality for the next few meetings. This means that our current base case of a cash rate cut in November is far from assured, though neither is it off the table. The longer the MPB delays further cuts, the more likely it is that it will end up cutting by more than it current envisages.
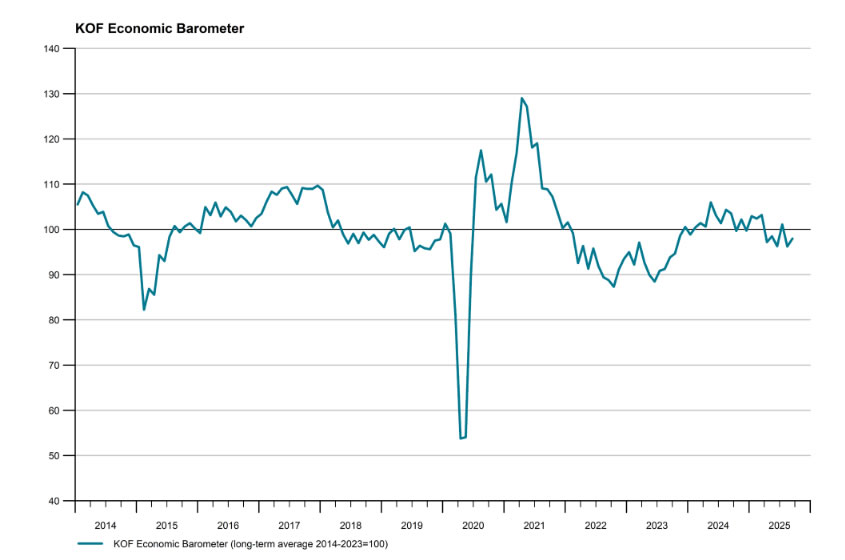
Swiss KOF barometer rises to 98.0, outlook still subdued
Switzerland’s KOF Economic Barometer rose to 98.0 in September from 96.2, beating expectations of 97.3. The improvement marks a rebound after last month’s dip, though the indicator still lingers below its long-term average, underscoring a "subdued" outlook.
According to KOF, the uptick was driven by stronger signals from manufacturing as well as financial and insurance services. These production-side sectors showed notable improvement, suggesting some resilience in key parts of the economy.
However, demand-side indicators were less encouraging. Foreign demand weakened, while the outlook for private consumption remained unchanged.
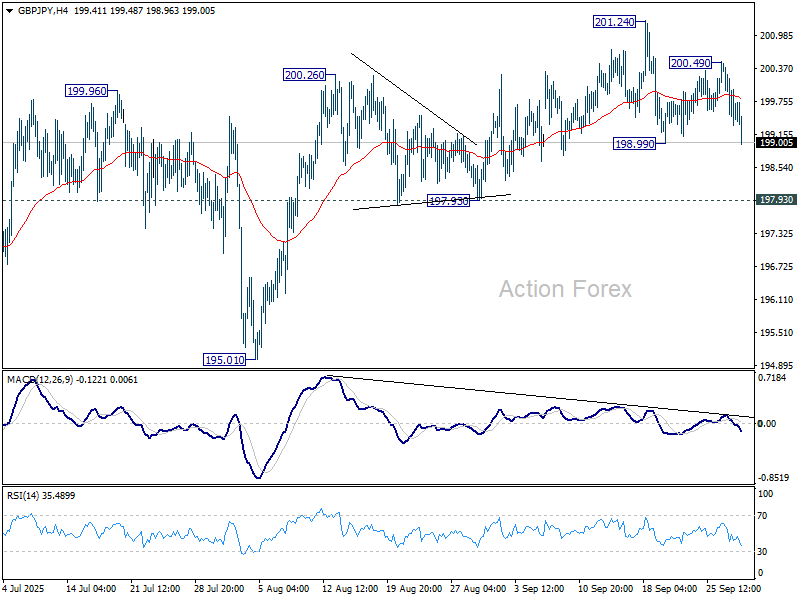
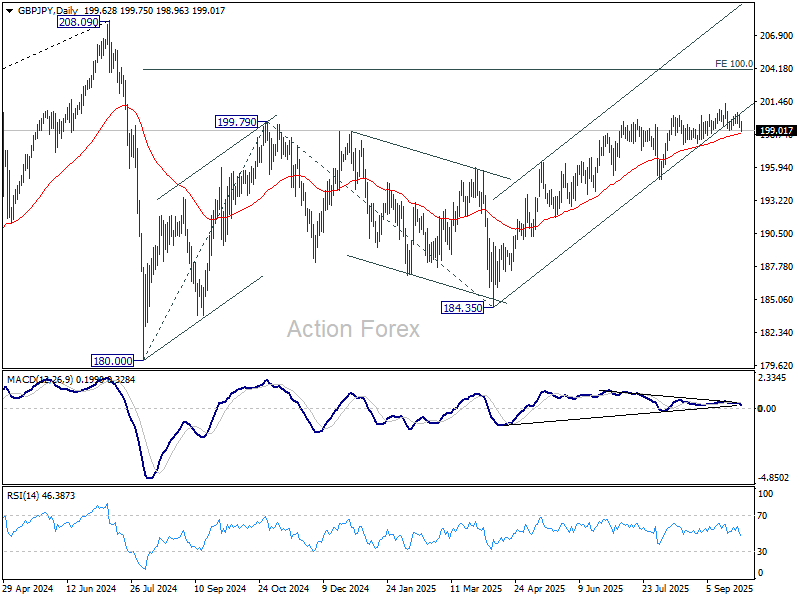
GBP/JPY Daily Outlook
Daily Pivots: (S1) 199.10; (P) 199.82; (R1) 200.30; More...
Intraday bias in GBP/JPY remains neutral first. On the downside, break of 198.99 support will resume the fall from 201.24 to 197.93 support. Considering bearish divergence condition in both D and 4H MACD, firm break of 197.93 will indicate bearish reversal and bring deeper fall back to 195.01. Nevertheless, above 200.49 will retain near term bullishness and target 201.24 next.
In the bigger picture, price actions from 208.09 (2024 high) are seen as a correction to rally from 123.94 (2020 low). The pattern might still extend with another falling leg. But in that case, strong support should be seen from 38.2% retracement of 123.94 to 208.09 at 175.94 to contain downside. Meanwhile, decisive break of 208.09 will confirm long term up trend resumption.
EUR/JPY Daily Outlook
Daily Pivots: (S1) 173.77; (P) 174.48; (R1) 174.97; More...
EUR/JPY's break of 173.88 resistance turned support indicates short term topping at 175.03, after rejection by 175.41 high. Intraday bias is back on the downside for 55 D EMA (now at 172.20). Sustained break there will argue that whole five-wave rally from 154.77 has also completed. For now, risk will stay on the downside as long as 175.03 resistance holds, in case of recovery.
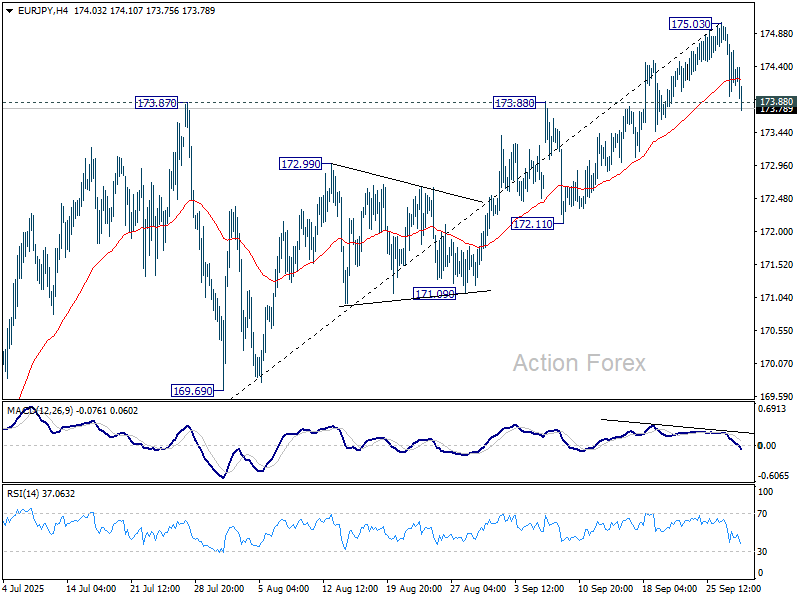
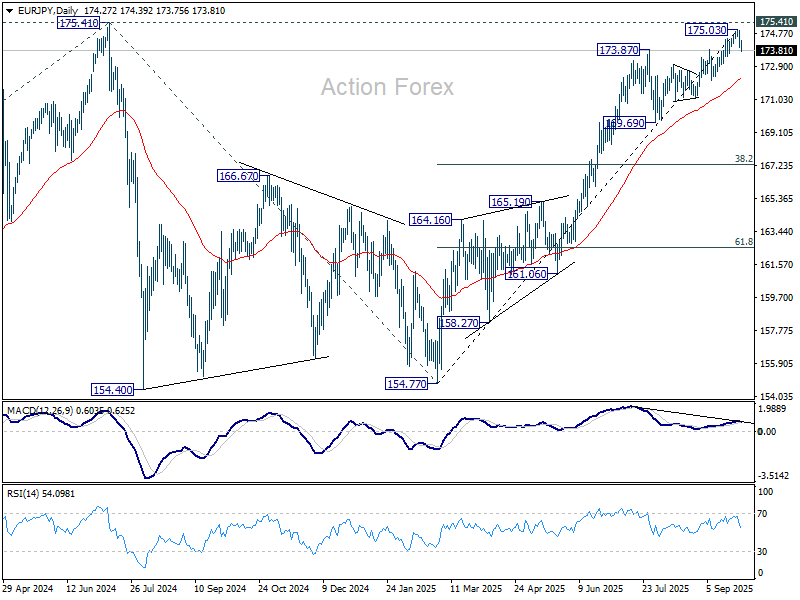
In the bigger picture, current rally from 154.77 is still tentatively seen as resuming the larger up trend. Firm break of 175.41 (2024 high) will confirm and target 61.8% projection of 124.37 (2022 low) to 175.41 from 154.77 (2025 low) at 186.31. However, sustained break of 55 D EMA (now at 172.20) will delay this bullish case, bring deeper pullback to 169.69 support first.
EUR/GBP Daily Outlook
Daily Pivots: (S1) 0.8716; (P) 0.8731; (R1) 0.8746; More...
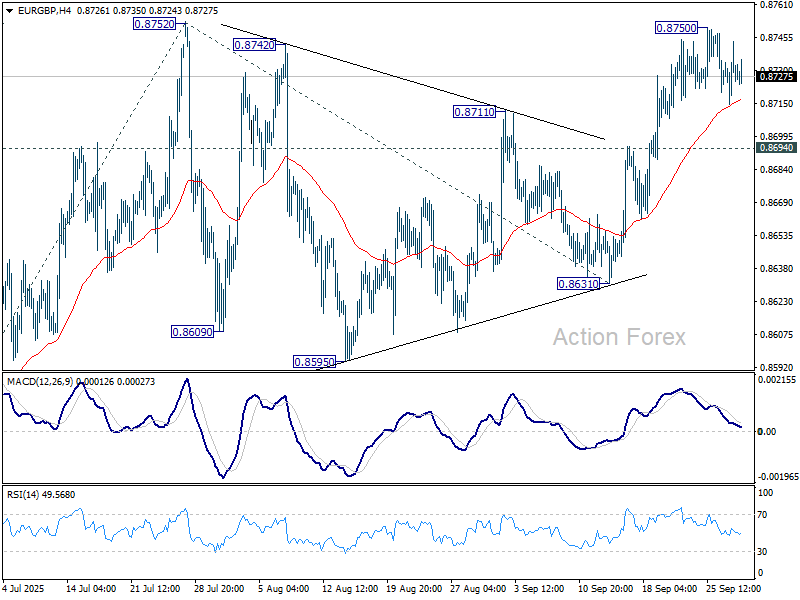
Intraday bias in EUR/GBP remains neutral and more consolidations would be seen below 0.8750. Further rally is expected as long as 0.8694 support holds. Firm break of 0.8752 will resume larger rally to 61.8% projection of 0.8354 to 0.8752 from 0.8631 at 0.8877, which is close to 0.8867 fibonacci level. However, break of 0.8694 will turn bias back to the downside for 0.8631 support instead.
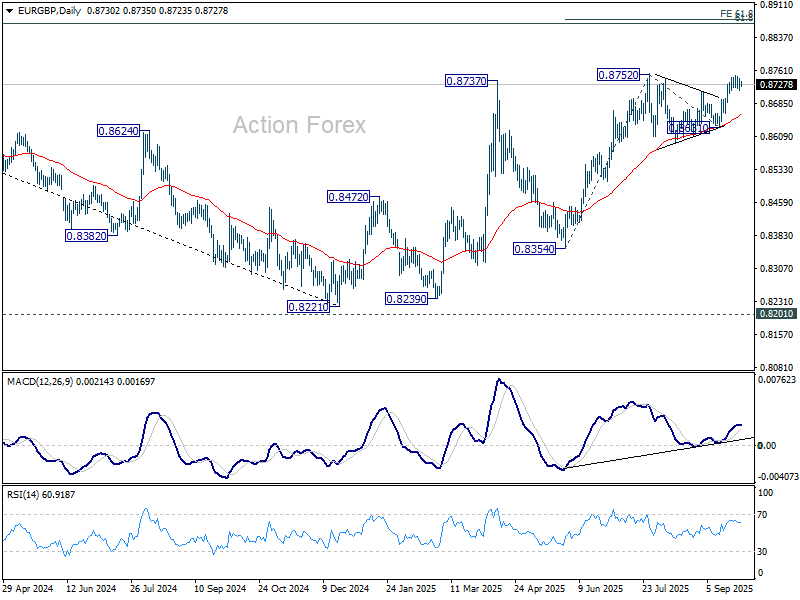
In the bigger picture, the structure from 0.8221 medium term bottom are not impulsive enough to suggest that it's reversing the down trend from 0.9267 (2022 high). But even if it's a correction, further rise could still be seen to 61.8% retracement of 0.9267 to 0.8221 at 0.8867. Nevertheless, sustained trading below 55 W EMA (now at 0.8533) will argue that the pattern has completed and bring retest of 0.8221 low.
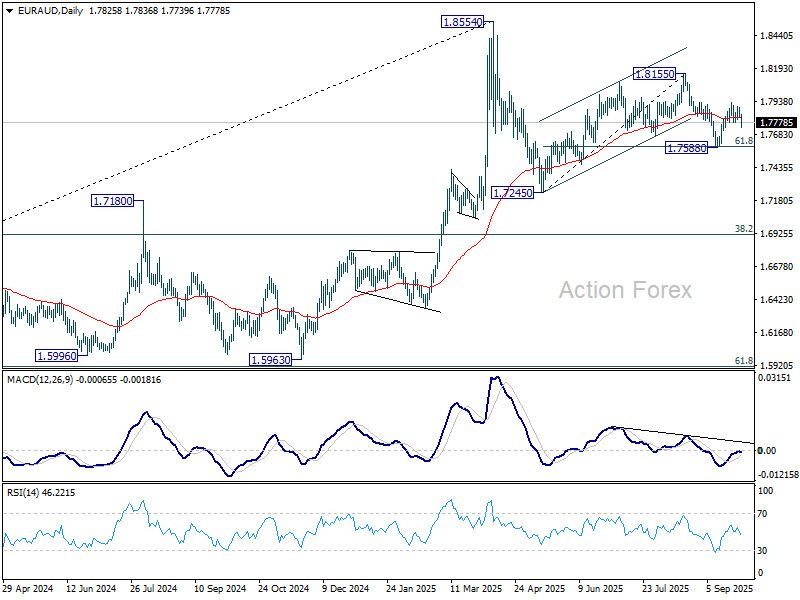
EUR/AUD Daily Outlook
Daily Pivots: (S1) 1.7805; (P) 1.7849; (R1) 1.7874; More...
EUR/AUD's retreat from 1.7929 continues and intraday bias remains neutral. On the upside, above 1.7929 will resume the rebound from 1.7588 to retest 1.8155. However, sustained break of 61.8% retracement of 1.7245 to 1.8155 at 1.7593, will resume the fall from 1.8155 to 1.7245 resistance, as part of the corrective pattern from 1.8554 high.
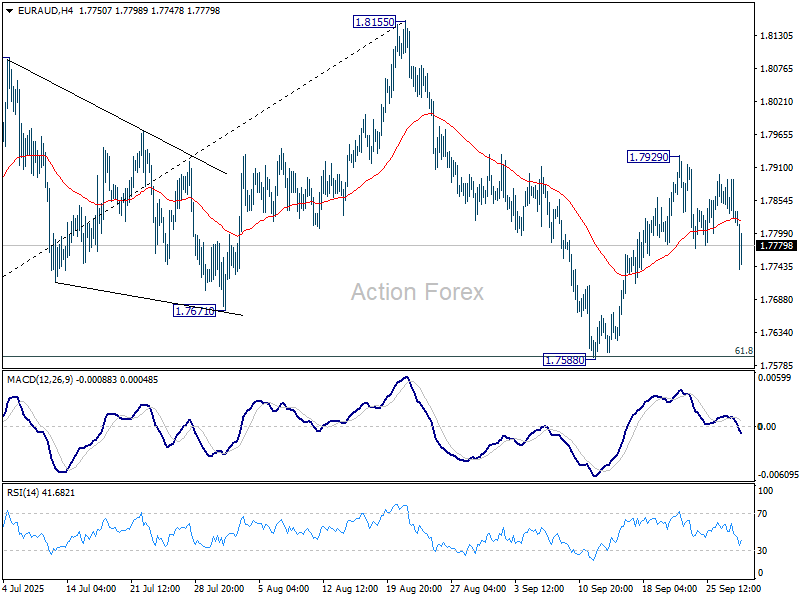
In the bigger picture, price actions from 1.8554 medium term top are seen as a corrective pattern. Deeper fall could be seen as the pattern extends, but downside should be contained by 38.2% retracement of 1.4281 (2022 low) to 1.8554 at 1.6922 to bring rebound. Uptrend from 1.4281 is expected to resume at a later stage.
EUR/CHF Daily Outlook
Daily Pivots: (S1) 0.9332; (P) 0.9348; (R1) 0.9372; More...
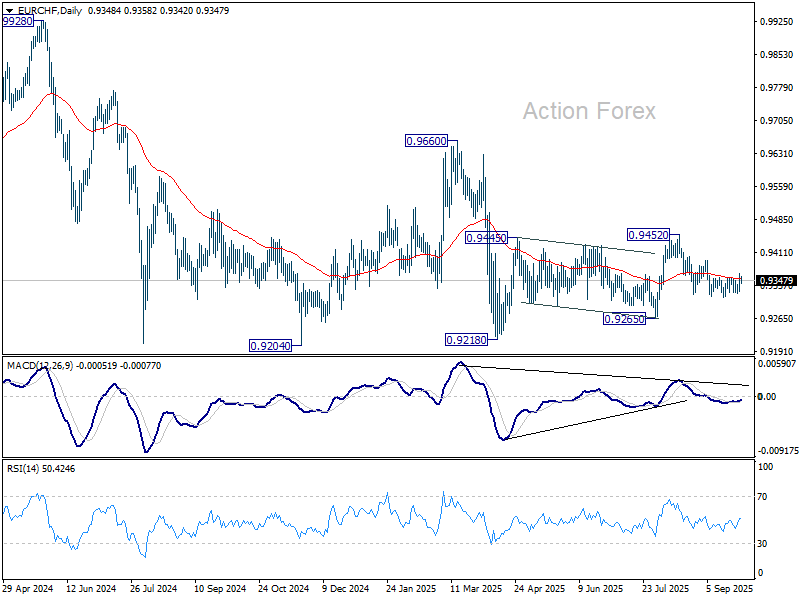
EUR/CHF's breach of 0.9354 resistance suggest that rebound from 0.9311 is resuming. Intraday bias is back on the upside for 0.9394 resistance. Firm break there should confirm that the pullback from 0.9452 has completed, and bring retest of this resistance. Nevertheless, break of 0.9311 will resume the fall from 0.9452 to 0.9265 support.
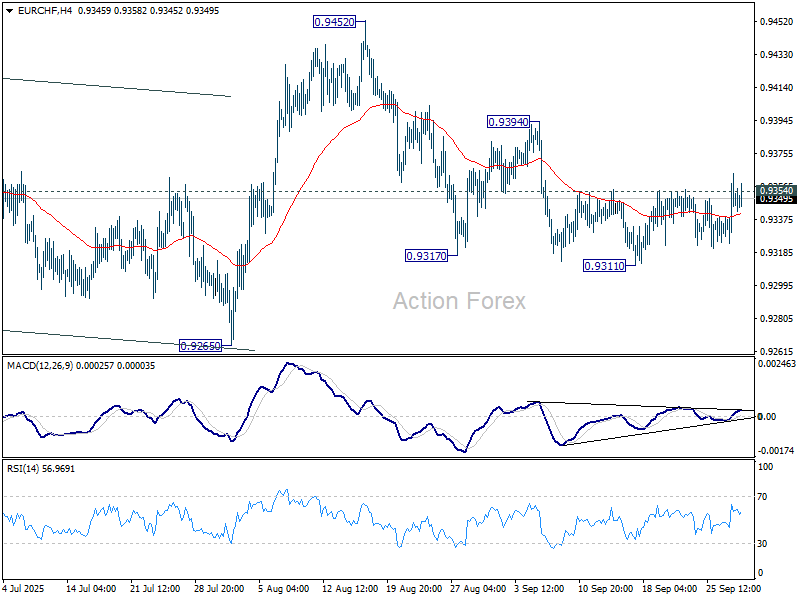
In the bigger picture, the down trend from 0.9204 (2018 high) might still be in progress considering that EUR/CHF is staying well inside the long term falling channel. However, with bullish convergence condition in W MACD, downside potential should be limited in case of another fall. Instead, firm break of 0.9660 resistance will be an important sign of medium term bullish trend reversal.