
Sample Category Title
USD/CAD Daily Outlook
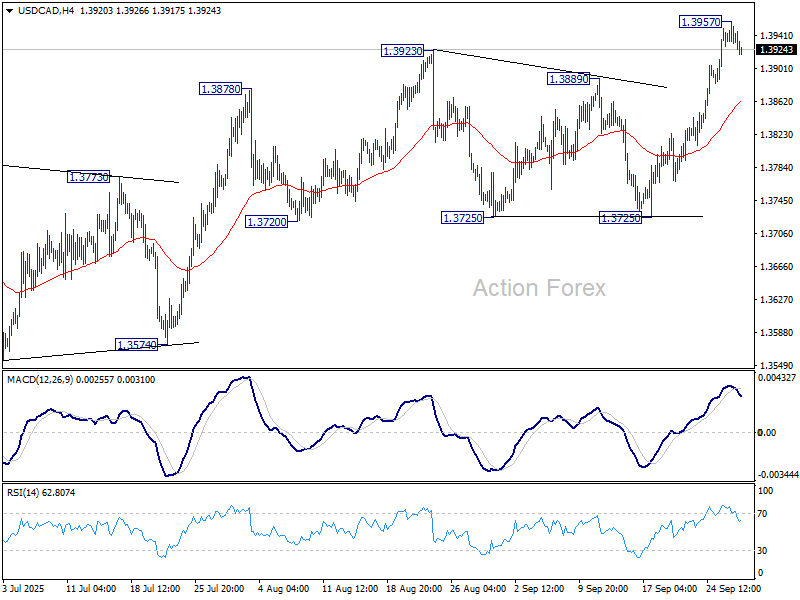
Daily Pivots: (S1) 1.3918; (P) 1.3939; (R1) 1.3965; More...
Intraday bias in USD/CAD is turned neutral first with current retreat. Above 1.3957 will resume the corrective rebound from 1.3538. But upside should be limited by 1.4014 cluster resistance to bring reversal. Meanwhile, sustained trading below 55 4H EMA (now at 1.3862) will bring deeper fall back to 1.3725 support.
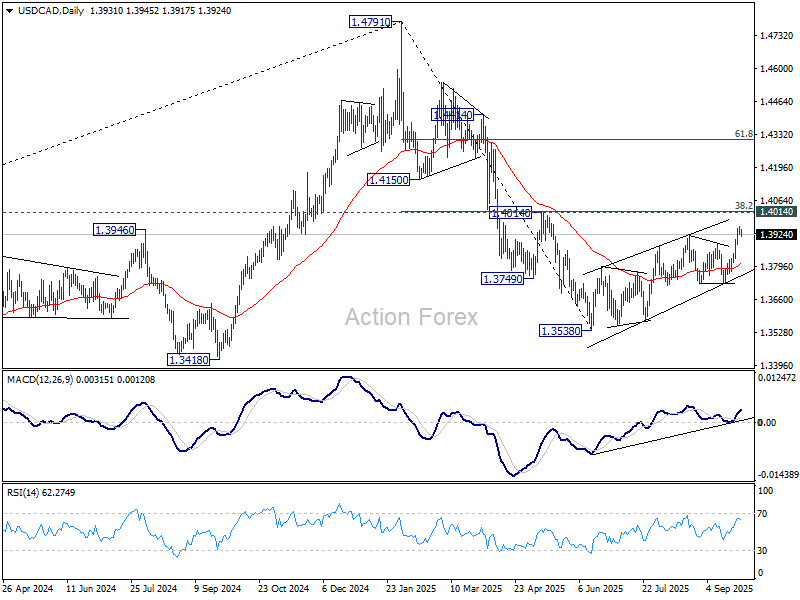
In the bigger picture, price actions from 1.4791 medium term top could either be a correction to rise from 1.2005 (2021 low), or trend reversal. In either case, further decline is expected as long as 1.4014 cluster resistance (38.2% retracement of 1.4791 to 1.3538 at 1.4017) holds. Next target is 61.8% retracement of 1.2005 (2021 low) to 1.4791 (2025 high) at 1.3069. However, sustained break of 1.4014 will argue that fall from 1.4791 has completed, and bring stronger rally to 61.8% retracement at 1.4312.
AUD/USD Daily Report
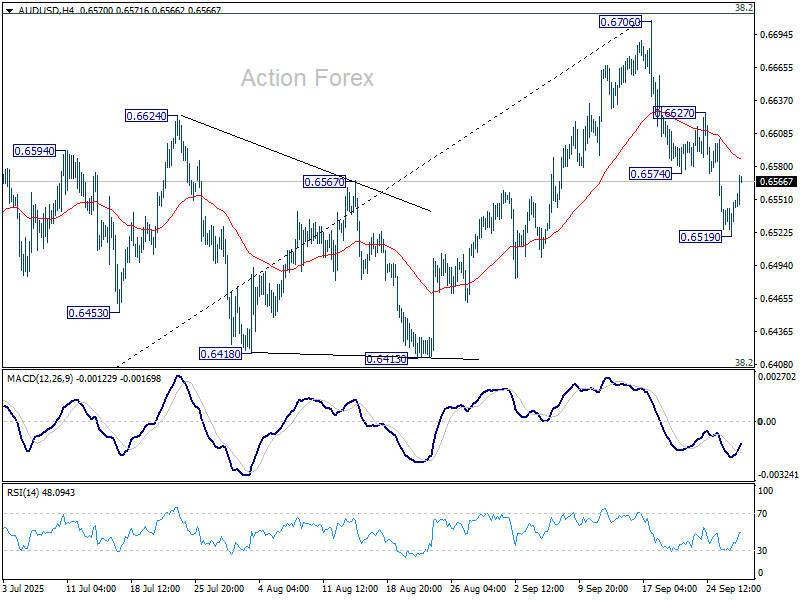
Daily Pivots: (S1) 0.6528; (P) 0.6540; (R1) 0.6559; More...
Intraday bias in AUD/USD is turned neutral first with current recovery. Risk will stay on the downside as long as 0.6627 resistance holds. Below 0.6519 temporary low will resume the fall from 0.6706. Sustained trading below 55 D EMA (now at 0.6545) will confirm rejection by 0.6713 fibonacci resistance, and bring deeper fall to 0.6413 cluster support (38.2% retracement of 0.5913 to 0.6706 at 0.6403).
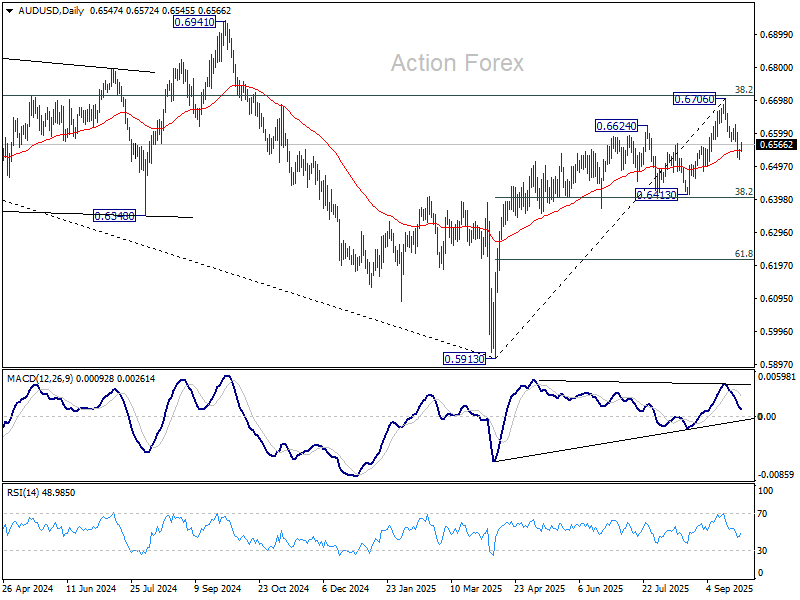
In the bigger picture, there is no clear sign that down trend from 0.8006 (2021 high) has completed. Rebound from 0.5913 is seen as a corrective move. Outlook will remain bearish as long as 38.2% retracement of 0.8006 to 0.5913 at 0.6713 holds. Nevertheless, considering bullish convergence condition in W MACD, sustained break of 0.6713 will be a strong sign of bullish trend reversal, and pave the way to 0.6941 structural resistance for confirmation.
EUR/USD Daily Outlook
Daily Pivots: (S1) 1.1670; (P) 1.1688; (R1) 1.1719; More...
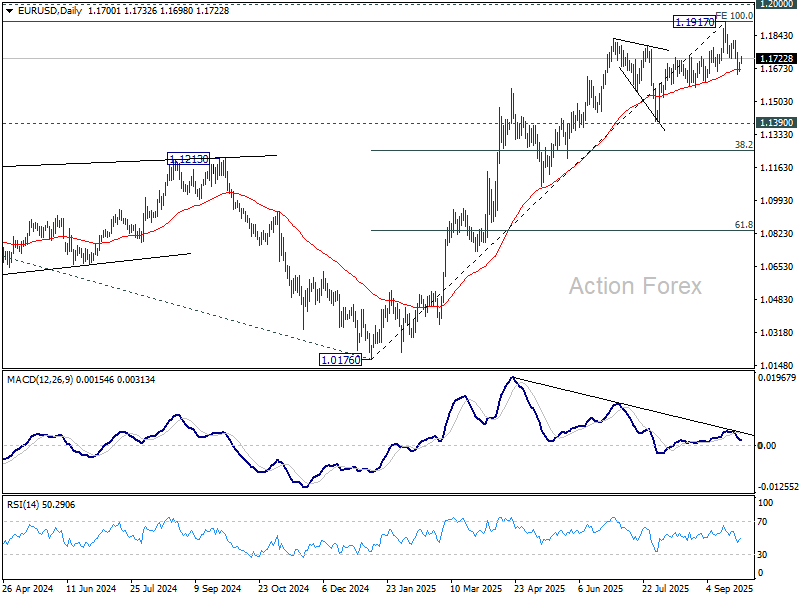
Intraday bias in EUR/USD remains neutral and more consolidations could be seen above 1.1644. Further fall is expected as long as 1.1819 resistance holds. Considering bearish divergence condition in D MACD, sustained trading below 55 D EMA (now at 1.1670) will argue that 1.1917 was already a medium term top. Deeper fall should then be seen to 1.1390 support next.
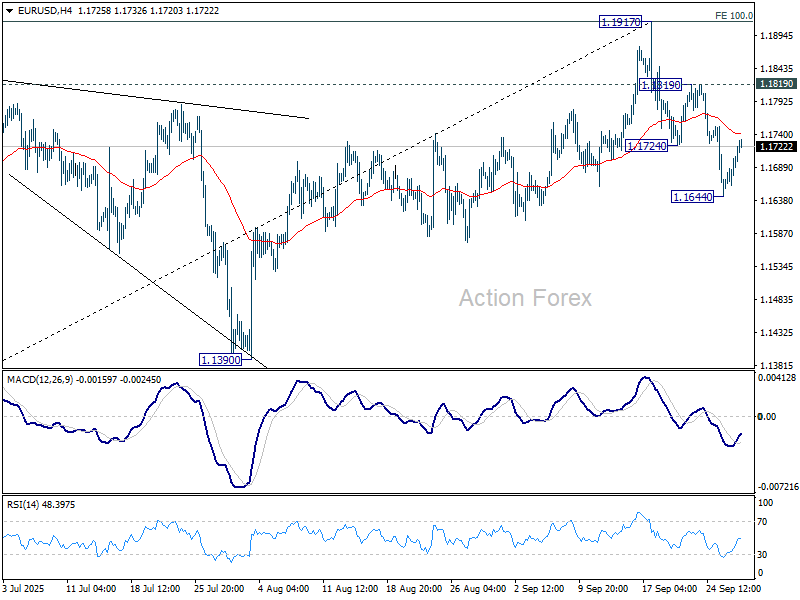
In the bigger picture, rise from 1.0176 (2025 low) is seen as the third leg of the pattern from 0.9534 (2022 low). 100% projection of 0.9534 to 1.1274 from 1.0176 at 1.1916 was already met. For now, further rally will remain in favor as long as 1.1390 support holds, and firm break of 1.2000 psychological level will carry larger bullish implications. However, firm break of 1.1390 will suggest that rise from 1.0176 has already completed and bring deeper fall to 55 W EMA (now at 1.1231).
GBP/USD Daily Outlook
Daily Pivots: (S1) 1.3347; (P) 1.3380; (R1) 1.3430; More...
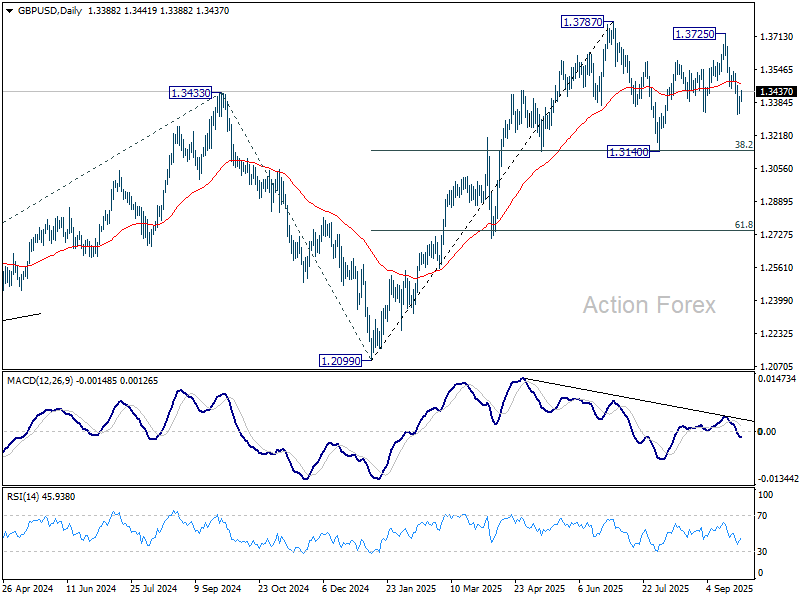
Intraday bias in GBP/USD stays neutral and more consolidations could be seen above 1.3322. But further decline is expected as long as 1.3535 resistance holds. Break of 1.3322 will resume the fall from 1.3725, as the third leg of the corrective pattern from 1.3787, and target 1.3140 support.
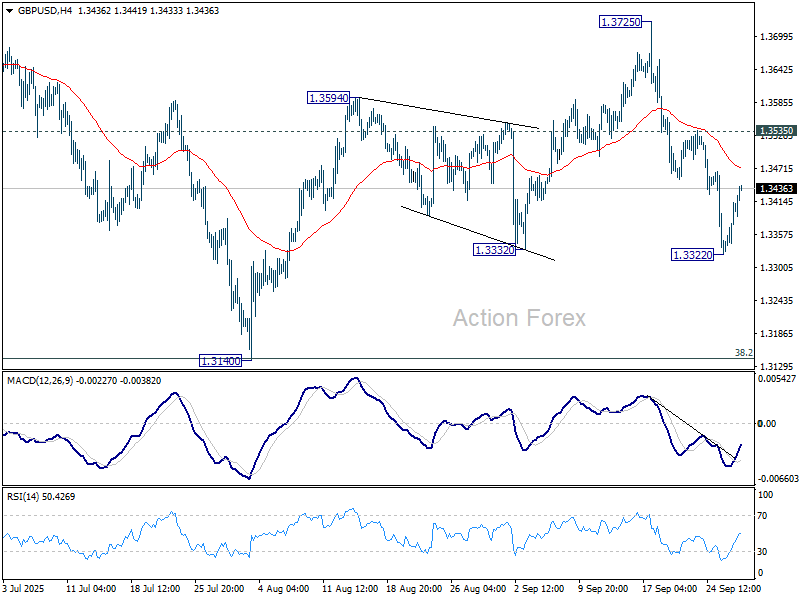
In the bigger picture, rise from 1.0351 (2022 low) is still seen as a corrective move. Further rally could be seen to 61.8% projection of 1.0351 to 1.3433 (2024 high) from 1.2099 (2025 low) at 1.4004. But strong resistance could be seen from 1.4248 (2021 high) to limit upside. Sustained break of 55 W EMA (now at 1.3155) will argue that a medium term top has already formed and bring deeper fall back to 1.2099.
USD/CHF Daily Outlook
Daily Pivots: (S1) 0.7953; (P) 0.7984; (R1) 0.8026; More…
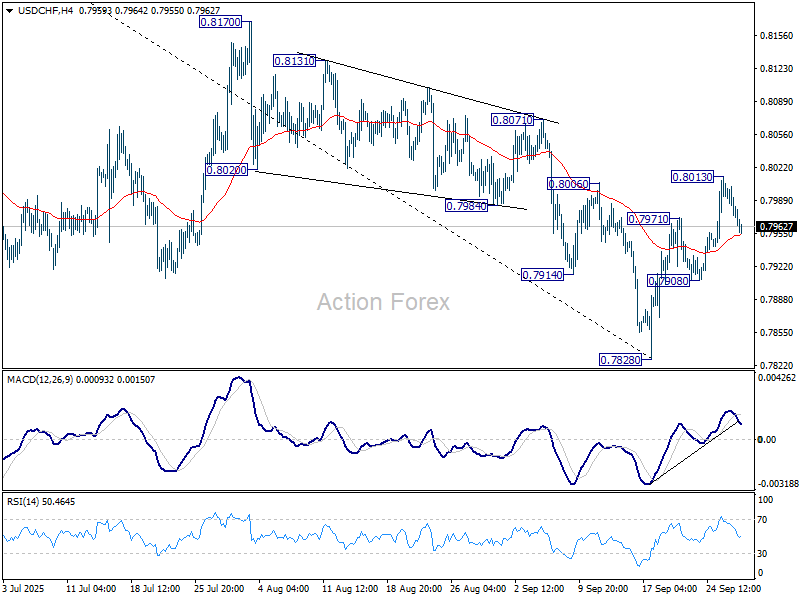
Intraday bias in USD/CHF stays neutral for the moment, and more consolidations could be seen first. On the upside, sustained trading above 55 D EMA (now at 0.8014) will suggest that rise from 0.7828 is already correcting whole fall from 0.9200. Further rise should the be seen to 0.8170 resistance and possibly above. However, break of 0.7908 will turn bias back to the downside for retesting 0.7828 low.
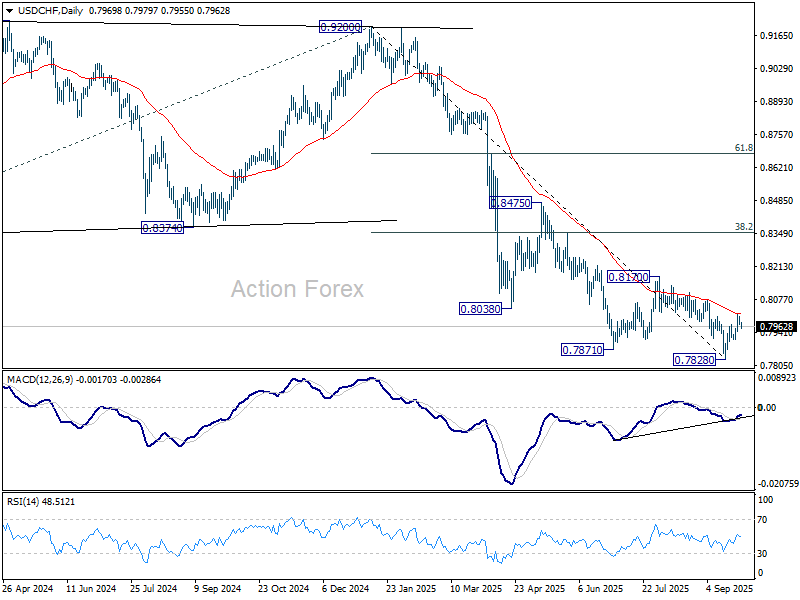
In the bigger picture, long term down trend from 1.0342 (2017 high) is still in progress. Next target is 100% projection of 1.0146 (2022 high) to 0.8332 from 0.9200 at 0.7382. In any case, outlook will stay bearish as long as 0.8332 support turned resistance holds (2023 low).
Jobs and Shutdown Fears Weigh on the US Dollar
Last week ended on a positive note despite fresh tariff threats on pharma, trucks and kitchen cabinets. PCE data coming in line with expectations helped keep investor mood sweet after a week of hesitation. The S&P 500 rebounded after a three-day retreat, the Stoxx 600 held above its 50-DMA, and even the pharma-heavy SMI index bounced from August lows – confirming that trade news has become usual bad news. There’s no guarantee tariffs will stay, and no guarantee they won’t be doubled; they’ve simply become an increasingly meaningless negotiation tactic, just another bump in the road.
The bigger picture remains unchanged: tariff risks exist, they weigh on global growth prospects, they hurt global trade, they will lead to revised supply chains and a more divided world – but their direct market impact has weakened. US inflation and jobs matter more, because it’s up to the Federal Reserve (Fed) to keep the bullish trend in check. Rates are being cut, and if things got ugly, the Fed would be the one buying government bonds. On that front, news is encouraging. Last week’s impressive 3.8% US GDP growth sounded alarm bells and raised questions about the necessity of further Fed cuts. But Friday’s PCE data came in *right* on target. Personal income and spending rose more than expected, but the Fed’s preferred inflation gauge, the core PCE index, held steady at 2.9%. That’s significantly and persistently higher than the Fed’s 2% target. But the Fed will tolerate higher inflation as the combination of ample fiscal support and ballooning US debt points to structurally higher inflation (all that money has to go somewhere).
And speaking of jobs and debt – investor attention now shifts to US jobs data this week and a potential government shutdown on October 1. For jobs, the US economy is expected to have added around 50K jobs in September, with wages up 0.3% and unemployment steady at 4.3%. A weaker-than-expected print would keep alive expectations of two more Fed cuts this year, putting pressure on short-term yields and the dollar while supporting equities. Stronger-than-expected numbers, on the other hand, could reduce the odds of two more cuts, support the dollar and cap equity appetite near record highs.
But that data may not be published if a government shutdown materializes. Should Congress fail to strike a deal, we could see both stocks and the dollar under pressure, alongside renewed stress at the long end of the US yield curve. Still, a last-minute deal is more likely than not, and shutdown scares have usually ended up as non-events. Even in the rare cases they caused market disruption, the dips proved attractive to buy – after all, the US government can’t stay shut forever.
Meanwhile, uncertainty is helping gold to fresh records. The metal kicked off the week above $3,800 per ounce, while silver continues its exponential rise as investors shun the dollar and US debt. The precious metals rally is not just a short-term allocation story – trend-followers are in control, and the trend is strongly positive.
Despite that risk-off note, the week starts with a positive tone. European and US futures are in the green. In China, stocks are higher after industrial profits rose 20% year-on-year in August. The Hang Seng is better bid too, boosted by another 3% jump in Alibaba shares. The AI rally across Chinese stocks remains a major theme, with Alibaba carrying the mascot’s torch. A rally toward the 200 mark looks increasingly on the cards, with room to extend further.
In FX, the US dollar is downbeat on dovish Fed expectations ahead of jobs data and amid shutdown risks. The EURUSD held above its 50-DMA last week. Starting today, eurozone countries will release their September preliminary inflation prints. On Wednesday, the aggregate CPI is expected to tick up from 2% to 2.2%. That should cement the idea that the European Central Bank (ECB) is done cutting rates. But since that’s largely priced in, direction will come more from the dollar. A soft jobs print or a shutdown could fuel a retest above 1.18, while strong jobs data and no shutdown should maintain resistance at that level.
Elsewhere, the Reserve Bank of Australia (RBA) is expected to keep rates unchanged when it meets tomorrow, and US crude is trading above the key $65pb level, with rallies seen as selling opportunities amid news that OPEC will continue restoring supply in November.
Euro Area inflation Figures and US Jobs Report to Shape the Week
In focus today
In the euro area, this week's focus is on the flash HICP inflation print for September, with data from Spain and Belgium due today. We expect euro area HICP inflation to rise to 2.3% y/y (prior: 2.0%) mainly due to energy price base effects, while core inflation is also expected to increase slightly to 2.4% y/y (prior: 2.3 %) on services-related base effects, particularly airfares. Core inflation momentum is likely to remain steady, making the rise in yearly rates largely base effect-driven, limiting hawkish signals. Hence, we could see a decline in interest rates despite the yearly growth rate of inflation increases, if the month-on-month developments are weaker than expected.
Overnight, the Reserve Bank of Australia (RBA) will have a monetary policy meeting. We expect no policy rate changes, in line with market pricing. Markets believe that the RBA will eventually deliver at least one more rate cut over the winter period.
The Riksbank will publish the minutes from last week's policy rate decision. While we already know that Anna Seim entered a reservation against the rate cut, it will be particularly interesting to understand her reasoning. For the other board members, we will focus on nuances in their statements to identify any potential candidates for a more hawkish stance going forward. Anna Breman's elaborations will hold less relevance for future decisions, as she will leave the Riksbank on 10 October and will not participate in further interest rate decisions. Until a replacement is appointed, the board will consist of four members, with Erik Thedéen holding the casting vote in the event of a tie.
Looking ahead, this week features a packed economic calendar, the US September jobs report, and Japan's LDP leadership elections. A potential US government shutdown remains a risk this week, with negotiations still ongoing. While such shutdowns typically have limited macroeconomic impact, they could result in significant disruptions, including furloughs for hundreds of thousands of public workers. Efforts are underway to pass a short-term funding bill to extend government operations until 21 November, requiring bipartisan support in the Senate.
Economic and market news
What happened over the weekend
In oil markets, Reuters exclusive reported that OPEC+ is expected to approve a 137,000 bpd output hike for November at its 5 October meeting, continuing the gradual reversal of prior cuts. Brent crude rose above USD70/bbl on Friday, supported by Ukrainian drone attacks on Russia's energy infrastructure. However, OPEC+ often falls short of targets, as many members are already at capacity, heightening market concerns over shrinking spare capacity.
What happened Friday
In the US, August PCE closely matched expectations for both prices and real consumption growth, as core PCE came in at 2.9% y/y. Real consumption was revised up by USD 180bn (+0.9%), driven by a positive revision to household incomes. Overall, consumption remains a clear growth driver in Q3.
Tariffs and the euro area, Trump announced 100% tariffs on pharmaceutical goods as well as additional tariffs on heavy trucks, cabinets, and upholstered furniture. Pharmaceutical producers with manufacturing facilities either in place or in construction in the US will be exempted from the tariffs. This alleviates the impact on the EU economy, as this includes majority of the largest EU producers. In addition, EU's heavy truck exports are just EUR 430m annually, and total furniture exports (including unaffected items) amount to EUR 5bn (0.03% of GDP). However, the announcement underscores ongoing tariff uncertainty, despite a trade agreement.
Equities: Equities ended mostly higher on Friday, snapping a three-session losing streak. Nevertheless, global equities finished the week lower despite stronger macro data, primarily from the US. Rising yields kept equities under pressure, though the selloff was far from a true "risk-off" move. Instead, the weakness was concentrated in defensives (staples, health care) and high-multiple sectors such as communication services and technology. By contrast, value cyclicals - including materials, energy, and banks - were particularly strong. As for health care, weakness came from new tariff threats on pharma, but the downward pressure dampened in the afternoon following White House confirming that EU will have a 15% tariff on pharma products, not 100%. Within equities, we continue to favour banks, materials, and health care, and therefore expect similar market dynamics in the weeks ahead.
FI and FX: EUR/USD rose in the latter part of Friday's session, breaking back above the 1.17 mark. US yields carried upward momentum through most of last week, partly driven by stronger-than-expected data, though Friday's moves were relatively muted with yields essentially unchanged across the curve. This week, we head into a pivotal week for markets and the Fed, with a heavy slate of US labour market data. In Europe, Friday was also a quiet session, with front-end yields unchanged, while the 10Y and 30Y Bund yields declined 2bp. The modest long end-led move resulted in a mild bull flattening of the German curve. The oil price rose above USD70/bbl on Friday for the first time in almost two months. The rebound could be due to geopolitical uncertainty and in particular potential for more sanctions on Russia taking the focus from the impact from rising OPEC+ production and the higher tariffs.
USD/JPY Daily Outlook
Daily Pivots: (S1) 149.28; (P) 149.62; (R1) 149.83; More...
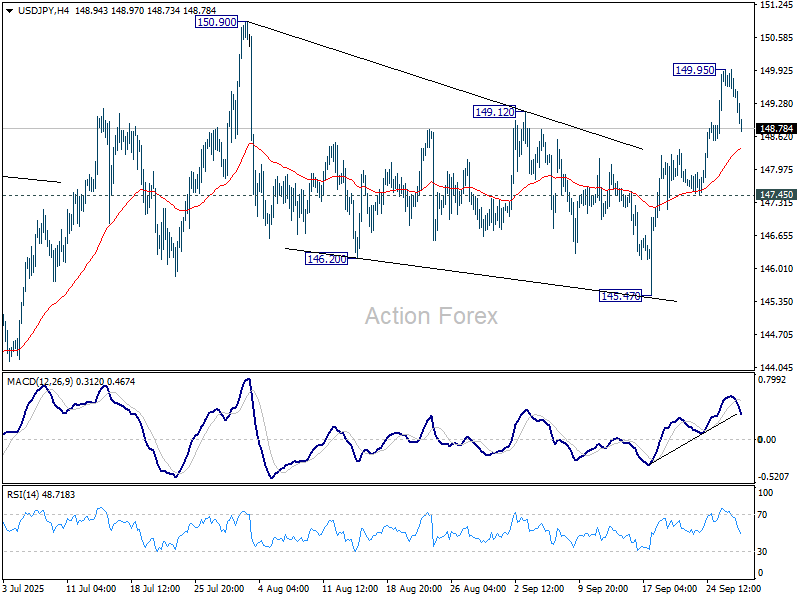
Intraday bas in USD/JPY is turned neutral first as retreat from 149.95 deepens. Some consolidations would be seen first but further rally is expected as long as 147.45 support holds. Corrective pattern from 150.90 should have completed at 145.47. Above 149.95 will bring retest of 150.90 first. Firm break there will target 151.22 fibonacci level. However, sustained break of 147.45 will dampen this bullish view and bring deeper fall to 145.47 support instead.
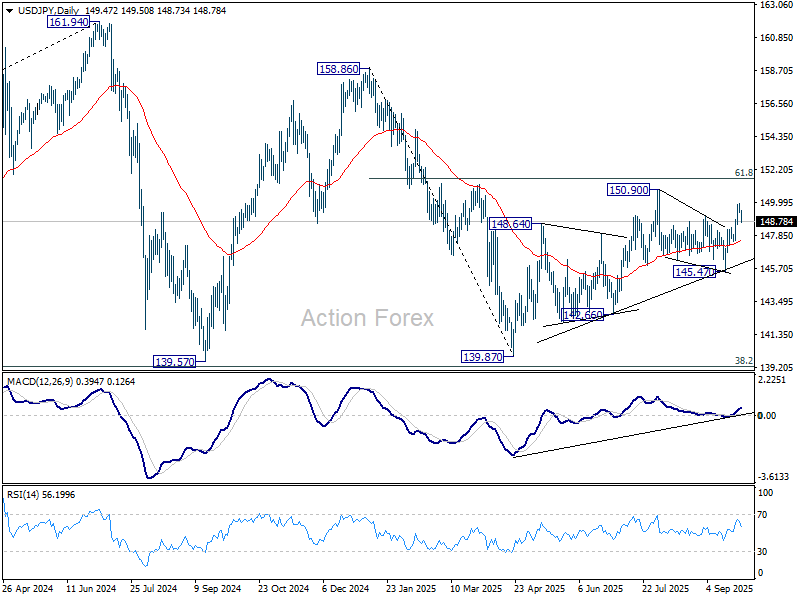
In the bigger picture, price actions from 161.94 (2024 high) are seen as a corrective pattern to rise from 102.58 (2021 low). Decisive break of 61.8% retracement of 158.86 to 139.87 at 151.22 will argue that it has already completed with three waves at 139.87. Larger up trend might then be ready to resume through 161.94 high. In case the corrective pattern extends with another fall, strong support is expected from 38.2% retracement of 102.58 to 161.94 at 139.26 to bring rebound.
Yen Recovers as Nikkei Pulls Back, Dollar Pressured by US Shutdown Risk
Yen jumped broadly in Asian trading today, marking a strong performance on the penultimate session of Q3. The move coincided with a drop in Nikkei, where ex-dividend effects weighed on equities, prompting flows into Yen. The quarter-end context likely amplified positioning shifts.
Beyond equities, anticipation of the BoJ’s upcoming Summary of Opinions also bolstered Yen. With two policymakers dissenting in favor of a hike at the last meeting, markets expect the document to reveal a more hawkish tone. The key question is how much support is building within the Board for an imminent move toward higher rates. Even a modest signal of broadening support for rate increases could sharpen expectations for a hike later this year.
On the other side of the ledger, Dollar came under pressure as US political risk resurfaced. Washington faces the prospect of a partial government shutdown if Congress fails to pass a funding bill before Tuesday. While shutdowns are nothing new in the US, the uncertainty has weighed slightly on the greenback in early trading.
Investors are more focused on how a shutdown could disrupt economic data releases, particularly the highly anticipated September non-farm payrolls due Friday. Any delay in the report would leave markets flying blind on the most important labor market gauge, complicating Fed expectations heading into October.
For now, Yen leads the day’s performance, followed by Aussie and Kiwi. Dollar sits at the bottom alongside the Loonie and Euro. Sterling and Swiss Franc are trading mid-pack.
In Asia, at the time of writing, Nikkei is down -0.89%. Hong Kong HSI is up 1.57%. China Shanghai SSE is up 0.41%. Singapore Strait Times is up 0.20%. Japan 10-year JGB yield is down -0.018 at 1.642.
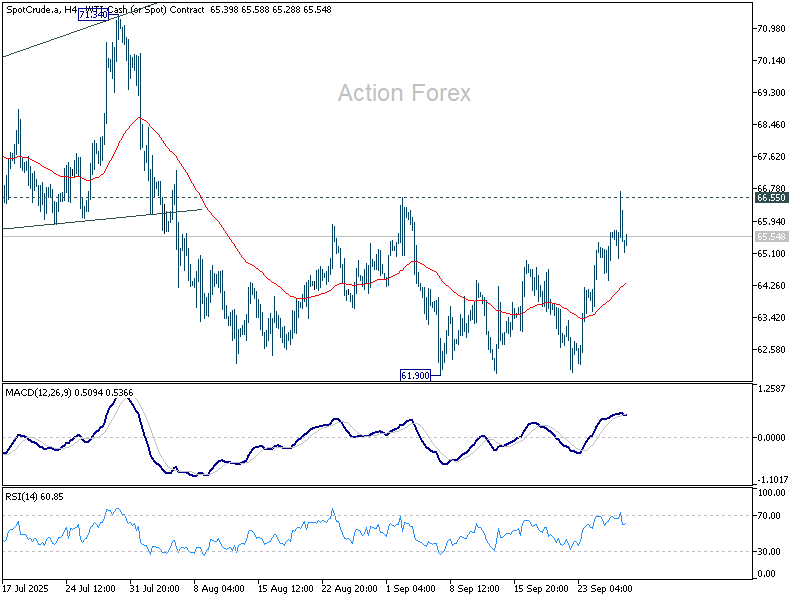
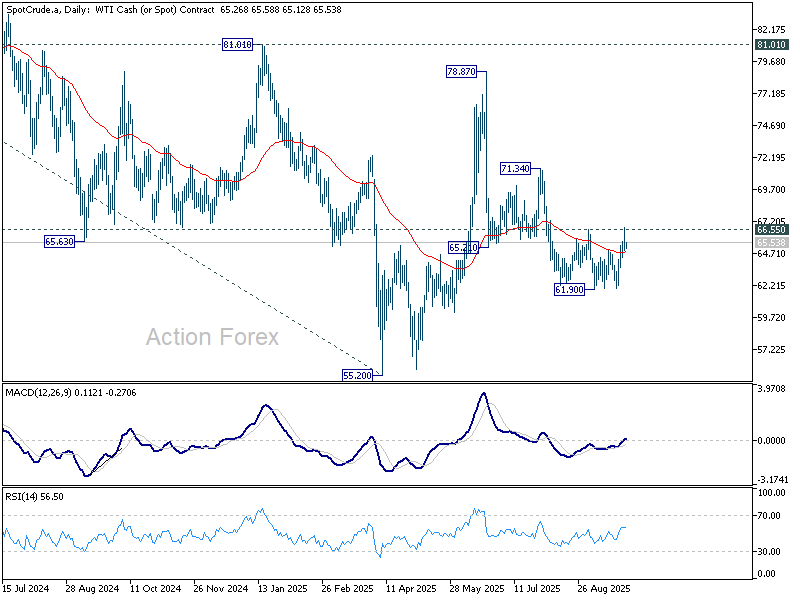
WTI oil bulls need 66.55 break as OPEC+ hike decides next move
Oil prices slipped slightly in Asian session after reports that OPEC+ is set to approve another production hike in November. The group is said to consider lifting quotas by at least 137k barrels per day when ministers meet next Sunday, adding to the series of increases since April.
The cartel has already boosted output quotas by more than 2.5 million barrels per day, equivalent to around 2.4% of global demand. The shift marks a decisive reversal from earlier supply restraint, with members now focused on regaining market share as prices hover at supportive levels.
Eight key producers will meet online on October 5 to finalize the November decision. Markets will be watching not just the headline figure but also whether the hike overshoots expectations, which could put fresh pressure on prices. On the other hand, smaller-than-anticipated increase could give oil prices a lift through a key near term resistance level.
Technically, WTI’s drop from 78.87 appears to have completed as a three wave correction at 61.90. The immediate focus is resistance at 66.55. Firm break above this barrier would reinforce this bullish and target 71.34.
However, rejection by the resistance would keep the short-term outlook bearish, leaving the door open for another fall through 61.90 as a later stage.
Gold and Silver rally near exhaustion points, caution warranted
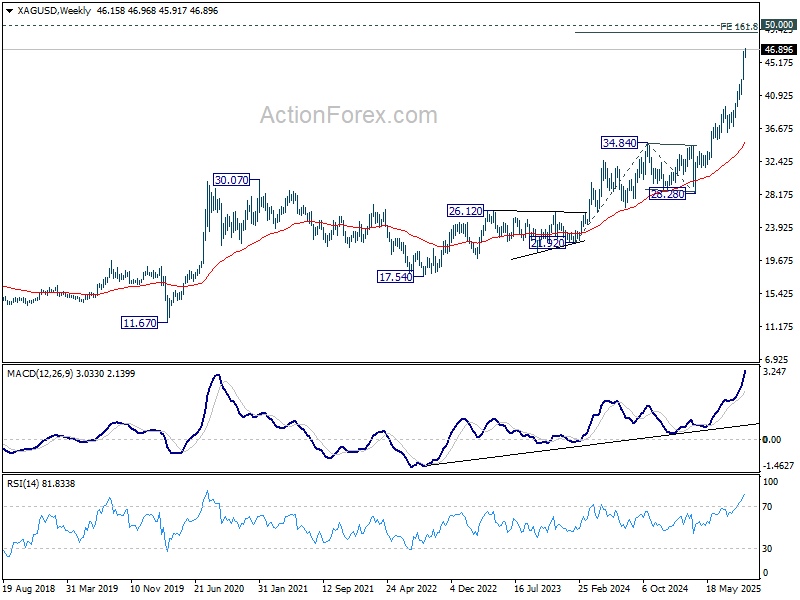
Gold surged to another record in Asian trading today, edging toward 3800 level, while Silver held firm around 46.5 after last week’s sharp 7% rise. Both metals remain supported by low interest rates and geopolitical risks, but the relentless rally is entering territory where traders should start to grow more cautious.
For Gold, the technical outlook still points higher as long as 3717.24 support holds. Immediate upside target is 61.8% projection of 2584.24 to 3499.79 from 3267.90 at 3833.79. Yet as prices stretch further, momentum could start fading even as new highs are made, on overbought conditions.
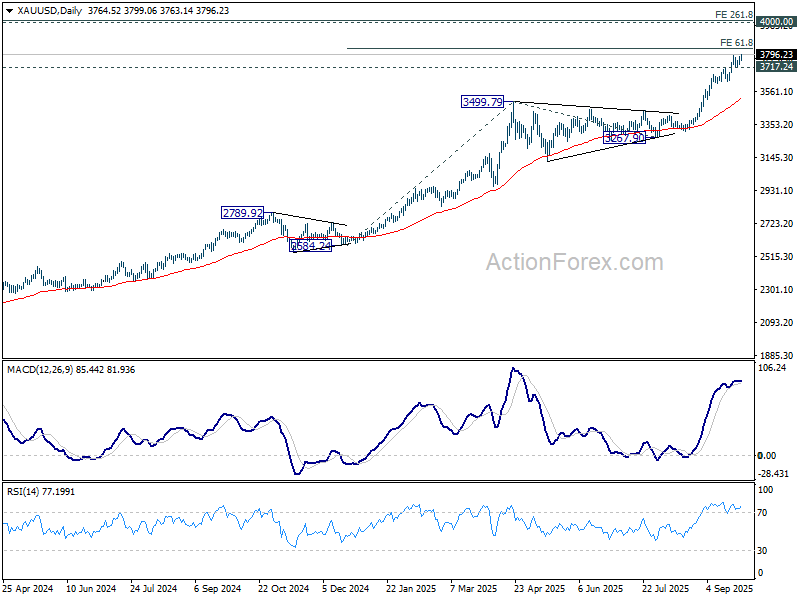
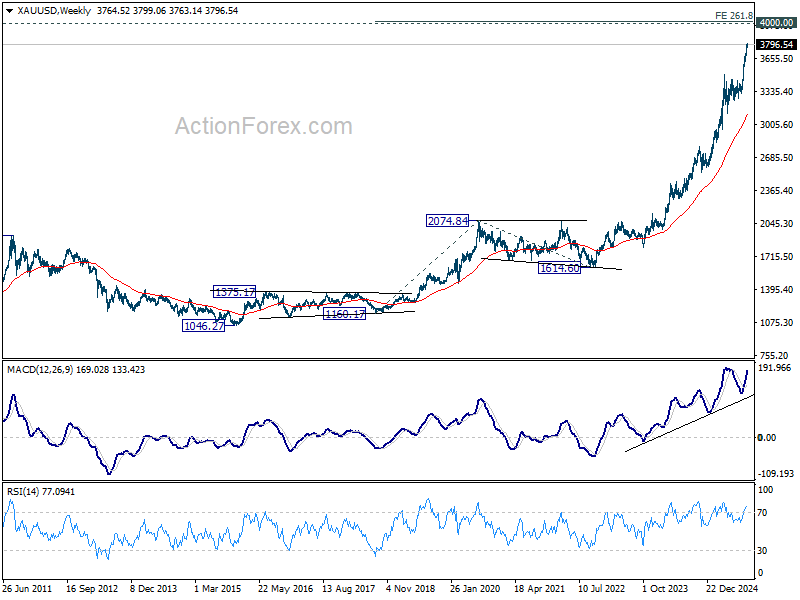
The 4000 psychological barrier looms as a potential turning point. That zone also aligns with the 261.8% projection of 1160.17 to 2074.84 from 1614.60 at 4009.20, making it an ideal level for a major top. Traders should view this area as one to scale out, not chasing higher.
As Gold could also complete its five-wave rally from 1046.27 (2015 low), reversal at or near 4000 could be steep. The next meaningful correction might drag Gold quickly back toward 55 W EMA (now at 3113.80).
Silver carries similar warning signs. With support intact at 43.75, further rise should be seen to 100% projection of 28.28 to 39.49 from 36.93 at 48.14. But momentum is already running into a zone where upside looks limited relative to risk.
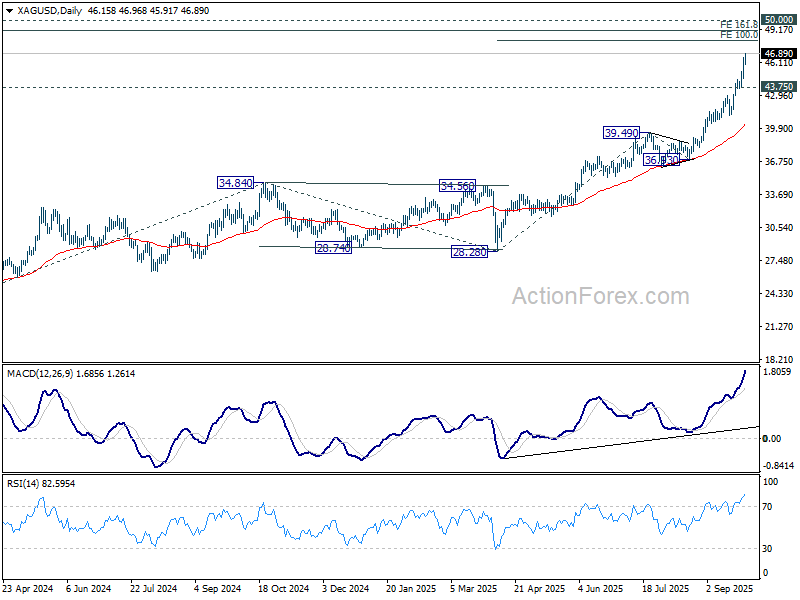
Between 161.8% projection of 21.92 to 34.84 from 28.28 at 49.18 and 50 psychological level, Silver faces a heavy resistance band that could complete its five-wave rally from 17.54 (2022 low). If rejected by 50, the metal could retrace rapidly, mirroring the kind of correction gold risks at 4000.
The message is clear: while fundamentals still favor precious metals, the technical picture is flashing caution. Traders should be tightening stops and locking in gains above 3800 in Gold and 48 in Silver, and be prepared for the possibility of sharp reversals.
Non-farm payrolls to decide fate of December Fed cut
Markets step into the final quarter of 2025 facing a dense calendar of high-stakes events. The spotlight is firmly on the US, with September’s non-farm payrolls and the ISM surveys set to guide the next leg of Fed expectations. After a run of resilient US data, investors are questioning how much scope remains for additional easing this year.
The October cut is still priced as near-certain, but the conviction for a follow-up move in December has started to erode. Markets increasingly see the Fed delivering just one more insurance cut to cushion the labor market rather than embarking on a deeper easing cycle. Unless data takes a sudden turn lower, the prospect of a year-end move will diminish further.
Non-farm payrolls will be the main test. A solid report would likely drive December cut odds even lower, especially if job creation show sign of rebound. By contrast, a weaker-than-expected number could revive market conviction that the Fed will act twice more this year, but such an outcome looks less probable after the recent run of firm data.
In the run-up to NFP, sentiment may shift on a series of important releases. Consumer confidence and ISM Manufacturing will all feed into the growth narrative, as well as ISM Services after NFP. These interim prints may create volatility across Dollar pairs, but none are expected to fundamentally challenge the October cut baseline.
In the Asia-Pacific, the RBA holds its policy meeting, where rates are widely expected to remain at 3.60%. The subtle hawkish lean from Governor Michele Bullock, combined with an upside surprise in August CPI, has already prompted traders to scale back bets on a November cut. Bullock’s tone this week will be crucial in gauging how seriously the Board views resurgent price pressures from strong domestic demand.
Should Bullock’s comments reinforce hawkish expectations, Australian Dollar could find support, particularly in the crosses. Even without an outright shift in forward guidance, a firmer stance on inflation risks could differentiate AUD from its weaker commodity peers.
Japan also enters the spotlight with the BoJ’s Summary of Opinions from the September meeting due. The release could shed more light on the growing internal divide, after two members dissented in favor of a hike. Any evidence that additional board members are edging toward that camp would sharpen expectations for an earlier move.
Alongside the Summary, the Tankan survey will provide a critical gauge of corporate sentiment and investment intentions, both essential inputs for BoJ’s policy deliberations.
In Europe, CPI releases from the Eurozone and Switzerland round out the week, likely confirming steady stances from both the ECB and SNB.
Here are some highlights for the week:
- Monday: UK M4 money supply, mortgage approvals; US pending home sales.
- Tuesday: BoJ summary of opinions, industrial production, retail sales; New Zealand ANB business confidence; RBA rate decision; China PMIs; Germany import prices, retail sales, unemployment; UK Q2 GDP final; Swiss KOF economic barometer; US house price index, Chicago PMI, consumer confidence.
- Wednesday: Japan Tankan survey, PMI manufacturing final; Swiss retail sales, PMI manufacturing; Eurozone PMI manufacturing final, CPI flash; US ADP employment, ISM manufacturing; BoC summary of deliberations.
- Thursday: Japan monetary base, consumer confidence; Australia trade balance, household spending; Swiss CPI; Eurozone unemployment rate; US jobless claims, factory orders.
- Friday: Japan unemployment rate; Eurozone PMI services final, PPI; UK PMI services final; US non-farm payrolls, ISM services.
USD/JPY Daily Outlook
Daily Pivots: (S1) 149.28; (P) 149.62; (R1) 149.83; More...
Intraday bas in USD/JPY is turned neutral first as retreat from 149.95 deepens. Some consolidations would be seen first but further rally is expected as long as 147.45 support holds. Corrective pattern from 150.90 should have completed at 145.47. Above 149.95 will bring retest of 150.90 first. Firm break there will target 151.22 fibonacci level. However, sustained break of 147.45 will dampen this bullish view and bring deeper fall to 145.47 support instead.
In the bigger picture, price actions from 161.94 (2024 high) are seen as a corrective pattern to rise from 102.58 (2021 low). Decisive break of 61.8% retracement of 158.86 to 139.87 at 151.22 will argue that it has already completed with three waves at 139.87. Larger up trend might then be ready to resume through 161.94 high. In case the corrective pattern extends with another fall, strong support is expected from 38.2% retracement of 102.58 to 161.94 at 139.26 to bring rebound.
EUR/USD Trims Gains – Why Traders Fear Recovery Will Stall Quickly
Key Highlights
- EUR/USD started a fresh decline from the 1.1920 resistance.
- A major bearish trend line is forming with resistance near 1.1750 on the 4-hour chart.
- GBP/USD also declined over 400 pips from the 1.3725 zone.
- USD/JPY rallied and traded closely to the 150.00 handle.
EUR/USD Technical Analysis
The Euro failed to stay above 1.1880 and started a fresh decline versus the US Dollar. EUR/USD declined below 1.1820 and 1.1750 to enter a bearish zone.
Looking at the 4-hour chart, the pair settled below the 1.1750 level, the 100 simple moving average (red, 4-hour), and the 200 simple moving average (green, 4-hour). A low was formed at 1.1645 and the pair is now attempting to recover.
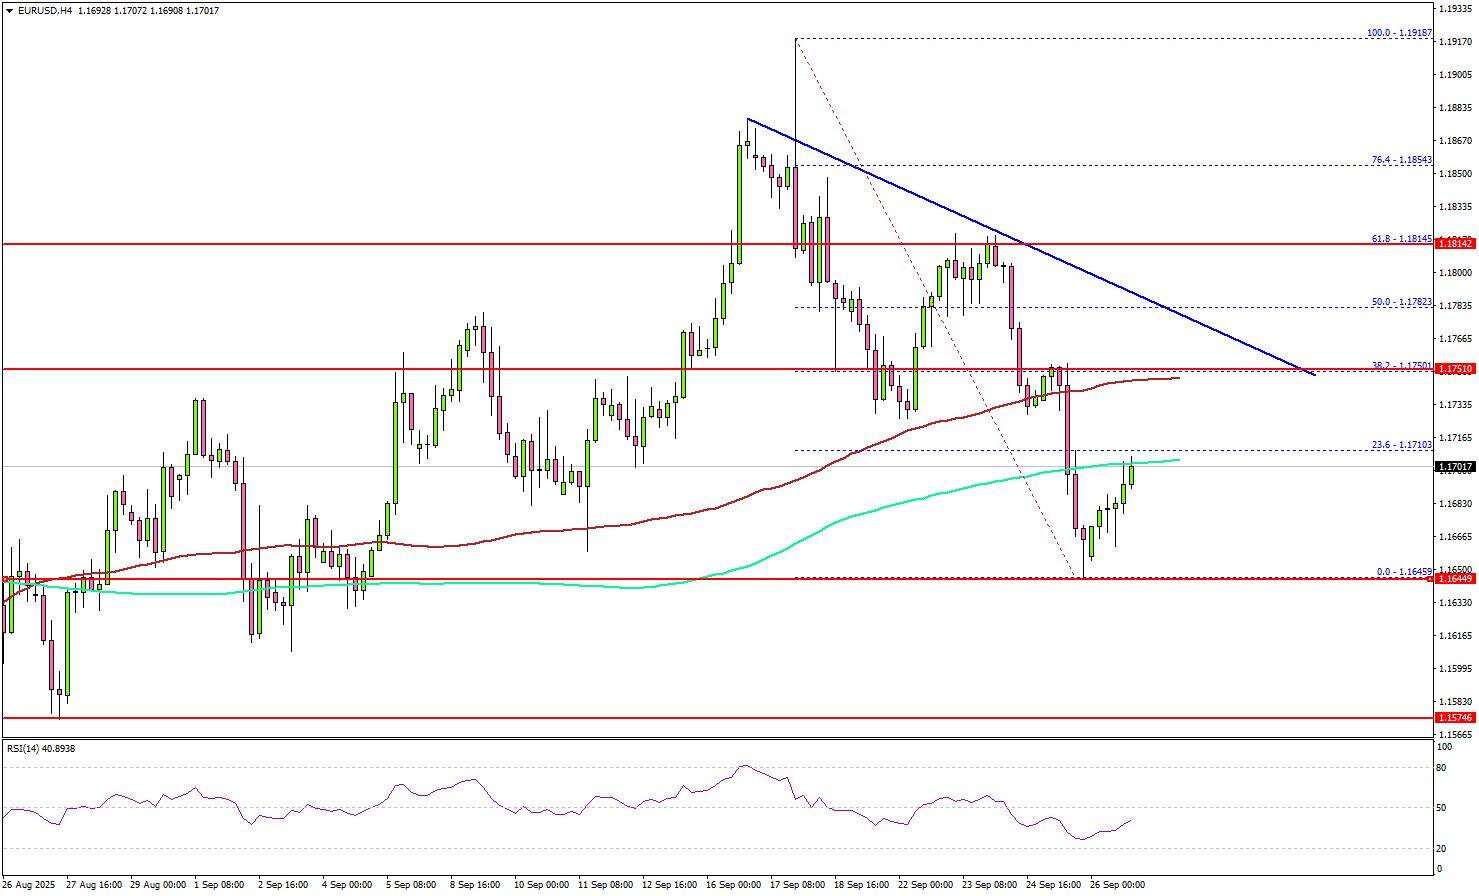
There was a minor increase above the 1.1680 level. On the upside, the pair could face resistance near the 1.1735 level. The first major hurdle for the bulls could be 1.1750 since it coincides with the 38.2% Fib retracement level of the downward move from the 1.1918 swing high to the 1.1645 low.
There is also a major bearish trend line forming with resistance near 1.1750 on the same chart. A close above 1.1750 could set the pace for another rally. In the stated case, the pair could rise toward 1.1815, above which the bulls could aim for a move toward 1.1850. Any more upsides could send the pair toward 1.1920.
On the downside, there is a key support at 1.1650. The next area of interest might be 1.1600. The main support could be 1.1550. Any more losses might increase selling pressure and send EUR/USD toward 1.1440.
Looking at GBP/USD, the pair gained bearish momentum below 1.3500 and even tested the 1.3320 support zone.
Upcoming Key Economic Events:
- Euro Zone Economic Sentiment Index for Sep 2025 – Forecast 95.2, versus 95.2 previous.
- ECB's Nagel speech.
- ECB's Schnabel speech.