Sample Category Title
AUD/USD Daily Report
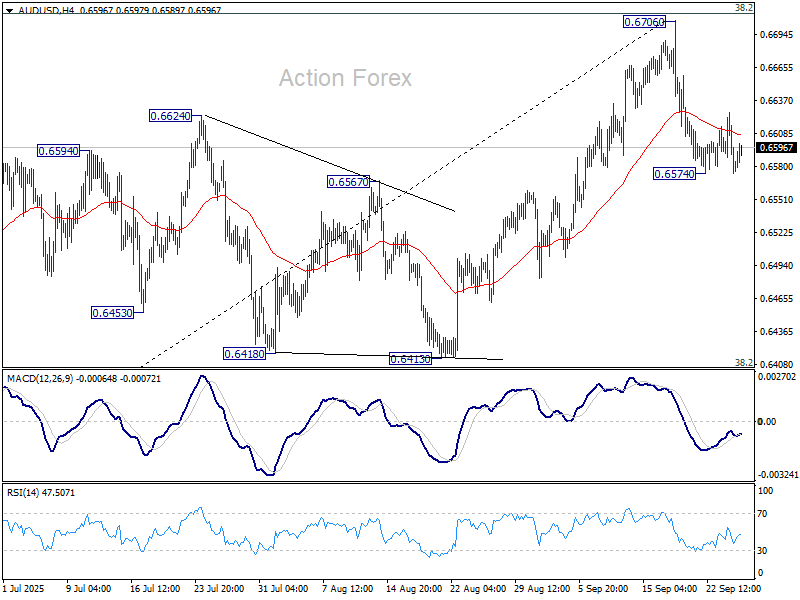
Daily Pivots: (S1) 0.6563; (P) 0.6595; (R1) 0.6616; More...
Intraday bias in AUD/USD remains neutral first and more consolidations could be seen. On the downside, below 0.6574 will resume the fall from 0.6706 short term top to 55 D EMA (now at 0.6545). Firm break there will target 0.6413 support. On the upside, however, decisive break of 0.6713 fibonacci level will resume rally from 0.5913, and carry larger bullish implications.
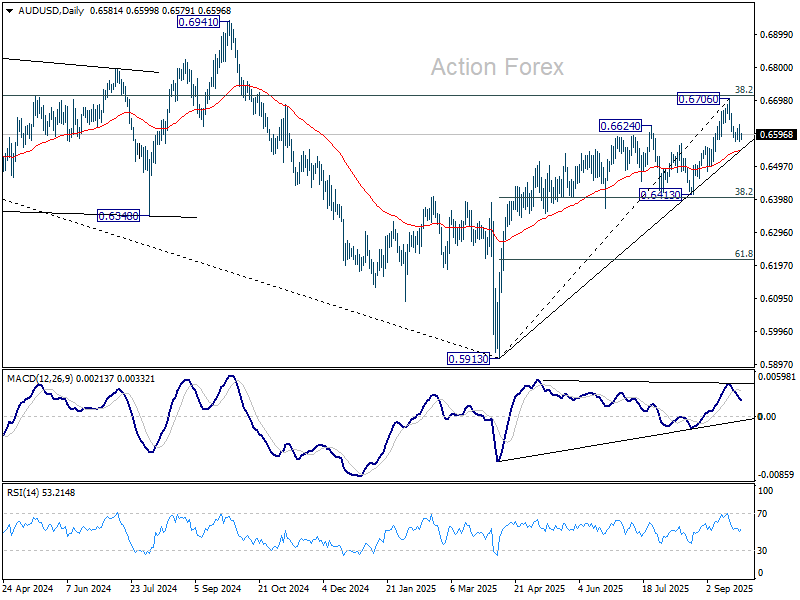
In the bigger picture, there is no clear sign that down trend from 0.8006 (2021 high) has completed. Rebound from 0.5913 is seen as a corrective move. Outlook will remain bearish as long as 38.2% retracement of 0.8006 to 0.5913 at 0.6713 holds. Nevertheless, considering bullish convergence condition in W MACD, sustained break of 0.6713 will be a strong sign of bullish trend reversal, and path the way to 0.6941 structural resistance for confirmation.
Calm into US Growth, Inflation Data
Risk sentiment was limited across European and US indices yesterday, as investors likely decided to take profits on the latest rally and step aside before fresh data hits. Federal Reserve (Fed) member Mary Daly said she would support further policy easing but stressed the need to proceed cautiously to avoid oversteering. Her comments came a day after Jerome Powell refrained from committing to further rate cuts, citing lingering inflation risks. He also noted that asset valuations look high—but, of course, that’s not the Fed’s mandate. Lowering rates while raising growth forecasts certainly helps, Jerome! Either way, Fed commentary this week is unlikely to provide broad market support.
AI and sector-related news remains supportive: Nvidia said it will invest up to $100 bn in OpenAI, while OpenAI plans roughly $400 bn to develop five new US data centers—signaling continued capital rotation toward those in this exclusive tech club. Yet, investors appear hesitant to buy more this week.
Micron, for example, posted a blowout quarter, with revenues and profits smashing expectations thanks to insatiable AI demand and soaring cloud memory margins. Yet the stock fell nearly 3% as investors cashed in after its stellar run. Guidance was bullish—pointing to even stronger sales and profits ahead, with HBM capacity sold out into 2026—but remained insufficient to bring more investors in, leading investors to question whether - after a 170% rally since April - Micron’s story is already priced in, or is this just a pause before the next leg higher? Time will tell.
On the other side of the world, investors aren’t yet ready to take profits, as more gains may be available. Alibaba jumped over 9% yesterday and is again up this morning, testing highs not seen since 2021. Some may cry “bubble,” but the company trades at a PE of ~26 versus Amazon’s ~33, so it’s still cheaper, though the gap is narrowing. There may still be room for Chinese tech stocks to run further—supported by domestic funds—but valuations will soon come under scrutiny.
Today, all eyes are on the latest US GDP update, a key pulse check for investors. US growth is expected to have rebounded to 3.3% in Q2—following a sharp disruption from the trade war in Q1—supporting the “soft landing” narrative. But a soft landing is a double-edged sword: a stronger-than-expected print could reignite concerns that the Fed may refrain from cutting rates further, especially next year when Fed members hold divergent views. That scenario would push bond yields higher, strengthen the US dollar and weigh on equities. Conversely, a softer GDP read would likely bolster bets on further Fed easing, sending yields lower, lifting stocks and softening the dollar. Combined with tomorrow’s PCE data, today’s GDP print could set the tone across bonds, stocks and currencies after weeks of dovish shifts in Fed expectations.
In FX, the US dollar rebounded yesterday, limiting gains in majors like EURUSD and Cable near key psychological levels. The EURUSD faced solid offers above 1.18, while Cable failed to defend 1.35. As I noted last week after the Fed decision, a minor USD upside correction is possible as dovish expectations adjust. Data showing resilient growth, jobs or higher prices should support USD recovery, even though the medium/long-term outlook remains negative due to waning appetite for US debt and rising doubts about the dollar’s global reserve status— due to US withdrawal from trade and military commitments.
But hey, it’s not just US debt that’s unloved: British gilts remain out of favour as well. This week’s UK Treasury auctions highlighted growing investor unease: demand for the 30-year bond was the weakest since 2022, while the 5-year sale had the thinnest cushion in nearly two years. Tepid appetite underscores how rising budget concerns are weighing on long-term debt and, in turn, UK growth prospects, at a time when inflation pressures keep the Bank of England’s (BoE) hands tied. Sterling looks unappealing ahead of the Autumn Budget.
Here in Switzerland, the Swiss National Bank (SNB) will likely maintain its policy rate at 0%. Returning to negative rates could be a step too far given the current economic backdrop and franc’s stability. However, the franc is stable near its all-time strongest levels against both the US dollar and the euro, suggesting that while the SNB is expected to hold above zero through 2026, direct FX interventions could become increasingly likely if demand for the franc spikes again.
Eyes on SNB Meeting
In focus today
In Switzerland, the big event for markets this week is today's SNB meeting with the decision announced at 9:30 CET and a press conference at 10:00 CET. We expect the SNB to keep the policy rate unchanged at 0%, which is fully in line with both market pricing and consensus. Inflation has largely followed the SNB's June projections, which assumed no changes to the policy rate. This supports the expectation that the SNB will keep the policy rate unchanged.
This morning, we will host a webinar update on China-US trade war, its economic implications and the outlook for CNY and USD. In the afternoon, US durable goods orders and initial trade balance are due for release for August. In the evening, a range of Fed speakers will be on the wires, including Goolsbee, Williams, Schmid, Daly and Bowman.
In Sweden, the producer and import price index will be released for August. This is one of several tools to assess inflationary pressures in the system, which may impact consumer prices down the road, which is something the Riksbank will stay focused on. We will also receive the August outcome for financial market statistics, with a particular focus on developments in household borrowing as well as data on mortgage interest rate levels, among other aspects.
Economic and market news
What happened yesterday
In Germany, the Ifo index unexpectedly fell to 87.7 in September (cons: 89.4) from 88.9, contrasting with yesterday's positive PMI surprise. The current assessment dropped to 85.7 (cons: 86.6) from 86.4, while expectations declined to 89.7 (cons: 92.0) from 91.4, returning to levels last seen four months ago. As the Ifo covers more companies than PMIs, it suggests German activity was weaker than initially indicated in September.
In the US, the trade deal with the EU was formally implemented, reducing tariffs on autos and auto parts to 15% (from 25%) retroactive to 1 August. The deal also exempts EU aircraft, generic pharmaceuticals, natural resources, and hundreds of components from tariffs. Shares in German automakers, including Porsche and BMW, rose on the announcement, easing uncertainty in the auto industry.
The White House instructed federal agencies to prepare mass firing plans ahead of a potential government shutdown on 1 October, diverging from the usual practice of temporary furloughs. The directive aligns with President Trump's push to reduce the federal workforce, with 154,000 employees already set to leave by 30 September. The shutdown risk remains high as Congress struggles to reach a funding agreement.
In Sweden, the NIER Economic Tendency Survey improved in September, with the overall tendency indicator rising to 97.2 from 96.0. Manufacturing confidence increased to 98.6 (previous: 97.0), while consumer confidence rose to 93.2 (previous: 91.1). Price plans for the next three months remained largely unchanged, with increases in retail and construction but declines in manufacturing and services, aligning with historical averages in the latter sectors but staying above normal in construction and trade.
Equities: Sour risk sentiment weighed on equities, pushing most sectors lower. However, energy, utilities, and consumer discretionary sectors posted noteworthy positive returns. In consumer discretionary, this was largely driven by a 4% gain in Tesla, while energy was supported by rising oil prices. S&P 500 ended the day down 0.4%, with Nasdaq down 0.3%. Stoxx600 declined 0.2%. Automakers had a strong session, buoyed by the US Department of Commerce's announcement that auto import tariffs from the EU would be reduced to 15%, retroactively effective from 1 August.
FI and FX: Strong USD performance across the board. USD/JPY was on the verge to take out 149 and EUR/USD re-tested the support just below 1.1730. The Scandies and the antipodeans were the biggest losers against the greenback as lower equities took their toll on risk-sensitive currencies. USD/SEK and USD/NOK were both up some eight figures. Equity futures suggest a mixed opening today. EUR/CHF is flat ahead of the SNB decision at 09:30 CET where we and markets expect the policy rate to be left unchanged at 0.0%.
Treasuries traded poorly and the 5-year auction met lukewarm demand and UST10y ended the US session at 4.15%. Tonight's US7y auction will be watched closely.
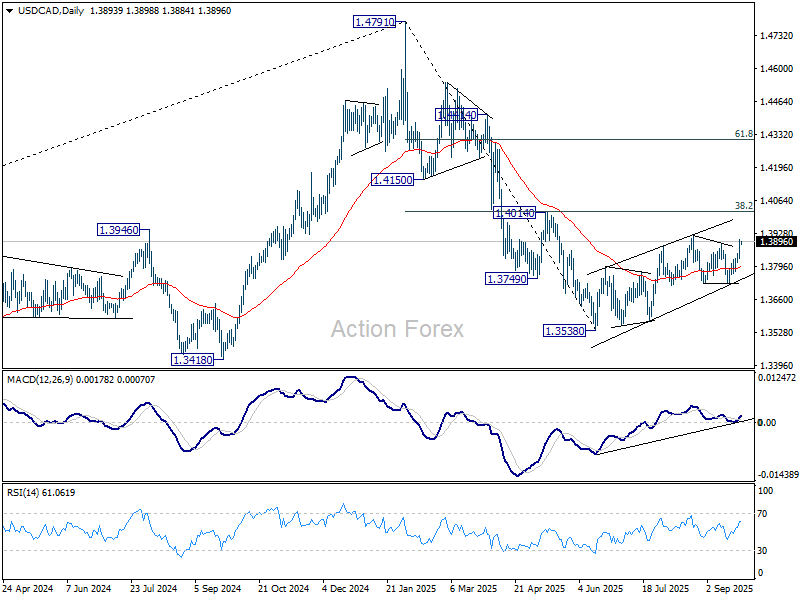
USD/CAD Daily Outlook
Daily Pivots: (S1) 1.3815; (P) 1.3832; (R1) 1.3853; More...
USD/CAD's break of 1.3889 resistance should confirm that consolidations from 13.923 has completed at 1.3725. Corrective rebound form 1.3538 should be resuming. Intraday bias is back on the upside for 1.3923 first. Firm break there will target 1.4014 key cluster resistance. On the downside, however, below 1.3841 minor support will turn intraday bias neutral again.
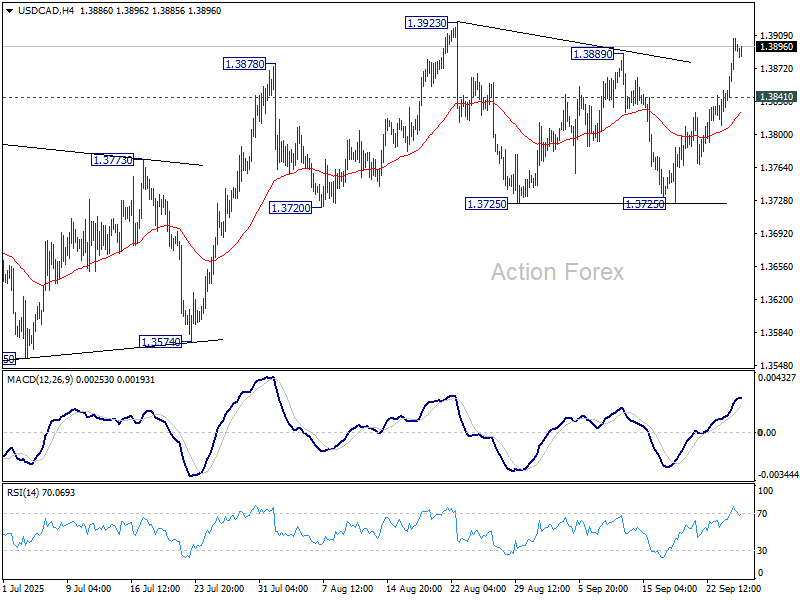
In the bigger picture, price actions from 1.4791 medium term top could either be a correction to rise from 1.2005 (2021 low), or trend reversal. In either case, further decline is expected as long as 1.4014 cluster resistance (38.2% retracement of 1.4791 to 1.3538 at 1.4017) holds. Next target is 61.8% retracement of 1.2005 (2021 low) to 1.4791 (2025 high) at 1.3069.
BoJ Hawkish Lean Fails to Lift Yen, Franc Outperforms Ahead of SNB
Trading remains subdued in the Asian session, with all major currency pairs locked inside yesterday’s ranges. Directional conviction remains elusive as traders look to fresh catalysts from both data and central bank events.
Minutes from the BoJ’s July meeting leaned hawkish, showing more board members are warming to the idea of returning to rate hikes. The tone was consistent with the September policy meeting, where two members dissented in favor of raising the policy rate to 0.75%. Yet the hawkish signals have done little to lift Yen. Instead, the currency is pressured by sustained risk-on sentiment across equities and stabilization in U.S. Treasury yields.
Meanwhile, Dollar is pausing after yesterday’s rally attempt, with investors awaiting fresh direction. Durable goods orders and jobless claims are due later in the day, providing an early test before Friday’s PCE inflation, the Fed’s preferred gauge. A slate of Fed officials are also scheduled to speak.
So far this week, the Franc leads gains as investors position for the SNB decision later today. Dollar ranks second and Aussie third with boost quickly fading. At the bottom, Loonie lags, followed by Kiwi and Yen. Euro and Sterling are trading in the middle.
In Asia, at the time of writing, Nikkei is up 0.23%. Hong Kong HSI is down -0.05%. China Shanghai SSE is down -0.13%. Singapore Strait Times is down -0.25%. Japan 10-year JGB yield is up 0.009 at 1.648. Overnight, DOW fell -0.37%. S&P 500 fell -0.28%. NASDAQ fell -0.33%. 10-year yield rose 0.027 to 4.147.
BoJ minutes point to year-end hike possibility
The BoJ’s July meeting minutes revealed a growing debate among policymakers over the need to raise rates toward neutral levels. One member argued that with prices elevated and the output gap near zero, it was appropriate for the BoJ to “return the policy rate to its neutral level where possible.”
Another member warned against being “overly cautious,” saying the central bank should not miss the opportunity to hike rates, particularly as stock markets have reacted positively to the recent U.S.–Japan trade deal. Several others echoed this view, suggesting that another hike could be feasible before year-end if tariffs cause only limited drag on the economy.
Meanwhile, policymakers were divided on inflation. While one saw the overshoot as temporary and food-related, others highlighted the risk that persistent food price increases could entrench higher inflation expectations.
The debate has since intensified, as seen in September’s meeting when two members dissented in favor of lifting rates to 0.75%. The growing hawkish faction raises the prospect that the BoJ could still deliver another rate hike in the coming months, particularly if growth and inflation prove resilient.
Fed's Daly: Unsure on next cut, economy still needs policy bridling
San Francisco Fed President Mary Daly said she “fully supported” last week’s rate cut and expects more reductions will likely be needed. However, at an event overnight, she stressed that the timing for further cuts remains uncertain."It's hard to say", she said.
Daly described the labor market as no longer solid but not weak either, calling it “sustainable.” She said she does not want to see further softening, noting that the Fed’s latest decision was effectively an "insurance" move to support jobs while inflation continues to moderate.
The economy, she added, still requires "monetary policy bridling, but not as much as we had."
BoE's Greene: Must prioritize inflation, cuts should be cautious
BoE MPC member Megan Greene said in a speech overnight that UK inflation remains an outlier among developed peers, with headline CPI running above target for over four years and rising again over the past year. She noted that disinflation has been concentrated in rate-sensitive sectors, suggesting "the bulk of disinflation may have already come through", while labor market slack has emerged.
Greene argued that the data has the “hallmark of an adverse supply shock,” but said second-round wage effects are unlikely to pose major risks as the labor market loosens. She added that while risks from trade persist, they have eased somewhat, and GDP growth is expected to rebound without a sharp deterioration in jobs.
She stressed two lessons from recent supply shocks: when inflation persistence is uncertain, policymakers should prioritize inflation to prevent it from becoming entrenched, and that prices may respond faster than output when inflation is elevated.
Against that backdrop, she said "an appropriate response to the uncertainty and risks we are currently facing should involve a cautious approach to rate cuts going forward", reinforcing her vote last week to keep Bank Rate at 4%.
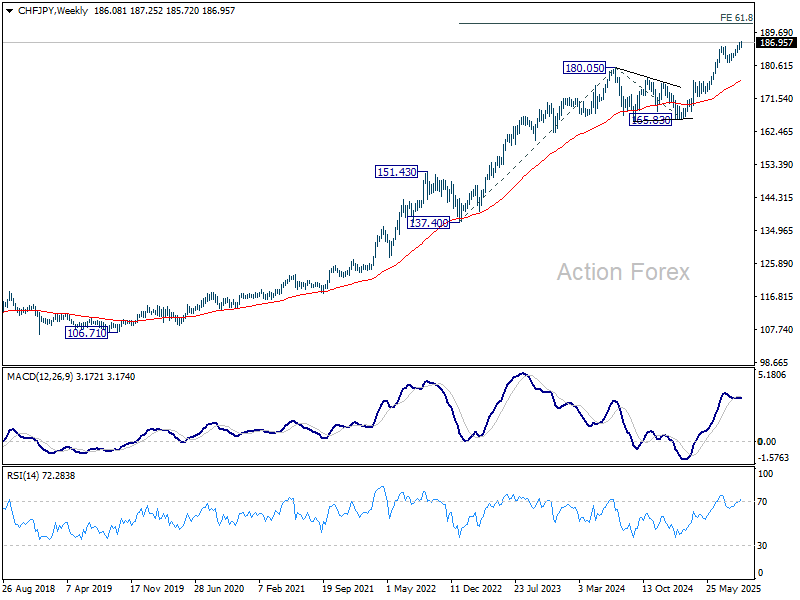
SNB set to hold at 0.00%, CHF/JPY rising toward 189.45
SNB’s policy decision is the main focus for today’s European session, with the central bank widely expected to keep rates unchanged at 0.00%. This would mark its first pause since December 2023, reflecting both steady inflation trends and a more stable external backdrop.
Inflation has stabilized slightly above 0% since June, easing fears of a return to deflation. With the ECB also settling at 2.00%, appreciation pressure on Swiss Franc has moderated, reducing the need for the SNB to counter imported disinflation. Additionally, Chairman Martin Schlegel has stressed that the bar for reintroducing negative rates is high, further supporting a steady stance.
Market consensus is strongly aligned with this view. A Reuters poll taken last week showed 40 out of 41 economists expect no change, with only one forecasting a cut to -0.25%. More than 80% of economists see rates remaining on hold through year-end, and a strong majority (21 of 25 economists) expect policy to stay unchanged at 0.00% even through 2026.
Swiss Franc has been one of the better performers this month, underpinned by its safe-haven appeal amid persistent geopolitical risks, particularly the war in Ukraine. Expectations of SNB stability have also lent support. That said, the rebound in U.S. and European bond yields has capped further upside for Franc, although the pressure has weighed more heavily on Yen.
Technically, for the near term, further rally is expected in CHF/JPY as long as 55 D EMA (now 183.63) holds. Current rise from 181.45 is seen as the fifth wave of the whole rally from 165.83. It should be on track to 61.8% projection of 173.06 to 186.02 from 181.45 at 189.45.
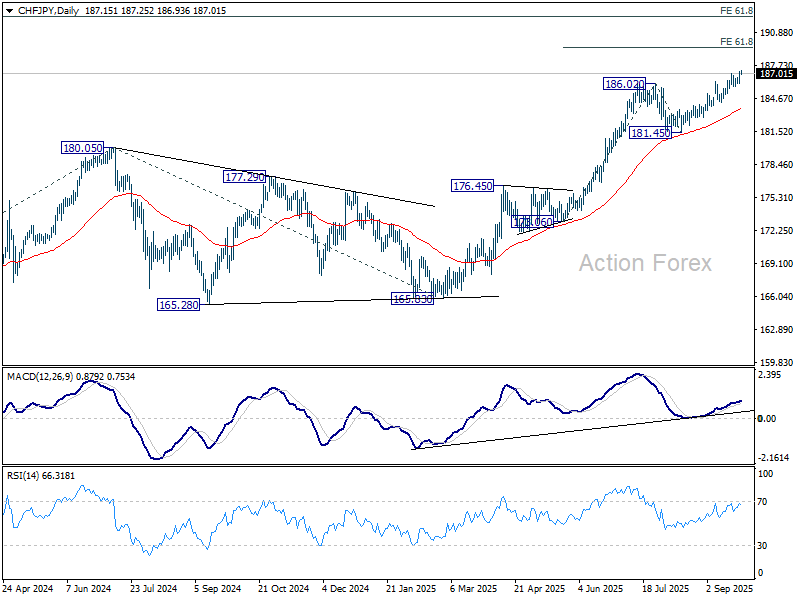
The bigger hurdle would be in 61.8% projection of 137.40 to 180.05 from 165.83 at 194.88, which could limit upside and bring a more notable consolidation or pullback.
USD/CAD Daily Outlook
Daily Pivots: (S1) 1.3815; (P) 1.3832; (R1) 1.3853; More...
USD/CAD's break of 1.3889 resistance should confirm that consolidations from 13.923 has completed at 1.3725. Corrective rebound form 1.3538 should be resuming. Intraday bias is back on the upside for 1.3923 first. Firm break there will target 1.4014 key cluster resistance. On the downside, however, below 1.3841 minor support will turn intraday bias neutral again.
In the bigger picture, price actions from 1.4791 medium term top could either be a correction to rise from 1.2005 (2021 low), or trend reversal. In either case, further decline is expected as long as 1.4014 cluster resistance (38.2% retracement of 1.4791 to 1.3538 at 1.4017) holds. Next target is 61.8% retracement of 1.2005 (2021 low) to 1.4791 (2025 high) at 1.3069.
SNB set to hold at 0.00%, CHF/JPY rising toward 189.45
SNB’s policy decision is the main focus for today’s European session, with the central bank widely expected to keep rates unchanged at 0.00%. This would mark its first pause since December 2023, reflecting both steady inflation trends and a more stable external backdrop.
Inflation has stabilized slightly above 0% since June, easing fears of a return to deflation. With the ECB also settling at 2.00%, appreciation pressure on Swiss Franc has moderated, reducing the need for the SNB to counter imported disinflation. Additionally, Chairman Martin Schlegel has stressed that the bar for reintroducing negative rates is high, further supporting a steady stance.
Market consensus is strongly aligned with this view. A Reuters poll taken last week showed 40 out of 41 economists expect no change, with only one forecasting a cut to -0.25%. More than 80% of economists see rates remaining on hold through year-end, and a strong majority (21 of 25 economists) expect policy to stay unchanged at 0.00% even through 2026.
Swiss Franc has been one of the better performers this month, underpinned by its safe-haven appeal amid persistent geopolitical risks, particularly the war in Ukraine. Expectations of SNB stability have also lent support. That said, the rebound in U.S. and European bond yields has capped further upside for Franc, although the pressure has weighed more heavily on Yen.
Technically, for the near term, further rally is expected in CHF/JPY as long as 55 D EMA (now 183.63) holds. Current rise from 181.45 is seen as the fifth wave of the whole rally from 165.83. It should be on track to 61.8% projection of 173.06 to 186.02 from 181.45 at 189.45.
The bigger hurdle would be in 61.8% projection of 137.40 to 180.05 from 165.83 at 194.88, which could limit upside and bring a more notable consolidation or pullback.
BoJ minutes point to year-end hike possibility
The BoJ’s July meeting minutes revealed a growing debate among policymakers over the need to raise rates toward neutral levels. One member argued that with prices elevated and the output gap near zero, it was appropriate for the BoJ to “return the policy rate to its neutral level where possible.”
Another member warned against being “overly cautious,” saying the central bank should not miss the opportunity to hike rates, particularly as stock markets have reacted positively to the recent U.S.–Japan trade deal. Several others echoed this view, suggesting that another hike could be feasible before year-end if tariffs cause only limited drag on the economy.
Meanwhile, policymakers were divided on inflation. While one saw the overshoot as temporary and food-related, others highlighted the risk that persistent food price increases could entrench higher inflation expectations.
The debate has since intensified, as seen in September’s meeting when two members dissented in favor of lifting rates to 0.75%. The growing hawkish faction raises the prospect that the BoJ could still deliver another rate hike in the coming months, particularly if growth and inflation prove resilient.
Fed’s Daly: Unsure on next cut, economy still needs policy bridling
San Francisco Fed President Mary Daly said she “fully supported” last week’s rate cut and expects more reductions will likely be needed. However, at an event overnight, she stressed that the timing for further cuts remains uncertain."It's hard to say", she said.
Daly described the labor market as no longer solid but not weak either, calling it “sustainable.” She said she does not want to see further softening, noting that the Fed’s latest decision was effectively an "insurance" move to support jobs while inflation continues to moderate.
The economy, she added, still requires "monetary policy bridling, but not as much as we had."
BoE’s Greene: Must prioritize inflation, cuts should be cautious
BoE MPC member Megan Greene said in a speech overnight that UK inflation remains an outlier among developed peers, with headline CPI running above target for over four years and rising again over the past year. She noted that disinflation has been concentrated in rate-sensitive sectors, suggesting "the bulk of disinflation may have already come through", while labor market slack has emerged.
Greene argued that the data has the “hallmark of an adverse supply shock,” but said second-round wage effects are unlikely to pose major risks as the labor market loosens. She added that while risks from trade persist, they have eased somewhat, and GDP growth is expected to rebound without a sharp deterioration in jobs.
She stressed two lessons from recent supply shocks: when inflation persistence is uncertain, policymakers should prioritize inflation to prevent it from becoming entrenched, and that prices may respond faster than output when inflation is elevated.
Against that backdrop, she said "an appropriate response to the uncertainty and risks we are currently facing should involve a cautious approach to rate cuts going forward", reinforcing her vote last week to keep Bank Rate at 4%.
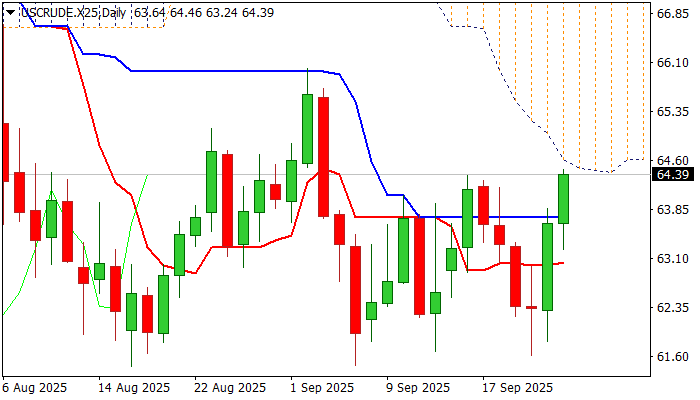
WTI Oil: Fresh Acceleration Higher Faces Strong Resistance from the Base of Thick Daily Cloud
WTI oil price rises for the second straight day, underpinned by renewed supply concerns and drop in US weekly crude inventories (API report on Tuesday -3.82 mln bls vs 3.64 mln bls previous week).
Oil advanced over 3% in past two days, following formation of Morning Doji Star reversal pattern on daily chart.
Bulls cracked important barriers at $64.27/37 (Fibo 61.8% of $66.01/$61.46 / Sep 16 recovery peak) but may face increased headwinds from nearby base of very thick daily Ichimoku cloud ($64.62). Technical picture on daily chart is mixed as positive momentum studies are countered by formation of 55/100DMA bear cross and pressure from daily cloud.
Two scenarios are currently in play, the fist one sees failure to close above recent range top ($64.37) that will keep the price within the range, although with slight bullish alignment as long as the price holds above $63.40 zone.
This scenario looks favored for now as daily cloud weighs on price and may temporarily sideline bulls.
The second scenario includes break of range top and penetration of daily cloud, which would generate positive signals of break above the range, recovery continuation and formation of higher base at $61.50 zone.
Res: 64.62; 64.94; 65.10; 66.01
Sup: 63.73; 63.40; 63.00; 62.53