
Sample Category Title
EUR/AUD Daily Outlook
Daily Pivots: (S1) 1.7812; (P) 1.7850; (R1) 1.7916; More...
Intraday bias in EUR/AUD is turned neutral first with current retreat. On the upside, break of 1.7929 temporary top will resume the rebound from 1.7588 to retest 1.8155 high. Firm break there will resume the whole rise from 1.7245. However, break of 1.7588 will resume the fall from 1.8155 instead.
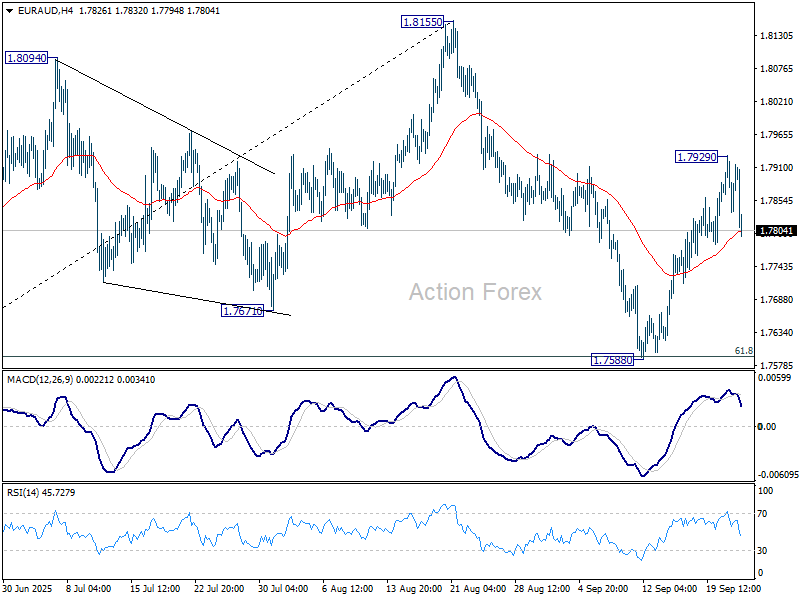
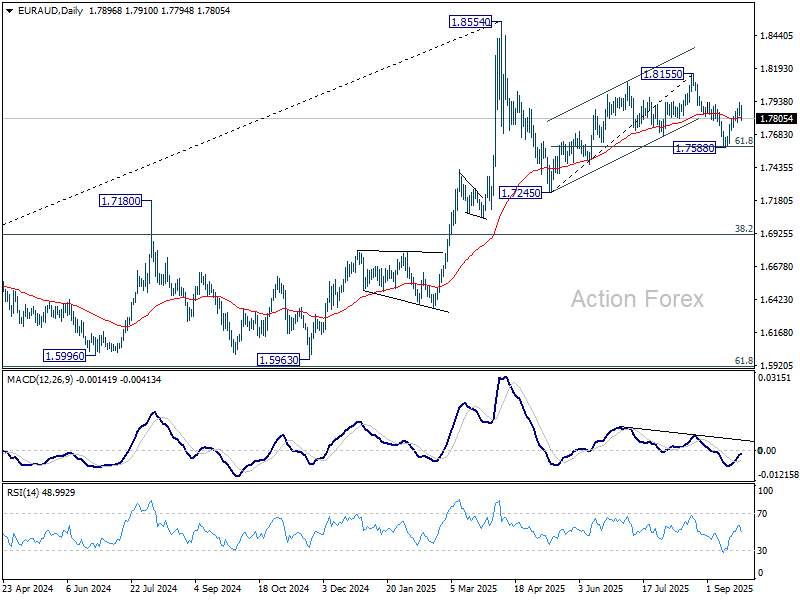
In the bigger picture, price actions from 1.8554 medium term top are seen as a corrective pattern. Deeper fall could be seen as the pattern extends, but downside should be contained by 38.2% retracement of 1.4281 (2022 low) to 1.8554 at 1.6922 to bring rebound. Uptrend from 1.4281 is expected to resume at a later stage.
EUR/JPY Daily Outlook
Daily Pivots: (S1) 174.04; (P) 174.38; (R1) 174.80; More...
Intraday bias in EUR/JPY is back on the upside with break of 174.48 temporary top. Further rise should be seen to retest 175.41 high. Decisive break there will resume larger up trend. However, firm break of 173.45 will turn bias back to the downside for deeper pullback to 172.11 support instead.
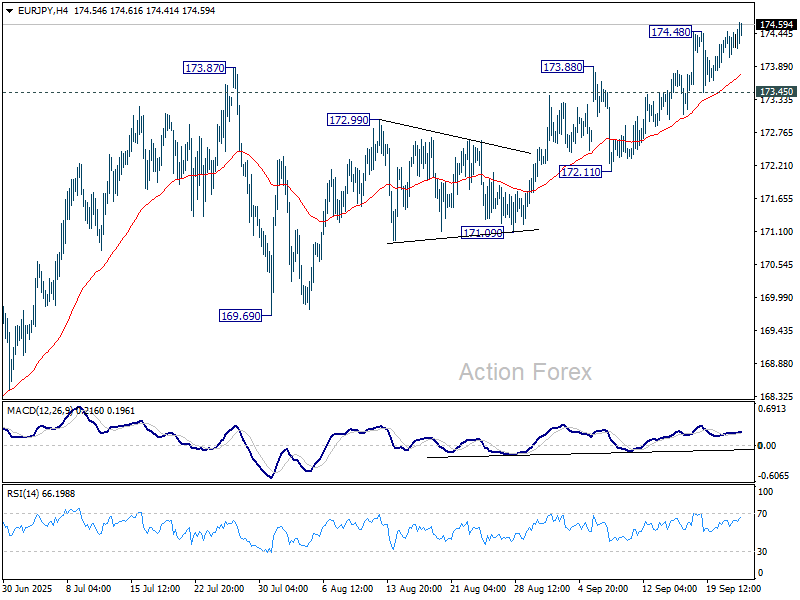
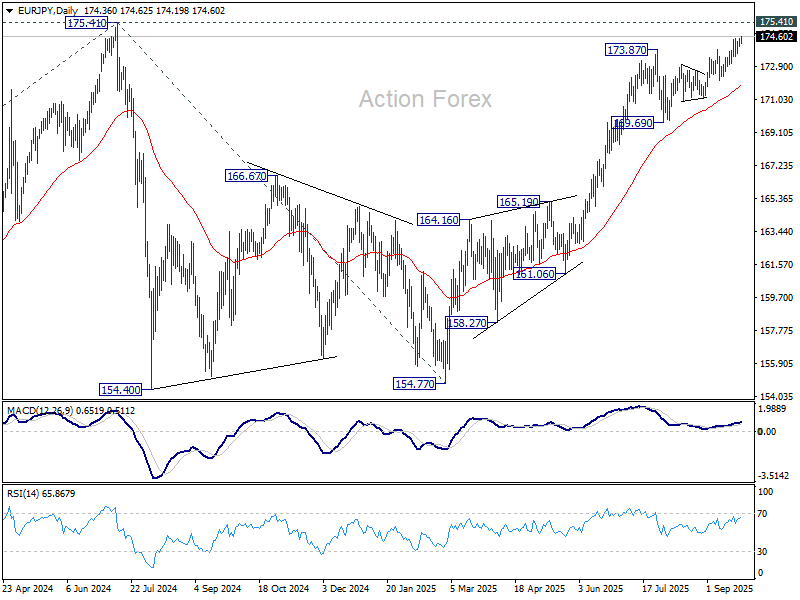
In the bigger picture, current rally from 154.77 is still tentatively seen as resuming the larger up trend. Firm break of 175.41 (2024 high) will confirm and target 61.8% projection of 124.37 (2022 low) to 175.41 from 154.77 (2025 low) at 186.31. However, sustained break of 169.69 support will delay this bullish case, and probably extend the correction from 175.41 with another fall.
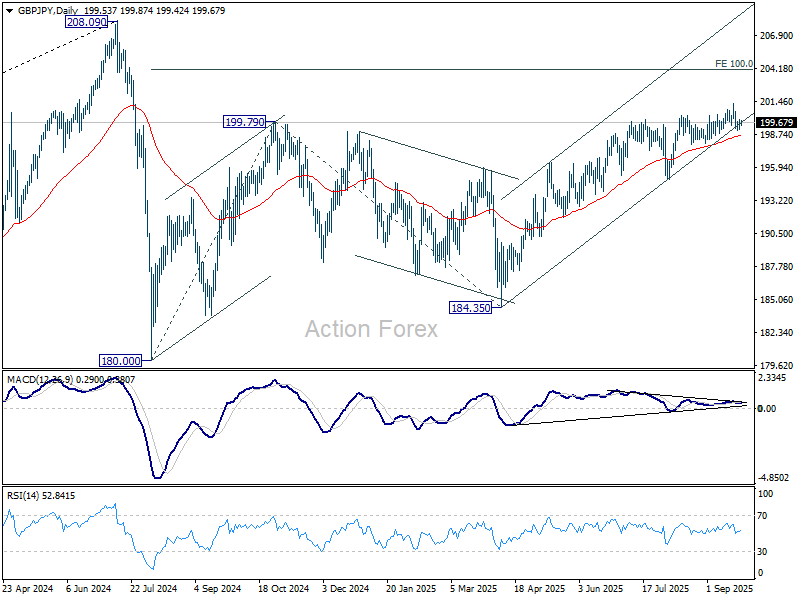
GBP/JPY Daily Outlook
Daily Pivots: (S1) 199.27; (P) 199.53; (R1) 199.89; More...
Intraday bias in GBP/JPY remains neutral and more consolidations would be seen below 201.24. Further rise is expected as long as 197.93 support holds. Firm break of 201.24 will target 100% projection of 180.00 to 199.79 from 184.35 at 204.14. However, considering bearish divergence condition in both D and 4H MACD, firm break of 197.93 will indicate bearish reversal and bring deeper fall back to 195.01 support first.
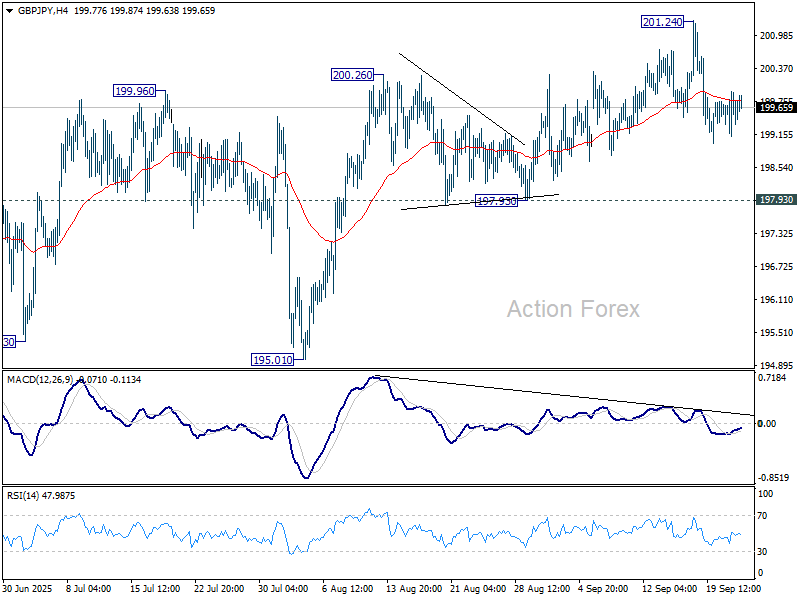
In the bigger picture, price actions from 208.09 (2024 high) are seen as a correction to rally from 123.94 (2020 low). The pattern might still extend with another falling leg. But in that case, strong support should be seen from 38.2% retracement of 123.94 to 208.09 at 175.94 to contain downside. Meanwhile, decisive break of 208.09 will confirm long term up trend resumption.
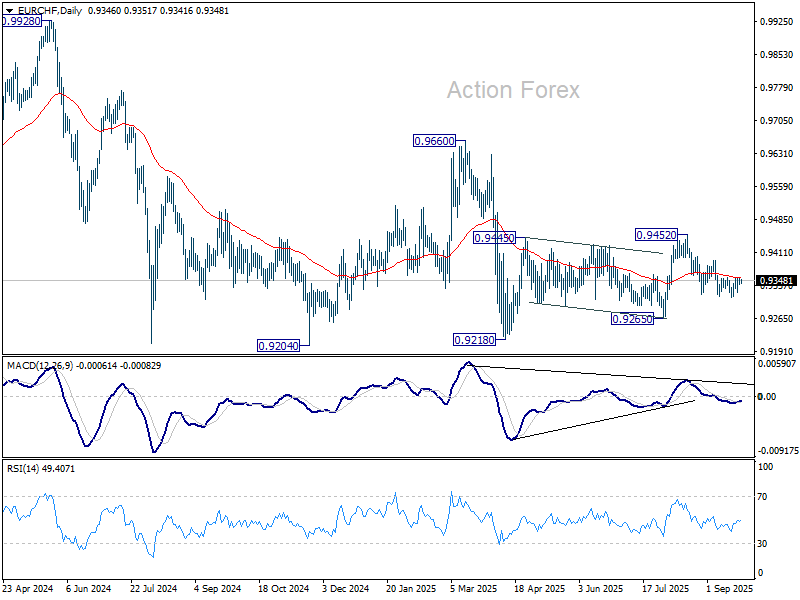
EUR/CHF Daily Outlook
Daily Pivots: (S1) 0.9341; (P) 0.9349; (R1) 0.9358; More...
Intraday bias in EUR/CHF remains neutral as range trading continues. Considering bullish convergence condition in 4H MACD, firm break of 0.9354 resistance will confirm short term bottoming, and bring stronger rebound to 0.9394 resistance. On the downside, break of 0.9311 will resume the fall from 0.9452 to 0.9265 support.
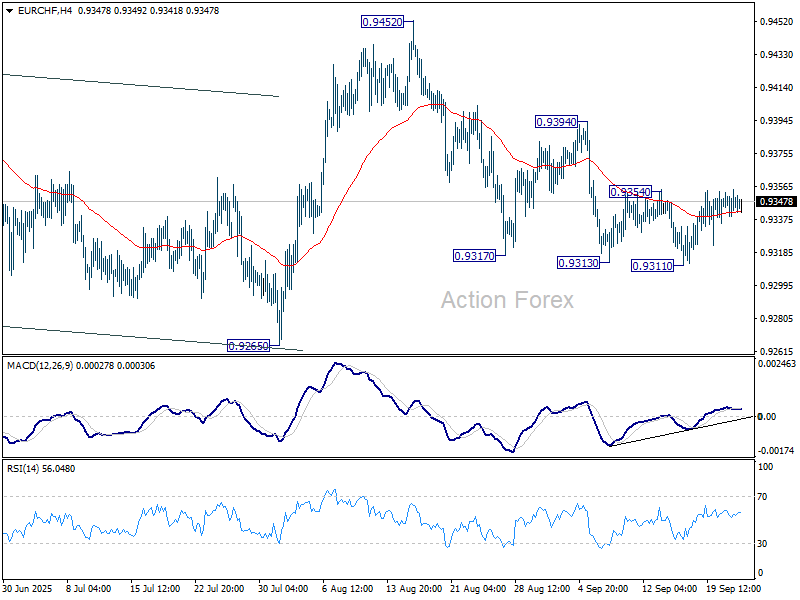
In the bigger picture, the down trend from 0.9204 (2018 high) might still be in progress considering that EUR/CHF is staying well inside the long term falling channel. However, with bullish convergence condition in W MACD, downside potential should be limited in case of another fall. Instead, firm break of 0.9660 resistance will be an important sign of medium term bullish trend reversal.
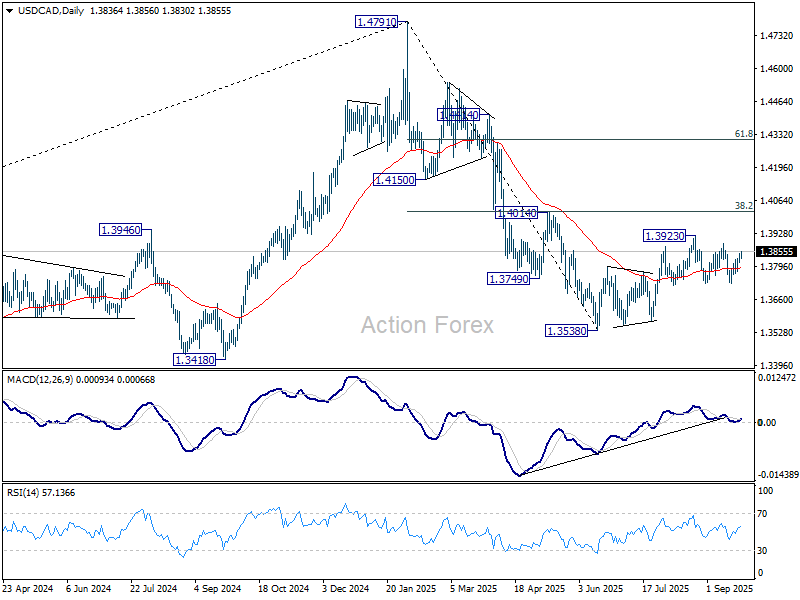
USD/CAD Daily Outlook
Daily Pivots: (S1) 1.3815; (P) 1.3832; (R1) 1.3853; More...
USD/CAD is still bounded in range of 1.3725/3889 and intraday bias remains neutral. On the upside, break of 1.3889 resistance will suggest that the corrective rebound from 1.3538 is resuming, and further rise should be seen through 1.3923 high towards 1.4014 cluster resistance. However, decisive break of 1.3725 will indicate that the corrective rebound has completed, and turn near term outlook bearish.
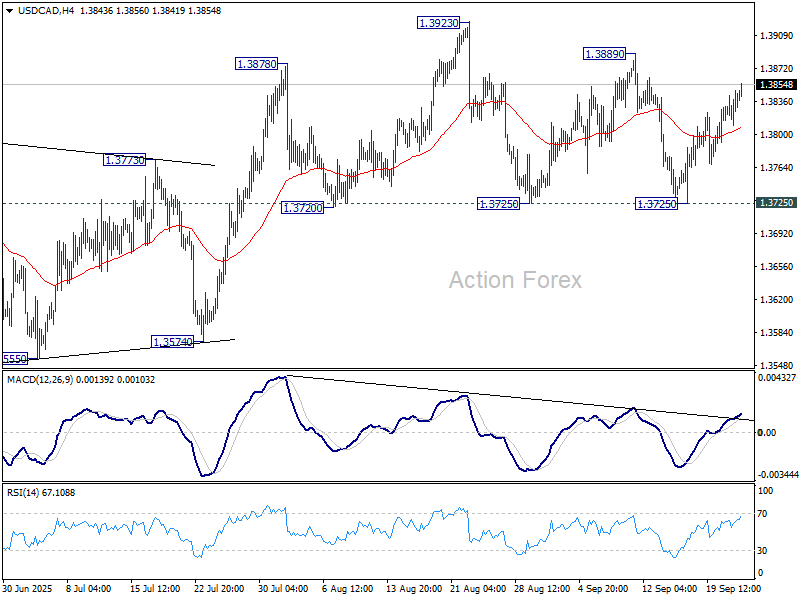
In the bigger picture, price actions from 1.4791 medium term top could either be a correction to rise from 1.2005 (2021 low), or trend reversal. In either case, further decline is expected as long as 1.4014 cluster resistance (38.2% retracement of 1.4791 to 1.3538 at 1.4017) holds. Next target is 61.8% retracement of 1.2005 (2021 low) to 1.4791 (2025 high) at 1.3069.
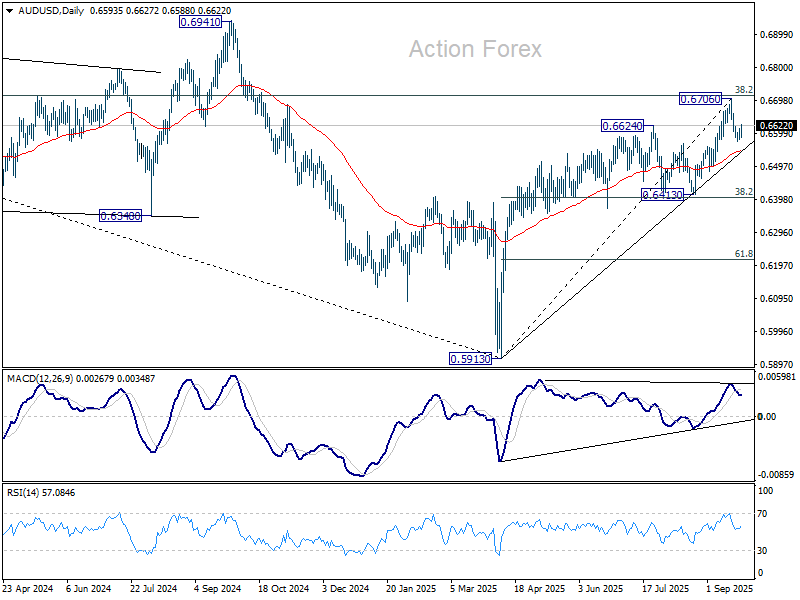
AUD/USD Daily Report
Daily Pivots: (S1) 0.6581; (P) 0.6599; (R1) 0.6616; More...
Despite breaching 0.6622 minor resistance. momentum of AUD/USD's recovery is so far weak. Intraday bias is turned neutral first. On the downside, below 0.6574 will resume the fall from 0.6706 short term top to 55 D EMA (now at 0.6544). Firm break there will target 0.6413 support. On the upside, however, decisive break of 0.6713 fibonacci level will resume rally from 0.5913, and carry larger bullish implications.
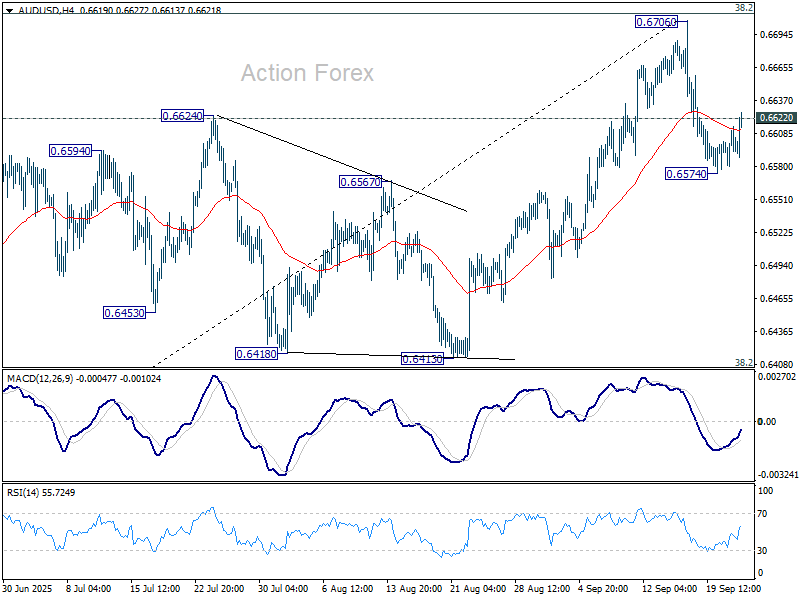
In the bigger picture, there is no clear sign that down trend from 0.8006 (2021 high) has completed. Rebound from 0.5913 is seen as a corrective move. Outlook will remain bearish as long as 38.2% retracement of 0.8006 to 0.5913 at 0.6713 holds. Nevertheless, considering bullish convergence condition in W MACD, sustained break of 0.6713 will be a strong sign of bullish trend reversal, and path the way to 0.6941 structural resistance for confirmation.
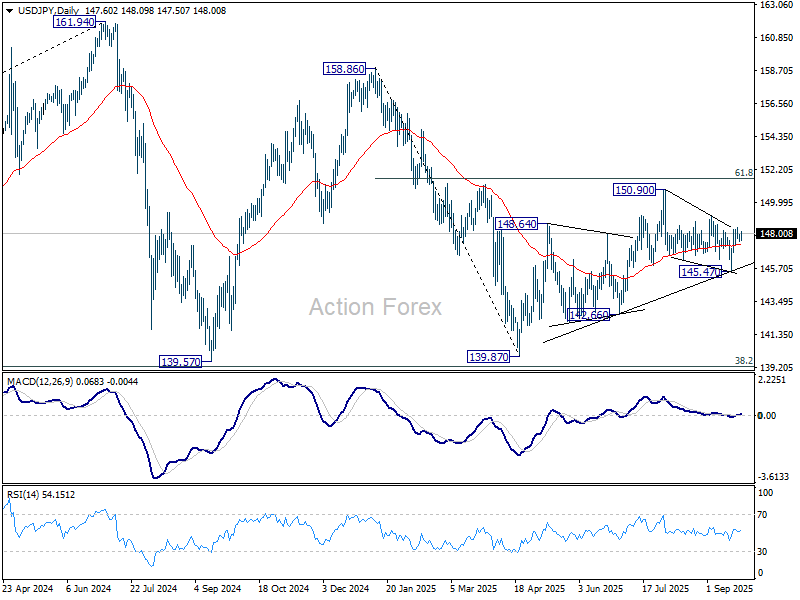
USD/JPY Daily Outlook
Daily Pivots: (S1) 147.44; (P) 147.68; (R1) 147.91; More...
Intraday bias in USD/JPY stays neutral at for the moment. Current development suggests that rise from 139.87 might still be in progress. On the upside, break of 149.12 will bring stronger rally to retest 150.90 high. However, break of 145.47 will resume the fall from 150.90 instead.
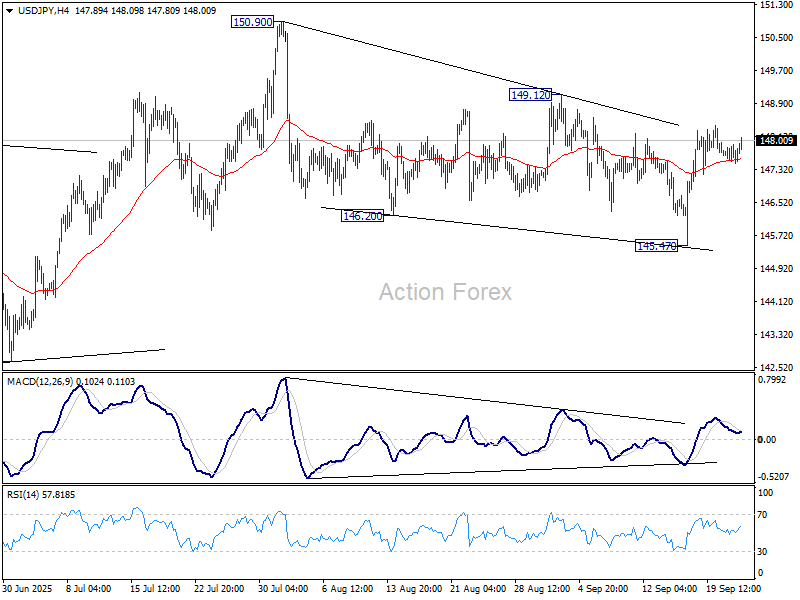
In the bigger picture, price actions from 161.94 (2024 high) are seen as a corrective pattern to rise from 102.58 (2021 low). Decisive break of 61.8% retracement of 158.86 to 139.87 at 151.22 will argue that it has already completed with three waves at 139.87. Larger up trend might then be ready to resume through 161.94 high. In case the corrective pattern extends with another fall, strong support is expected from 38.2% retracement of 102.58 to 161.94 at 139.26 to bring rebound.
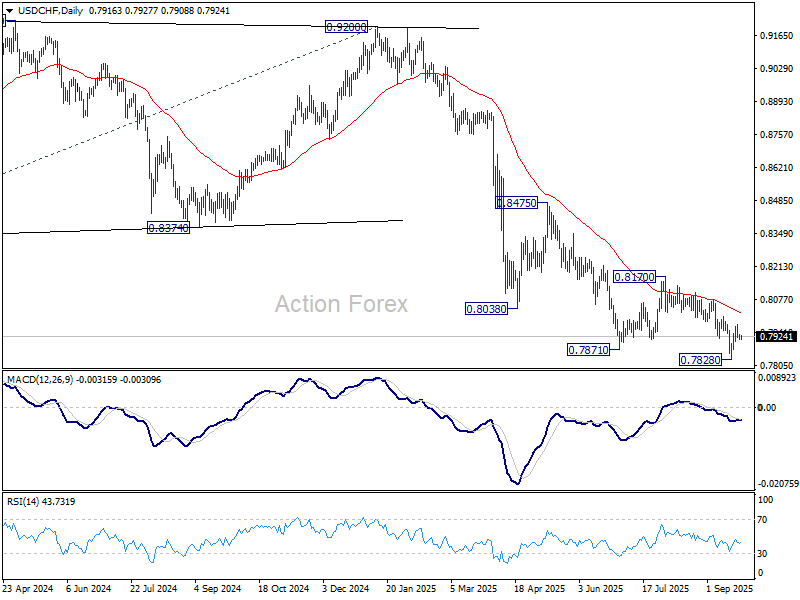
USD/CHF Daily Outlook
Daily Pivots: (S1) 0.7897; (P) 0.7925; (R1) 0.7940; More…
Intraday bias in USD/CHF stays neutral and outlook is unchanged. On the upside, above 0.7971 will resume the rebound from 0.7828 short term bottom to 0.8006 resistance. Firm break there will bring stronger rise back to 0.8170. On the downside though, below 0.7904 minor support will bring retest of 0.7828 low instead.
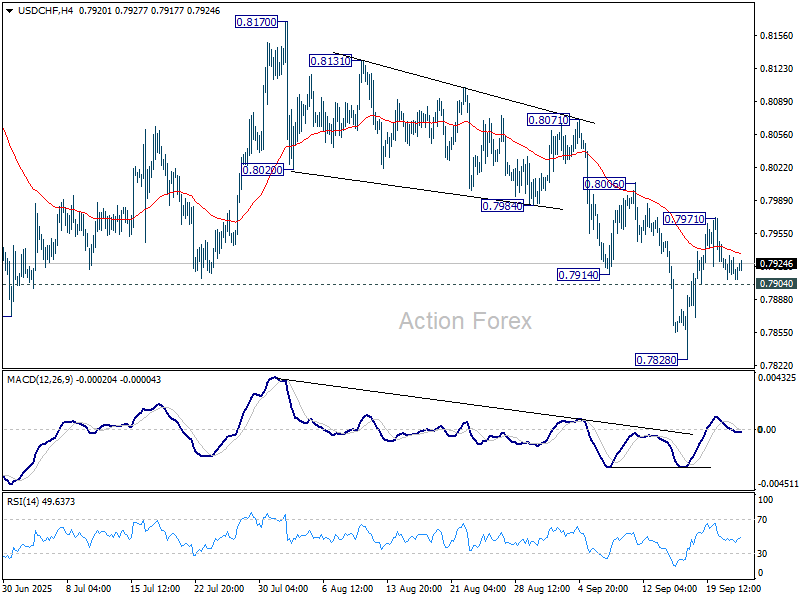
In the bigger picture, long term down trend from 1.0342 (2017 high) is still in progress. Next target is 100% projection of 1.0146 (2022 high) to 0.8332 from 0.9200 at 0.7382. In any case, outlook will stay bearish as long as 0.8332 support turned resistance holds (2023 low).
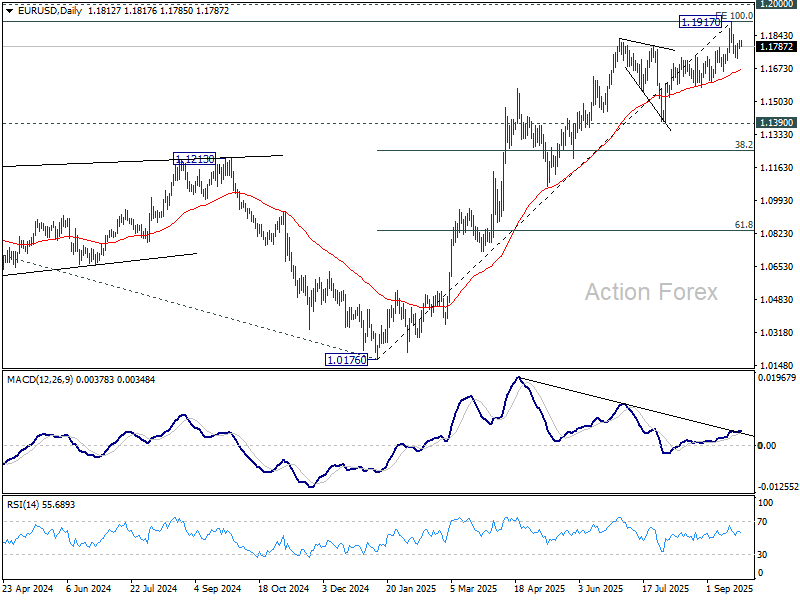
EUR/USD Daily Outlook
Daily Pivots: (S1) 1.1789; (P) 1.1805; (R1) 1.1829; More...
Intraday bias in EUR/USD remains neutral for the moment. On the downside, break of 1.1724 will resume the fall from 1.1917 to 55 D EMA (now at 1.1668). Considering bearish divergence condition in D EMA, sustained break of 55 D EMA will argue that 1.1917 is already a medium term top. Deeper fall should then be seen to 1.1390 support next. However, sustained break of 1.1917 will resume larger up trend to 1.2 psychological level.
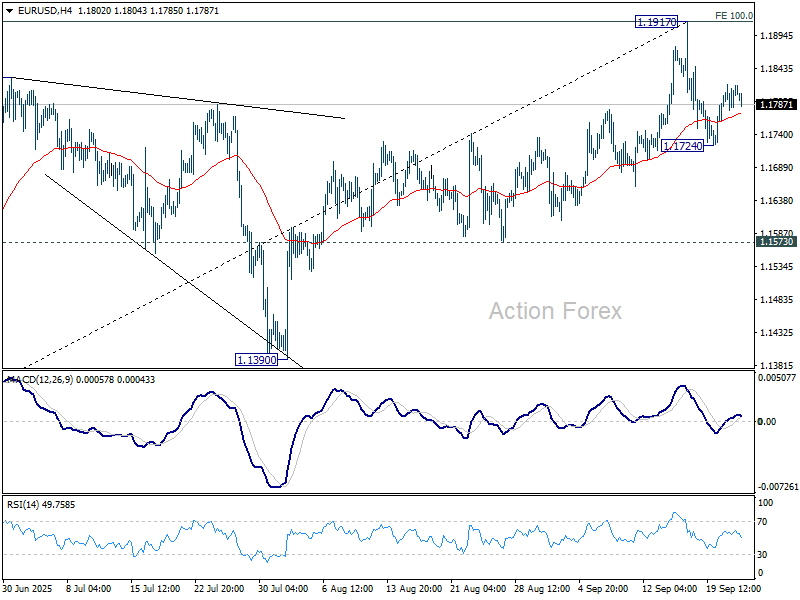
In the bigger picture, rise from 1.0176 (2025 low) is seen as the third leg of the pattern from 0.9534 (2022 low). 100% projection of 0.9534 to 1.1274 from 1.0176 at 1.1916 was already met. For now, further rally will remain in favor as long as 1.1390 support holds, and firm break of 1.2000 psychological level will carry larger bullish implications. However, firm break of 1.1390 will suggest that rise from 1.0176 has already completed and bring deeper fall to 55 W EMA (now at 1.1214).
Dollar’s Comeback Stalls Again But Doesn’t Seem Easy for Euro to Force a Topside Break
Markets
Yesterday’s European September PMIs were not bad on a headline level but details were unconvincing. More than anything else, they argue for a prolonged pause in the ECB’s normalization cycle to check how previous easing, coupled with the fiscal initiatives, will be filtering through. The market reaction was testament: no changes in German/European yields and EUR/USD holding steady just north of 1.18. US PMIs are consistent with the economy expanding at a 2.2% annualized rate in Q3 and inflation holding above 2% in the coming months, the survey taker said. But US Treasuries swapped the minor kneejerk losses for gains during Fed chair Powell’s speech, even though it was broadly a repeat of the message from last week’s FOMC policy meeting presser. US yields fell 1.7 to 4.6 bps in a bull flattening move. Other Fed policymakers hit the wires as well. Governor Bowman, for one, said the central bank risks falling behind the curve and said it’s time for the Fed to act decisively (with rate cuts). Others (eg. Bostic) are more worried about inflation. Some (from all sides of the spectrum) said they see benefit in adopting an inflation range rather than a specific target. The Fed, however, just concluded its roughly 5-year strategic review cycle and the 2% inflation target was off limits. Sterling whipsawed on PMIs that were “a litany of worrying news” and closed just shy of the intraday lows around EUR/GBP 0.874. Gilts outperformed vs USTs and Bunds and at the long end of the curve. Stocks ran a bit out of steam near the record highs in the US and near the recent ones in Europe. We’re keen to find out underlying momentum on days like today with little on the economic agenda. That goes for equities but also core bond yields and FX markets. European yields appear stuck near their current levels. Those in the US are trying to find a balance still in the wake of the unusually divisive Fed dot plot of last week. The dollar’s comeback since has stalled again but it doesn’t seem easy for the euro to force a topside break beyond the recent multiyear highs either.
News & Views
The Hungarian central bank (MNB) kept its policy rate unchanged at 6.5% yesterday. Hungarian growth was subdued in the first half of the year and a slow economic recovery is expected for the rest of the year. The MNB downwardly revised its 2025 growth forecast to 0.6% while keeping the pace for 2026 and 2027 steady at respectively 2.8% and 3.2%. Hungarian inflation is expected to stay above the central bank’s tolerance band (4%) for the rest of the year before declining persistently in it by early 2026. Compared to the June forecast, on an annual average, inflation may be slightly lower at 4.6% this year and slightly higher at 3.8% in 2026. Inflation is expected to be at 3% target in 2027. The MNB adds that price stability can be achieved in a sustainable manner by ensuring tight monetary conditions. The latter also helps in preserving financial stability. Upside inflation risks and downside growth risks prevail in coming months, but the MNB sticks with guidance that maintaining a tight policy is warranted. The Hungarian forint sticks to its best levels since mid-2024 at around EUR/HUF 390.
Japanese PMI’s showed private sector output increasing at the softest rate since May this morning. The composite PMI slowed from 52 to 51.1. Trends diverged by sector, with a further strong rise in service sector activity (53 from 53.1) contrasting with a steeper reduction in manufacturing production (48.4 from 49.7). At the composite level, overall new work increased at a slower and only marginal rate, and new export business continued to decline. Employment meanwhile expanded at the weakest rate in two years amid relatively subdued business confidence and historically strong cost pressures. Firms looked to ease pressures on their margins with a further solid increase in selling prices. The latter is a concern for the BoJ who might be in the position to raise its policy rate at the end of October to raise its policy rate from 0.5% to 0.75%