

Sample Category Title
USD/JPY Mid-Day Outlook
Daily Pivots: (S1) 147.47; (P) 147.93; (R1) 148.19; More...
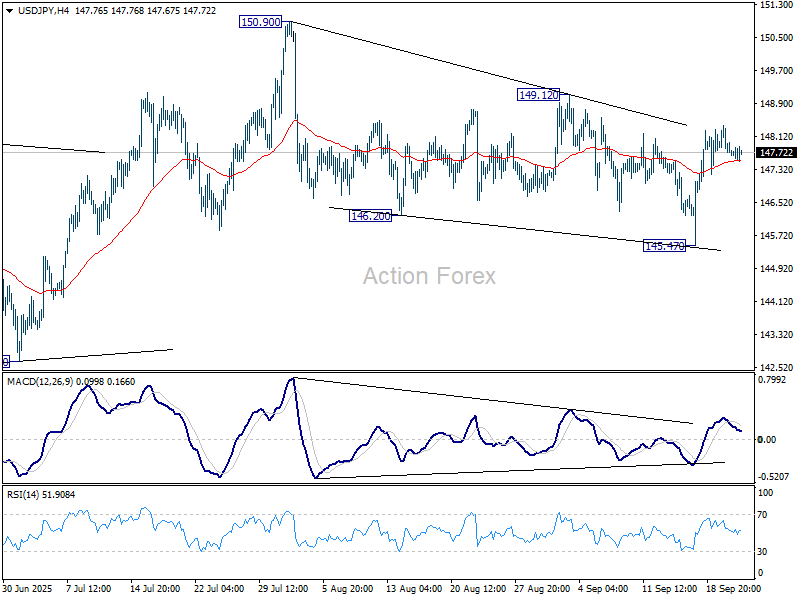
Intraday bias in USD/JPY stays neutral at this point. Current development suggests that rise from 139.87 might still be in progress. On the upside, break of 149.12 will bring stronger rally to retest 150.90 high. However, break of 145.47 will resume the fall from 150.90 instead.
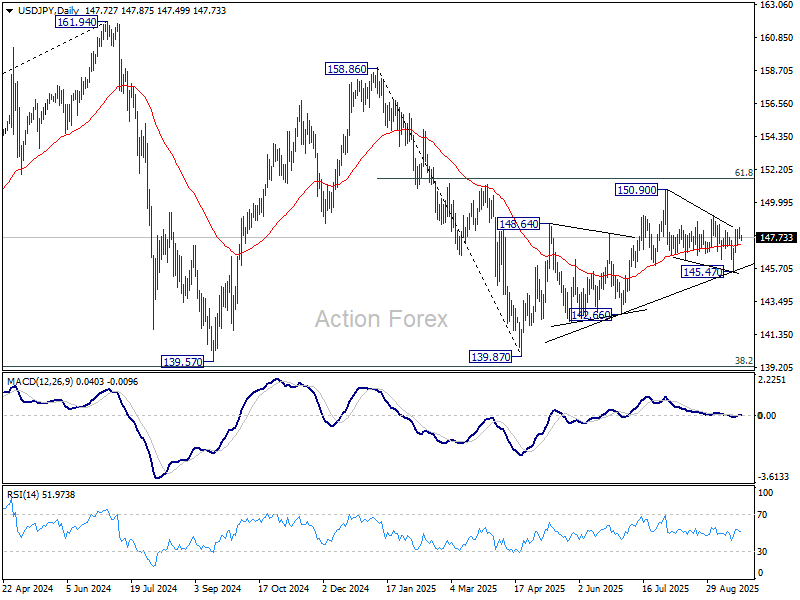
In the bigger picture, price actions from 161.94 (2024 high) are seen as a corrective pattern to rise from 102.58 (2021 low). Decisive break of 61.8% retracement of 158.86 to 139.87 at 151.22 will argue that it has already completed with three waves at 139.87. Larger up trend might then be ready to resume through 161.94 high. In case the corrective pattern extends with another fall, strong support is expected from 38.2% retracement of 102.58 to 161.94 at 139.26 to bring rebound.
EUR/USD Mid-Day Outlook
Daily Pivots: (S1) 1.1751; (P) 1.1777; (R1) 1.1829; More...
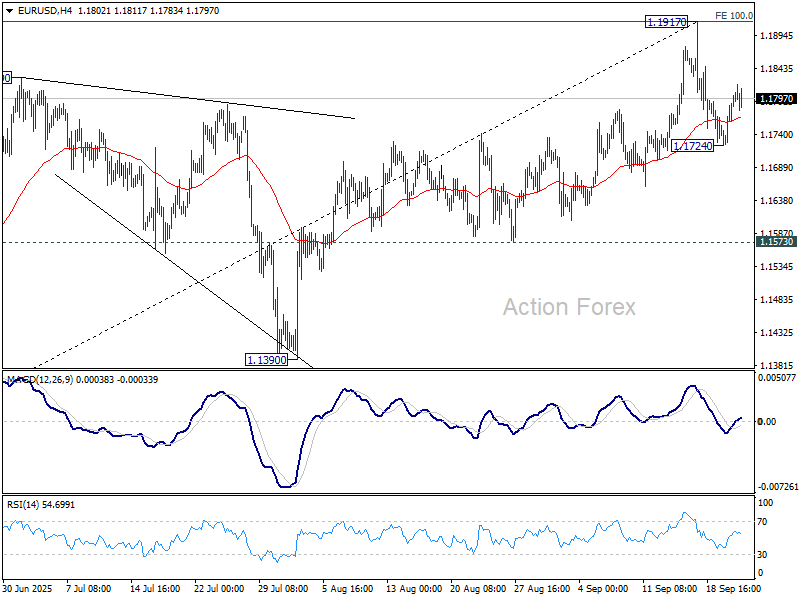
Intraday bias in EUR/USD remains neutral at this point. On the downside, break of 1.1724 will resume the fall from 1.1917 to 55 D EMA (now at 1.1663). Considering bearish divergence condition in D EMA, sustained break of 55 D EMA will argue that 1.1917 is already a medium term top. Deeper fall should then be seen to 1.1390 support next. However, sustained break of 1.1917 will resume larger up trend to 1.2 psychological level.
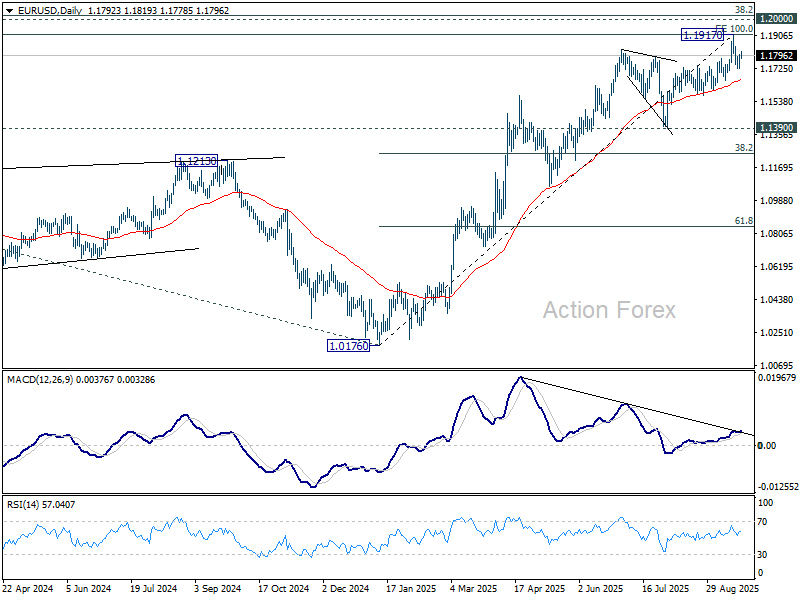
In the bigger picture, rise from 1.0176 (2025 low) is seen as the third leg of the pattern from 0.9534 (2022 low). 100% projection of 0.9534 to 1.1274 from 1.0176 at 1.1916 was already met. For now, further rally will remain in favor as long as 1.1390 support holds, and firm break of 1.2000 psychological level will carry larger bullish implications. However, firm break of 1.1390 will suggest that rise from 1.0176 has already completed and bring deeper fall to 55 W EMA (now at 1.1214).
European PMIs Shrugged Off, Focus Turns to Aussie CPI
The forex markets remained largely directionless today, with consolidative trading dominating across major pairs. Price action was muted, and the release of PMI data failed to provide much impetus, with investors largely shrugging off the surveys.
Eurozone PMIs offered a mixed picture. Germany showed a promising improvement, but sluggish readings in France offset the optimism. Overall, the bloc remains on a growth path, though easing price pressures could give the ECB room to weigh another rate cut.
That said, most ECB officials have sounded comfortable with the deposit rate at 2.00%, and the bar for an additional move appears high. With inflation steadily at target and growth still intact, policymakers may prefer to stay patient unless a sharp downturn forces their hand.
In the UK, PMI data painted a more troubling picture. Weakening growth, rising unemployment, and softer inflation pressures raise the possibility that the BoE could tilt more dovish in coming months. However, the MPC is known for its divisions, and members may interpret the same data differently, keeping the November meeting very much live.
Looking ahead to Asia, Australia’s monthly CPI is due in the next session. The index is expected to hold steady at 2.8% in August, and only a major surprise would meaningfully alter expectations. The RBA is widely expected to keep policy unchanged next week, awaiting quarterly inflation figures before reconsidering whether to cut in November. For the Aussie, sensitivity remains higher to Chinese market sentiment rather than domestic data for now.
Performance rankings show Swiss Franc leading gains this week, followed by Euro and Sterling. At the bottom, Loonie has been the weakest, trailed by Dollar and Kiwi. Aussie and Yen are sitting mid-pack. But with nearly all major pairs and crosses still contained within last week’s ranges, the FX market is marking time.
OECD upgrades 2025 growth forecast, tariff impact less severe
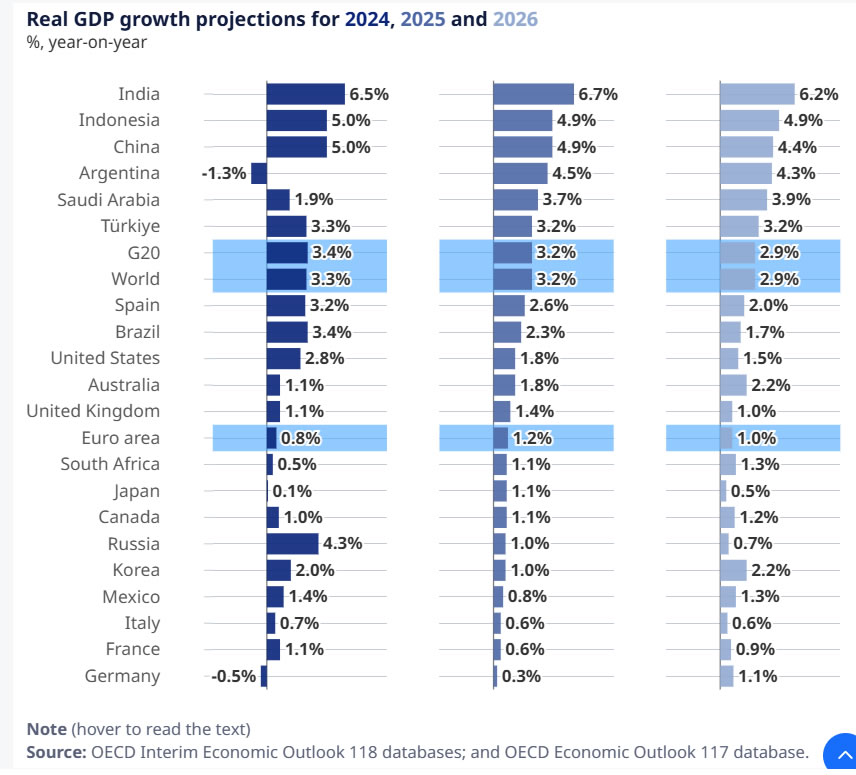
OECD’s latest Interim Economic Outlook projected global GDP growth of 3.2% in 2025, an upward revision from 2.9% in June, before easing to 2.9% in 2026. The agency said tariffs and policy uncertainty remain headwinds for trade and investment, but the upward revision shows the drag is proving smaller than previously feared.
In the U.S., GDP growth is projected to slow sharply, from 2.8% in 2024 to 1.8% in 2025 and 1.5% in 2026. The drag reflects the combined effect of tariff hikes, weaker net immigration, and a reduced federal government workforce.
China is also expected to lose momentum, easing from 4.9% in 2025 to 4.4% in 2026 as earlier stimulus fades and tariffs start to bite more fully.
In the Eurozone, growth is forecast at 1.2% in 2025 and 1.0% in 2026. The region continues to face increased trade frictions and geopolitical uncertainty, though these will be partially offset by stronger public investment programs and looser credit conditions.
On prices, the OECD expects headline G20 inflation to fall from 3.4% in 2025 to 2.9% in 2026, reflecting weaker growth and softening labor markets. Core inflation in advanced economies is forecast to decline only marginally, from 2.6% to 2.5%, suggesting underlying price stickiness remains.
The report warned that risks to disinflation persist. Goods prices have edged higher again in some economies, and services inflation remains stubborn.
BoE’s Pill more comfortable on inflation, opposed slower QT pace
BoE Chief Economist Huw Pill signaled a softer tone on inflation risks, saying in a speech he is “more comfortable now” than six to twelve months ago. While he had previously stressed the balance of risks lay more on the inflationary side, he acknowledged that as time has passed and markets have repriced, the risks are shifting.
Pill has been among the more hawkish members of the MPC, opposing last week’s decision to slow the pace of quantitative tightening. The Bank will now reduce its gilt holdings by GBP 70bn over the coming year, down from GBP100bn last year, a move Pill resisted.
He explained his preference for “continuity and consistency” in QT, arguing that the framework works best when Bank Rate is the active tool for policy adjustments. With rates far from the lower bound, the MPC has flexibility to use Bank Rate to achieve its inflation target while QT runs in the background.
UK PMI composite falls to 51, raises pressure on BoE to turn dovish
UK business activity weakened sharply in September, with the flash composite PMI dropping from 53.5 to 51.0, a 4-month low. Manufacturing fell further into contraction from 47.0 to 46.2. Services slipped from 54.2 to 51.9, pointing to a broad loss of momentum across sectors.
S&P Global’s Chris Williamson described the report as a “litany of worrying news,” citing slumping overseas trade, worsening confidence, and steep job losses. The survey signalled around 50,000 job cuts over the past three months, underscoring that the economy is “almost stalling.”
The only bright spot was softer price pressures, with firms reporting one of the smallest increases in goods and services prices since the pandemic. For the BoE, the combination of weakening growth, easing inflation, and rising unemployment may shift the debate back toward a "more dovish stance" in the months ahead.
Eurozone PMI composite at 16-month high of 51.2, Germany lifts while France drags
Eurozone flash PMIs for September showed a mixed picture, with manufacturing slipping back into contraction while services drove growth. The manufacturing index fell from 50.7 to 49.5, but services rose from 50.5 to 51.4, a 9-month high, lifting the Composite PMI from 51.0to 51.2 — its strongest in 16 months.
Hamburg Commercial Bank’s Cyrus de la Rubia said the bloc is “still on a growth path,” though far from gaining "any real momentum". Germany’s recovery stood out, with manufacturing falling from 59.8 to 48.5 but services jumping to 52.5, pushing its Composite PMI from 50.5 to 52.4 (a 16-month high). France lagged, with both manufacturing and services sliding back below 50, leaving its composite at 48.4, down from 49.8 and a 5-month low.
De la Rubia cautioned that French political uncertainty had disrupted production plans, while order books in both Germany and France showed significant declines. Hiring has now “come to a halt” across the bloc, with sluggish job creation in services and sharper losses in manufacturing. Confidence in rising output has dipped.
On the inflation side, cost pressures in services have "eased slightly" but remain unusually high, while selling prices "cooled more noticeably". That combination could give the ECB reason to consider whether a rate cut before year-end is back on the table.
Australia PMI composite hits three-month low at 52.1, confidence slumps
Australia’s private sector momentum slowed sharply in September, with PMI Composite falling from 55.5 to 52.1, its lowest in three months. Manufacturing eased from 53.0 to 51.6, while services slipped more heavily from 55.8 to 52.0, signaling a broad moderation in activity.
S&P Global’s Jingyi Pan noted that new business growth weakened after two strong months, with manufacturing orders slipping back into contraction as U.S. tariffs began to weigh. Export orders also faltered, while overall business confidence dropped to its lowest in a year, hinting at a softer growth outlook into Q4.
The survey did show resilience in employment, with job creation little changed from August. However, selling price inflation remained "at a level that was above the long-run average", and a steep rise in manufacturing cost inflation underscored margin pressures for goods producers.
EUR/USD Mid-Day Outlook
Daily Pivots: (S1) 1.1751; (P) 1.1777; (R1) 1.1829; More...
Intraday bias in EUR/USD remains neutral at this point. On the downside, break of 1.1724 will resume the fall from 1.1917 to 55 D EMA (now at 1.1663). Considering bearish divergence condition in D EMA, sustained break of 55 D EMA will argue that 1.1917 is already a medium term top. Deeper fall should then be seen to 1.1390 support next. However, sustained break of 1.1917 will resume larger up trend to 1.2 psychological level.
In the bigger picture, rise from 1.0176 (2025 low) is seen as the third leg of the pattern from 0.9534 (2022 low). 100% projection of 0.9534 to 1.1274 from 1.0176 at 1.1916 was already met. For now, further rally will remain in favor as long as 1.1390 support holds, and firm break of 1.2000 psychological level will carry larger bullish implications. However, firm break of 1.1390 will suggest that rise from 1.0176 has already completed and bring deeper fall to 55 W EMA (now at 1.1214).
OECD upgrades 2025 growth forecast, tariff impact less severe
OECD’s latest Interim Economic Outlook projected global GDP growth of 3.2% in 2025, an upward revision from 2.9% in June, before easing to 2.9% in 2026. The agency said tariffs and policy uncertainty remain headwinds for trade and investment, but the upward revision shows the drag is proving smaller than previously feared.
In the U.S., GDP growth is projected to slow sharply, from 2.8% in 2024 to 1.8% in 2025 and 1.5% in 2026. The drag reflects the combined effect of tariff hikes, weaker net immigration, and a reduced federal government workforce.
China is also expected to lose momentum, easing from 4.9% in 2025 to 4.4% in 2026 as earlier stimulus fades and tariffs start to bite more fully.
In the Eurozone, growth is forecast at 1.2% in 2025 and 1.0% in 2026. The region continues to face increased trade frictions and geopolitical uncertainty, though these will be partially offset by stronger public investment programs and looser credit conditions.
On prices, the OECD expects headline G20 inflation to fall from 3.4% in 2025 to 2.9% in 2026, reflecting weaker growth and softening labor markets. Core inflation in advanced economies is forecast to decline only marginally, from 2.6% to 2.5%, suggesting underlying price stickiness remains.
The report warned that risks to disinflation persist. Goods prices have edged higher again in some economies, and services inflation remains stubborn.
BoE’s Pill more comfortable on inflation, opposed slower QT pace
BoE Chief Economist Huw Pill signaled a softer tone on inflation risks, saying in a speech he is “more comfortable now” than six to twelve months ago. While he had previously stressed the balance of risks lay more on the inflationary side, he acknowledged that as time has passed and markets have repriced, the risks are shifting.
Pill has been among the more hawkish members of the MPC, opposing last week’s decision to slow the pace of quantitative tightening. The Bank will now reduce its gilt holdings by GBP 70bn over the coming year, down from GBP100bn last year, a move Pill resisted.
He explained his preference for “continuity and consistency” in QT, arguing that the framework works best when Bank Rate is the active tool for policy adjustments. With rates far from the lower bound, the MPC has flexibility to use Bank Rate to achieve its inflation target while QT runs in the background.
EUR/USD Extends Gains as US Dollar Weakens on Fed Uncertainty and Shutdown Fears
The EUR/USD pair advanced to 1.1804 on Tuesday, marking a second consecutive day of gains. The US dollar faced sustained pressure as markets digested mixed signals from Federal Reserve officials regarding the interest rate outlook.
Several Fed members advocated for caution on further easing, pointing to signs of stabilising inflation. However, this stance was countered by new Governing Council member Stephen Miran, who warned that the central bank may be underestimating current policy tightness and risks damaging the labour market without more decisive rate cuts.
Investors are now focused on the upcoming release of the PCE price index on Friday – the Fed's preferred inflation gauge – which is expected to provide critical guidance for future monetary policy.
Adding to the market's unease are the ongoing US congressional budget negotiations. Lawmakers are working to avert a potential government shutdown by the 30 September deadline, creating a fresh layer of uncertainty.
Technical Analysis: EUR/USD
H4 Chart:
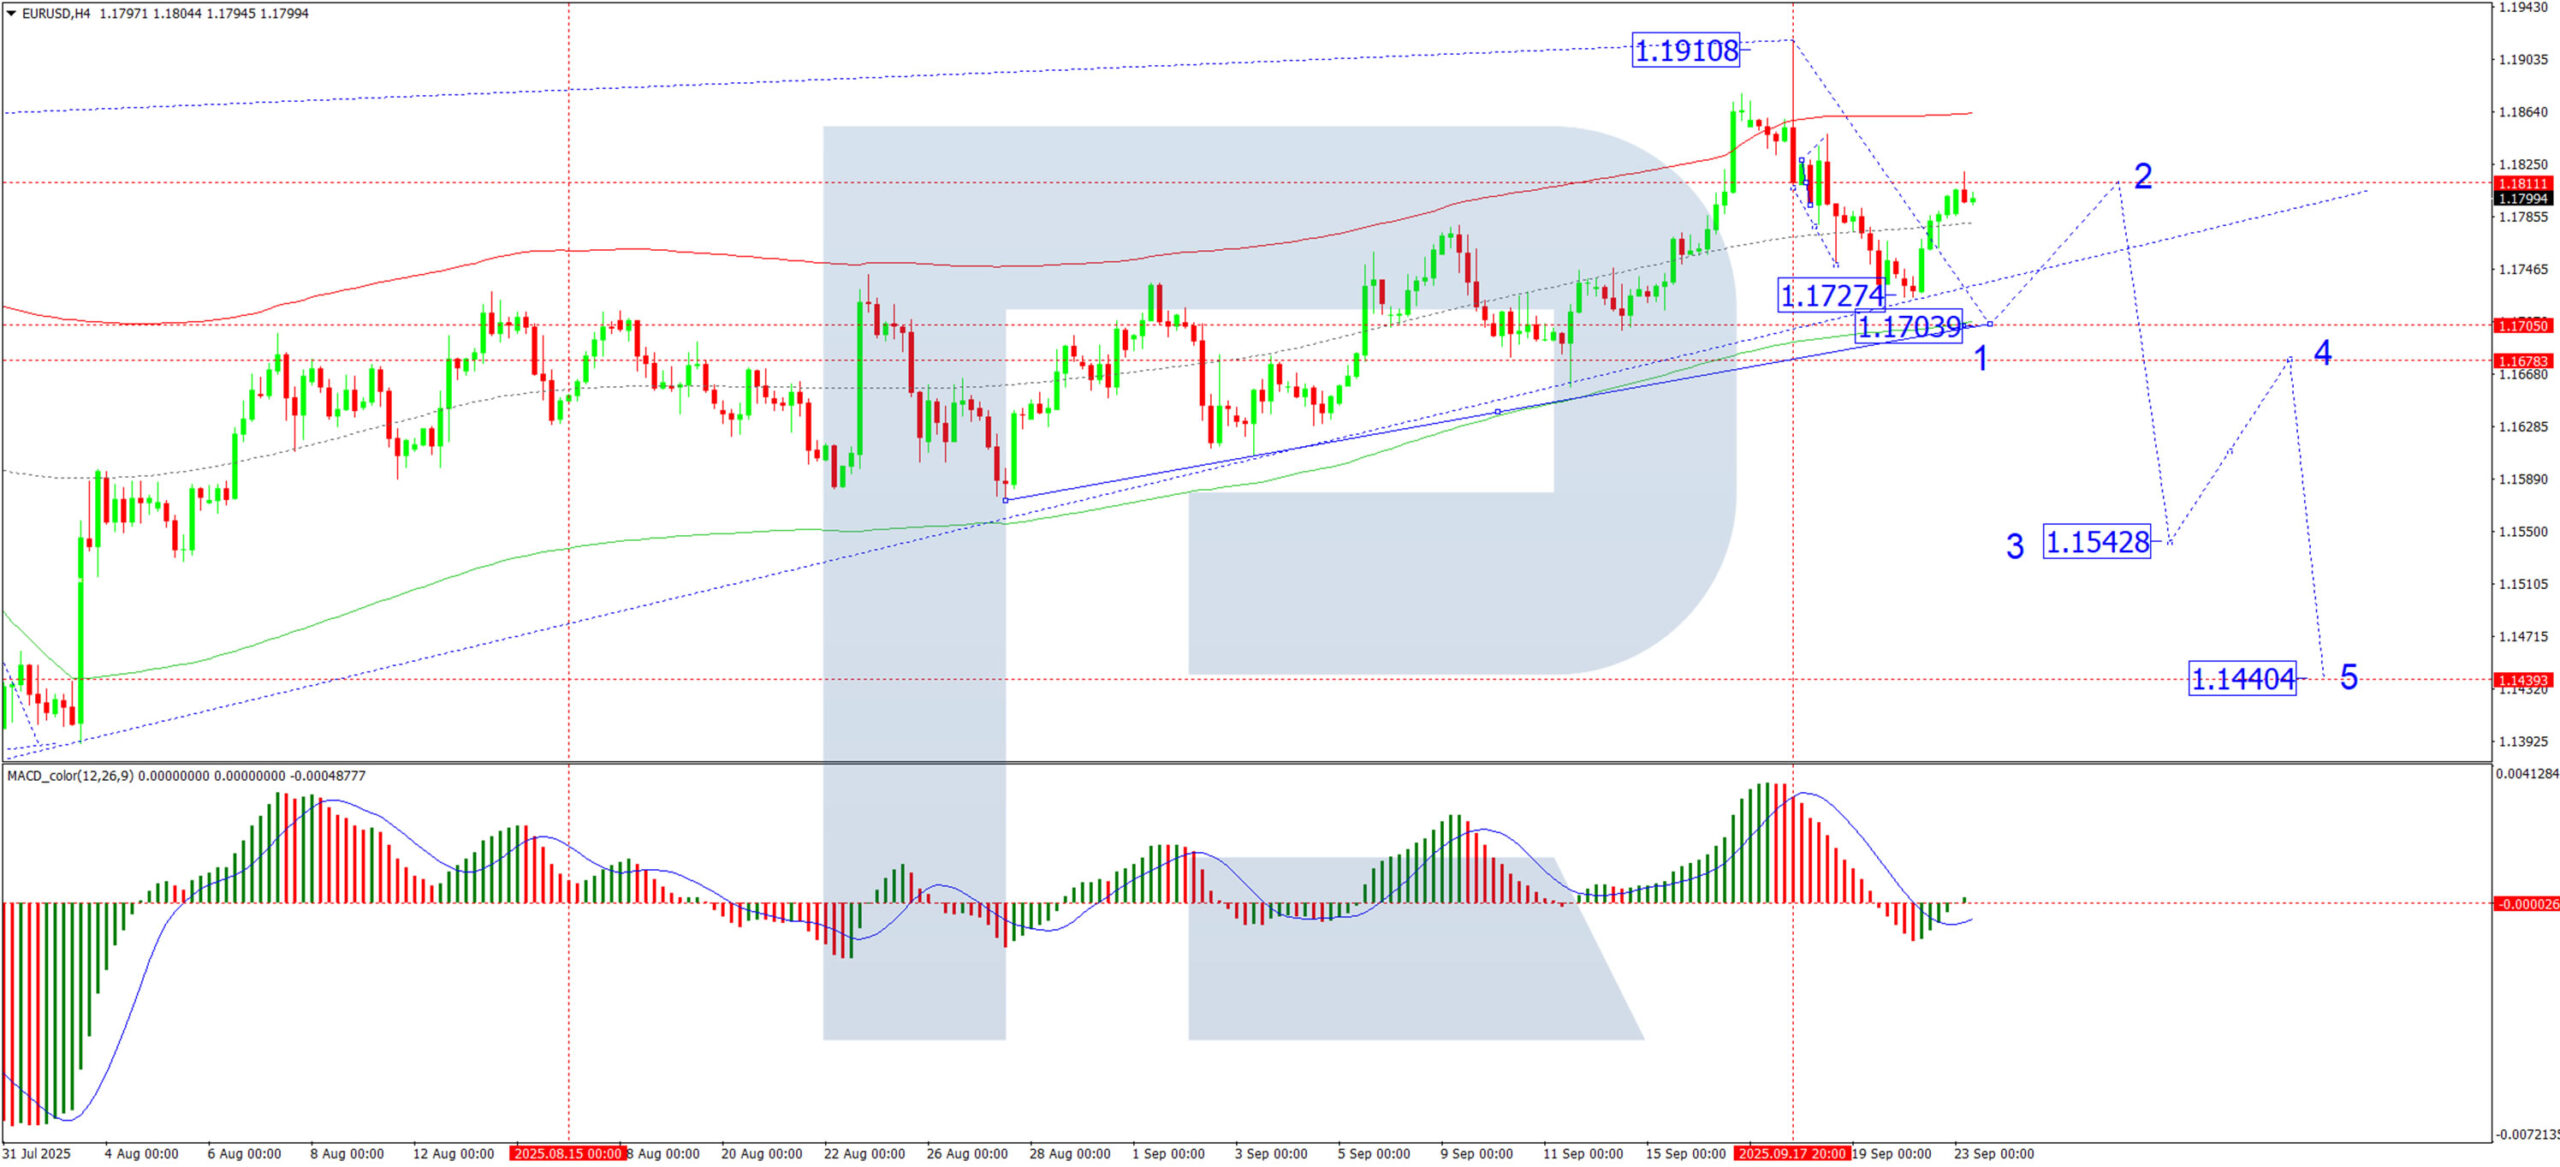
On the H4 chart, EUR/USD completed a decline to 1.1727, followed by a correction to 1.1818. The current expectation is for a resumption of the downward move towards an initial target of 1.1704. Upon reaching this level, a subsequent rebound towards 1.1800 is anticipated. This bearish scenario is technically supported by the MACD indicator, whose signal line is around the zero line and pointing decisively downwards.
H1 Chart:
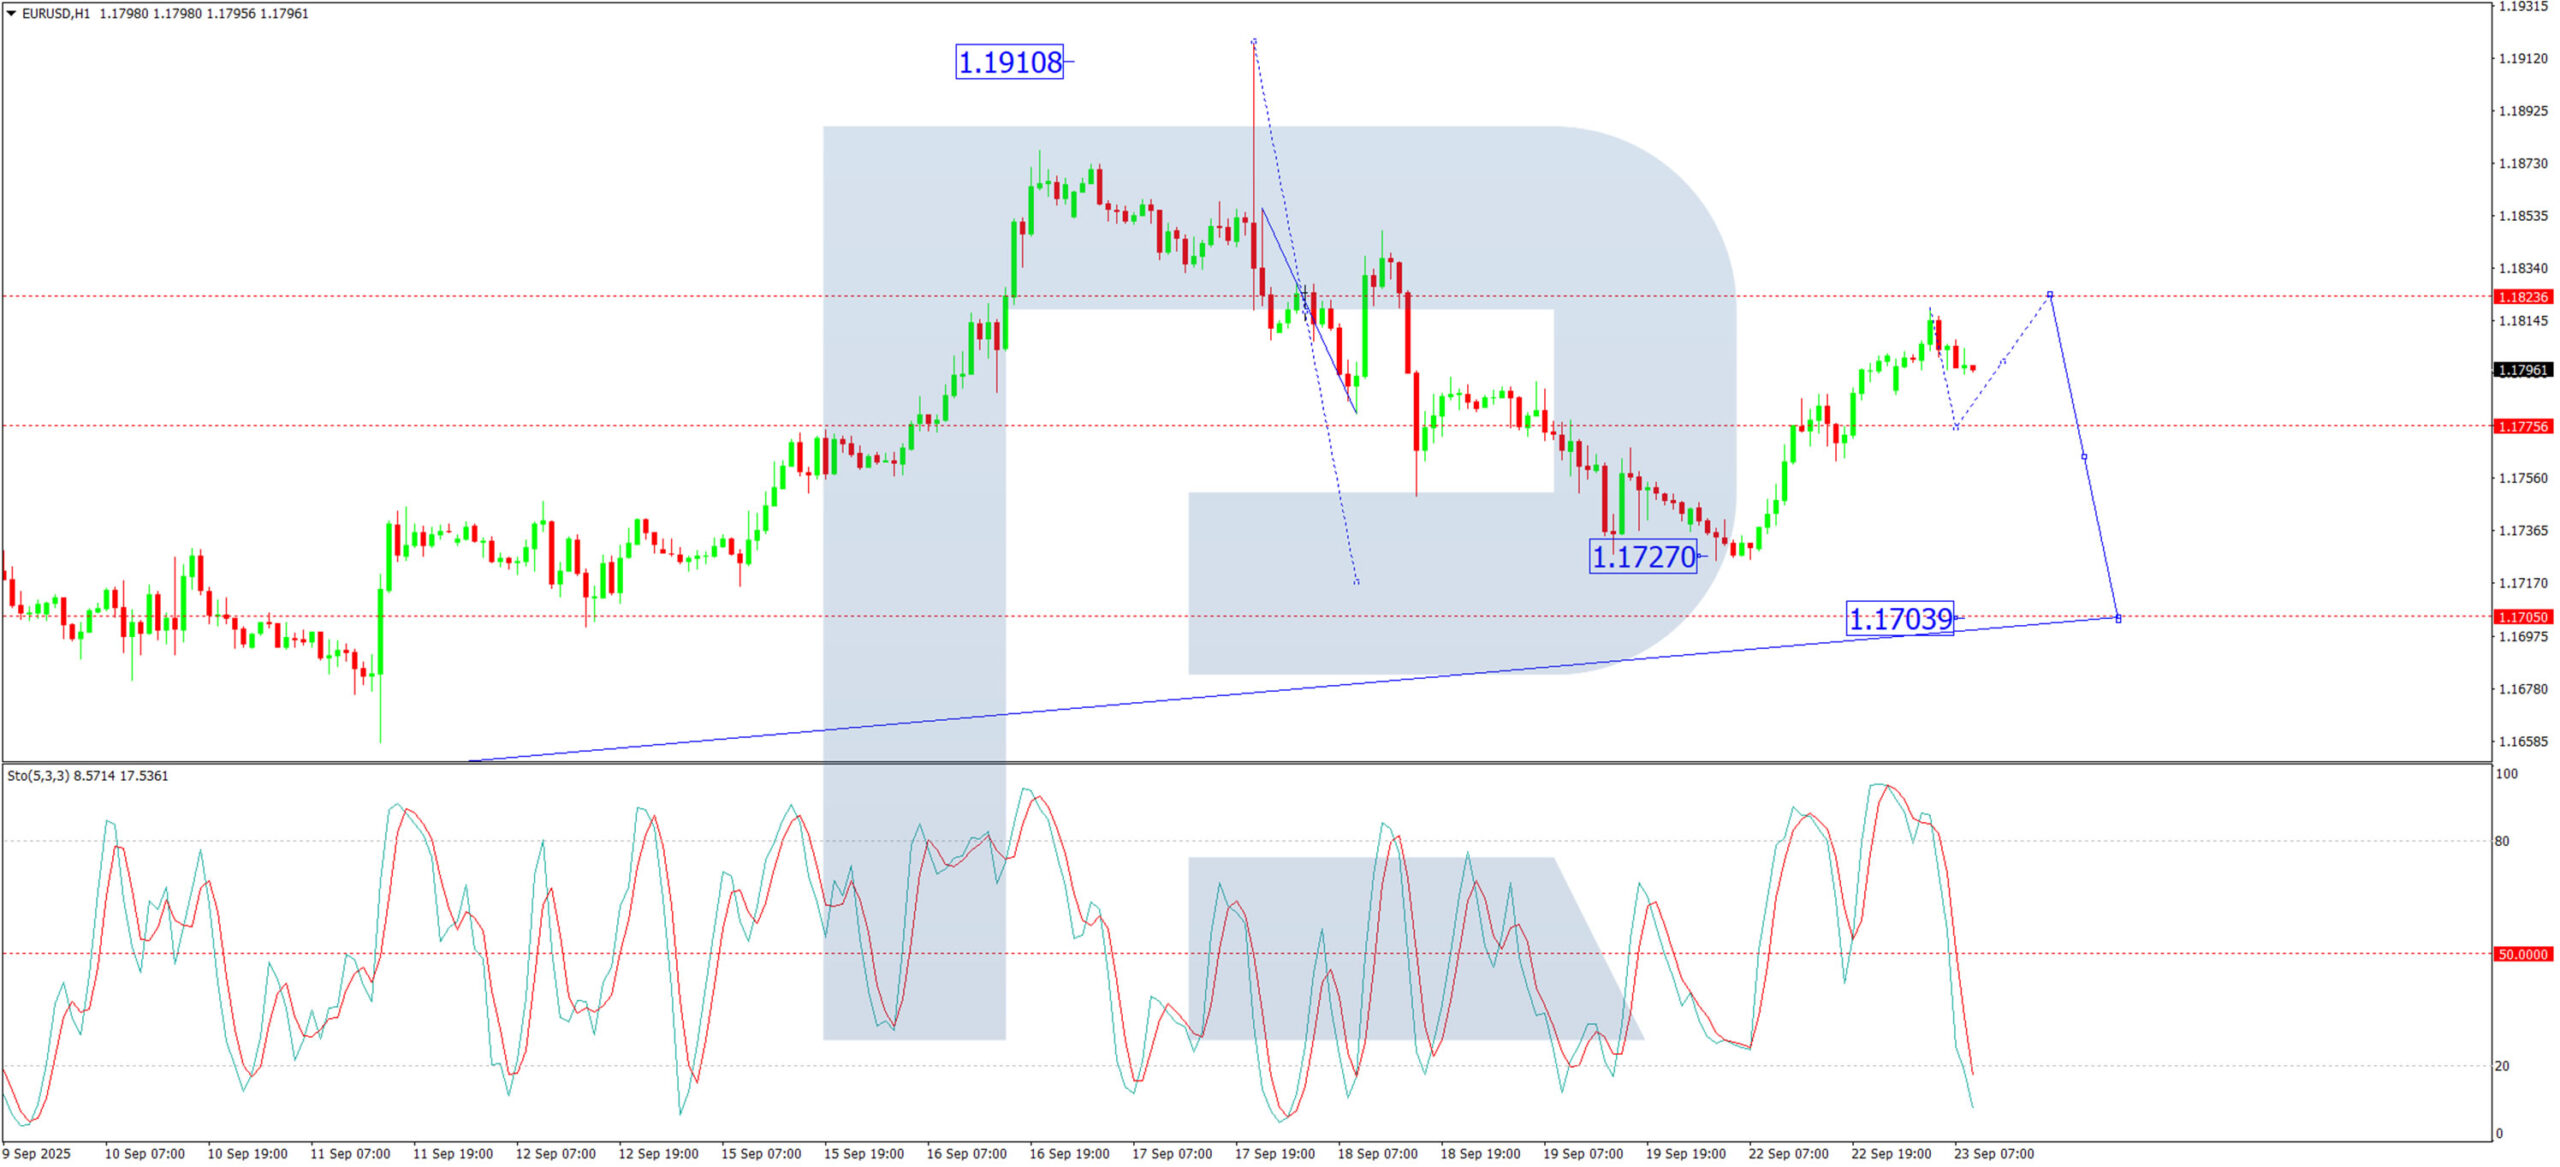
The H1 chart shows the pair completed its descent to 1.1727 and is now forming a corrective structure. Today's price action has created an upward move towards 1.1818. From here, we expect a decline to 1.1777. A further rise to 1.1824 could then unfold, completing the corrective phase and setting the stage for a new downward wave targeting 1.1704. This outlook is confirmed by the Stochastic oscillator, with its signal line currently below 50 and falling sharply towards 20.
Conclusion
While the euro is capitalising on a weaker dollar driven by divergent Fed commentary and political risks, the technical structure suggests the upside may be limited. The broader trend appears poised for a resumption of declines, contingent on the key PCE data and developments in Washington.
EUR/USD Preserves Upleg Above SMAs
- EUR/USD finds familiar support after pullback from 4-year high.
- A break above 1.1800 could trigger the next bullish cycle.
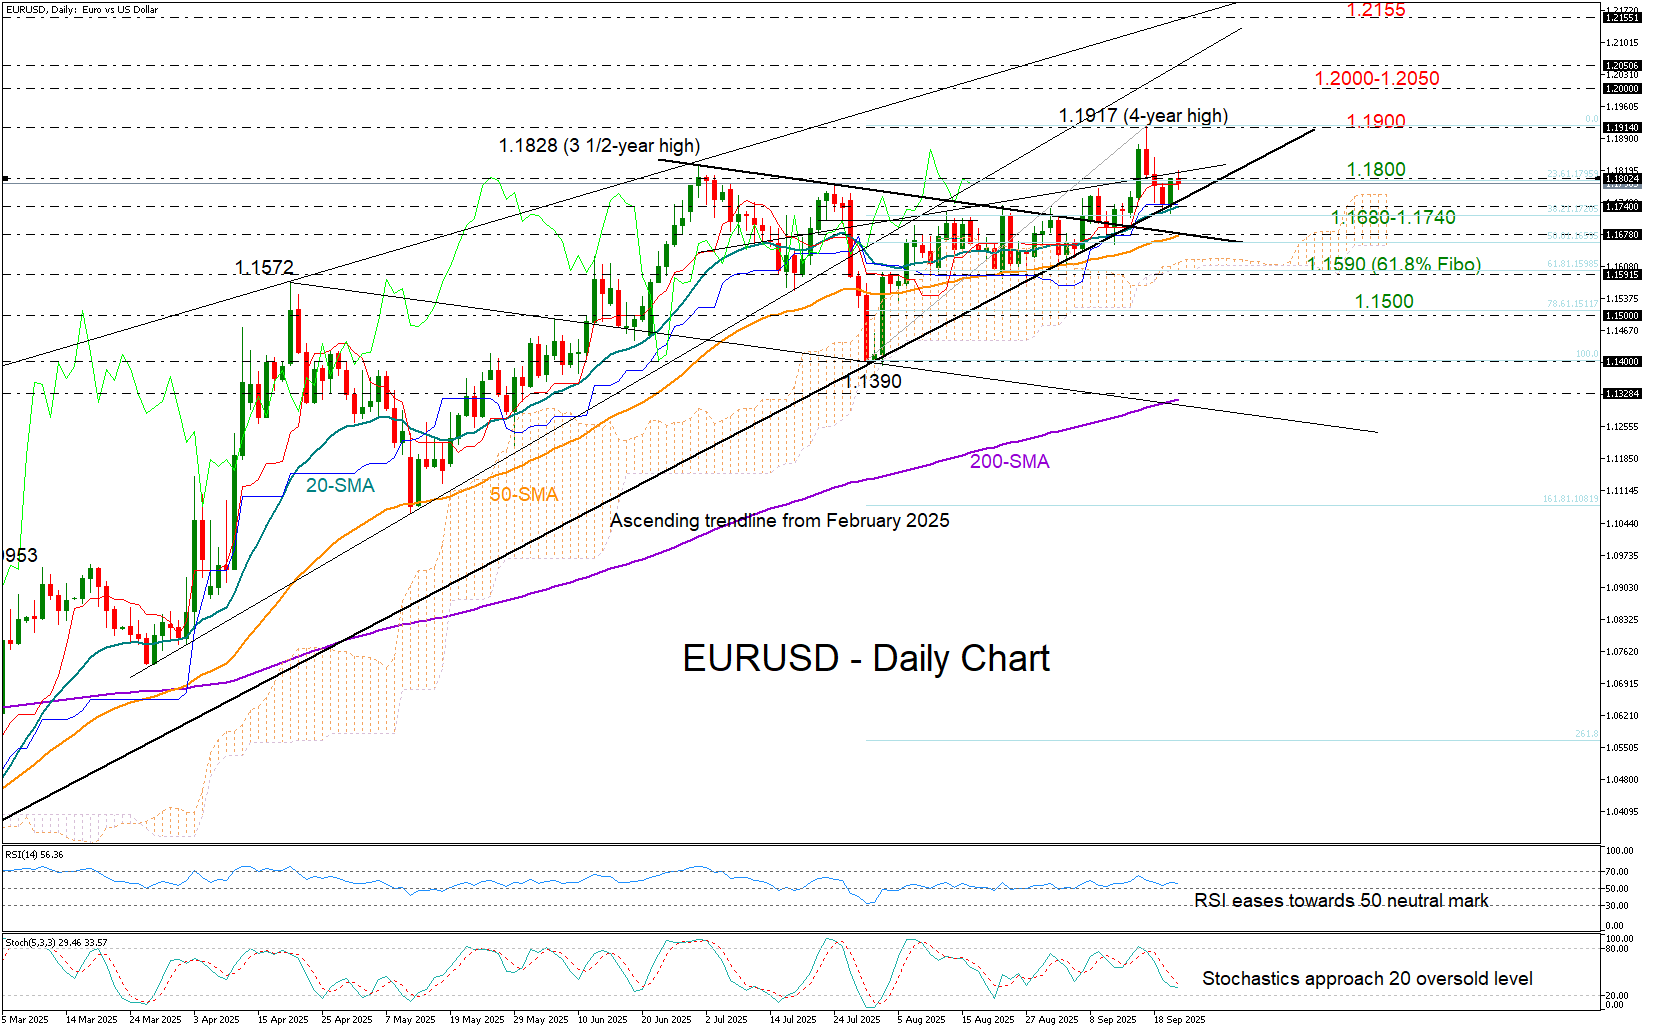
EUR/USD continues to defend its July–September upleg. Despite its pullback from a four-year high of 1.1917, the bulls managed to secure strong foothold around the 20-day simple moving average (SMA) at 1.1735 on Monday. Recall that the pair has been fluctuating above its short-term SMAs for nearly two months. Therefore, yesterday’s pivot boosted optimism that the bulls are still in town.
With the Fed preparing a more accommodative monetary policy and the ECB pausing its rate-cut cycle, the euro still carries an advantage, although upcoming data releases could alter policy guidance. German flash business PMI figures for September were mixed earlier today: the services sector showed further expansion to 52.5, while the manufacturing PMI slipped back into contraction below 50.
From a technical perspective, traders may prefer to remain on the sidelines unless the price reclaims the 1.1800 level. If that happens, the 1.1900 area could act as immediate resistance, and a decisive break above it could open the way toward the 1.2000–1.2050 region. Beyond that, the next barrier may emerge around 1.2150.
On the downside, if the pair falls below its short-term SMAs and the 2025 support trendline, currently located in the 1.1680–1.1740 zone, the bears could push the price toward the 1.1590 region. The 61.8% Fibonacci retracement level of the latest upleg may reinforce that floor. Otherwise, a deeper sell-off could extend toward the 1.1500 area.
In summary, EURUSD appears neutral in the short-term outlook. After its pullback from a four-year high, the bulls need to reclaim the 1.1800 area to revive momentum for a continuation higher.
Euro Area Business Activity Above Expected, But Too Modest for Euro to Break Through
Preliminary PMI estimates for the entire eurozone exceeded expectations, but this did not help the single currency grow. On Tuesday, the rise to 1.18 was actively sold off.
French businesses reacted negatively to the political turmoil caused by budget disputes, which also affected tariffs. Both the service sector and manufacturing performed below expectations and showed a deepening decline. The composite index fell to 48.4, its lowest level since April.
The main positive surprise came from the German services sector, where the index jumped from 49.3 to 52.8 against the expected 49.5. This is the highest the index has been since May 2024. These figures signal a return to service growth, while market participants had expected the downturn to continue, with values below 50.
However, Germany’s manufacturing sector contributes much more than in the UK or the US, so the unexpectedly sharp drop in the manufacturing PMI from 48.8 to 48.5, against an expected rise to 50.1, is dampening optimism.
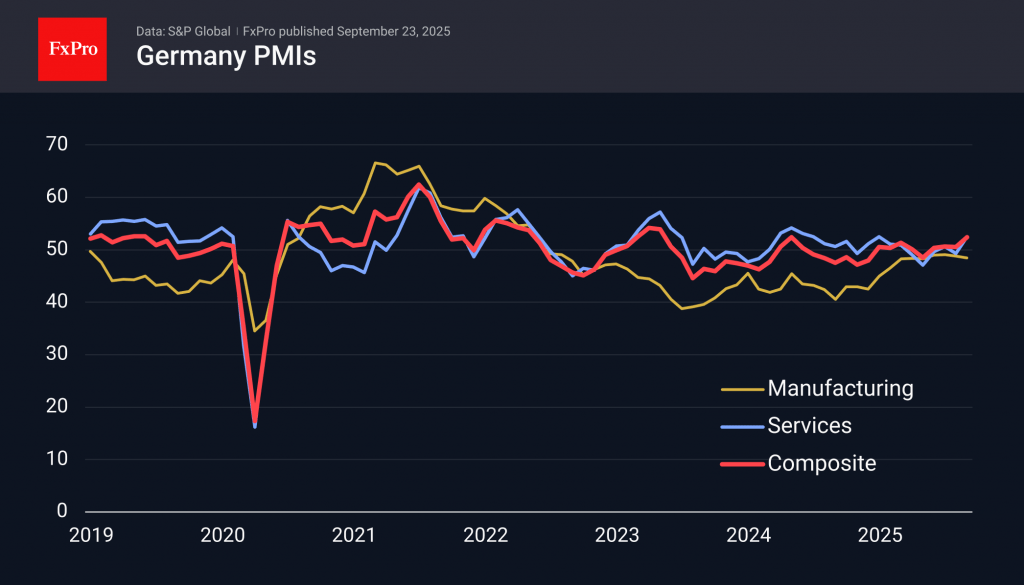
Germany pulled up the service sector figures for the entire eurozone, ensuring that the index rose to its highest level since December. The composite index reached 51.2, its highest level since May last year.
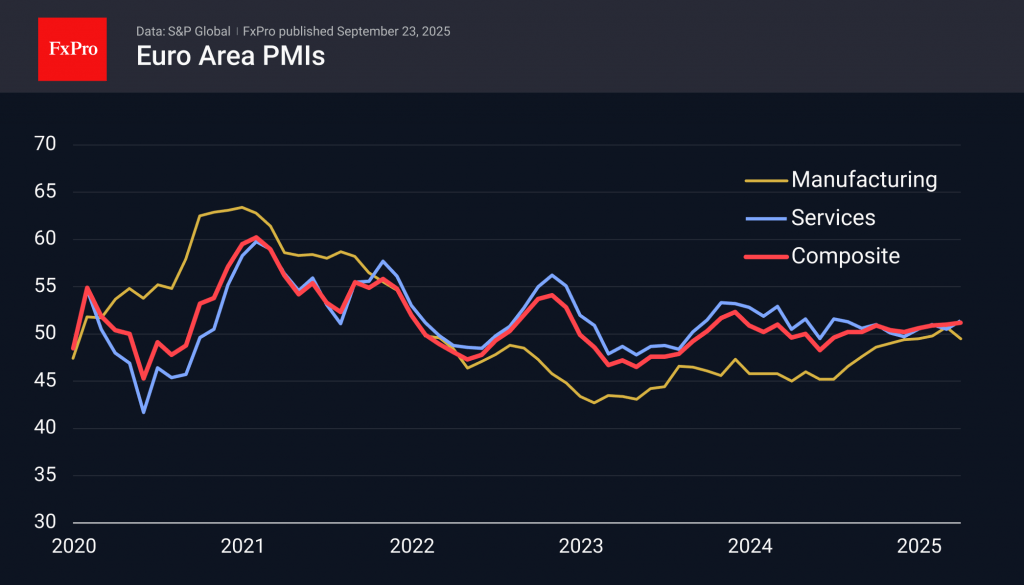
Higher-than-expected figures for the eurozone are allowing the euro to remain at a relatively high level of $1.1800 and are pushing EURGBP to the upper limit of its range for almost two years. However, these improvements are too modest to become the basis for a breakthrough of important resistance levels, which the euro has been unable to overcome for the past two months.
What Aggressive Growth of Gold Indicates
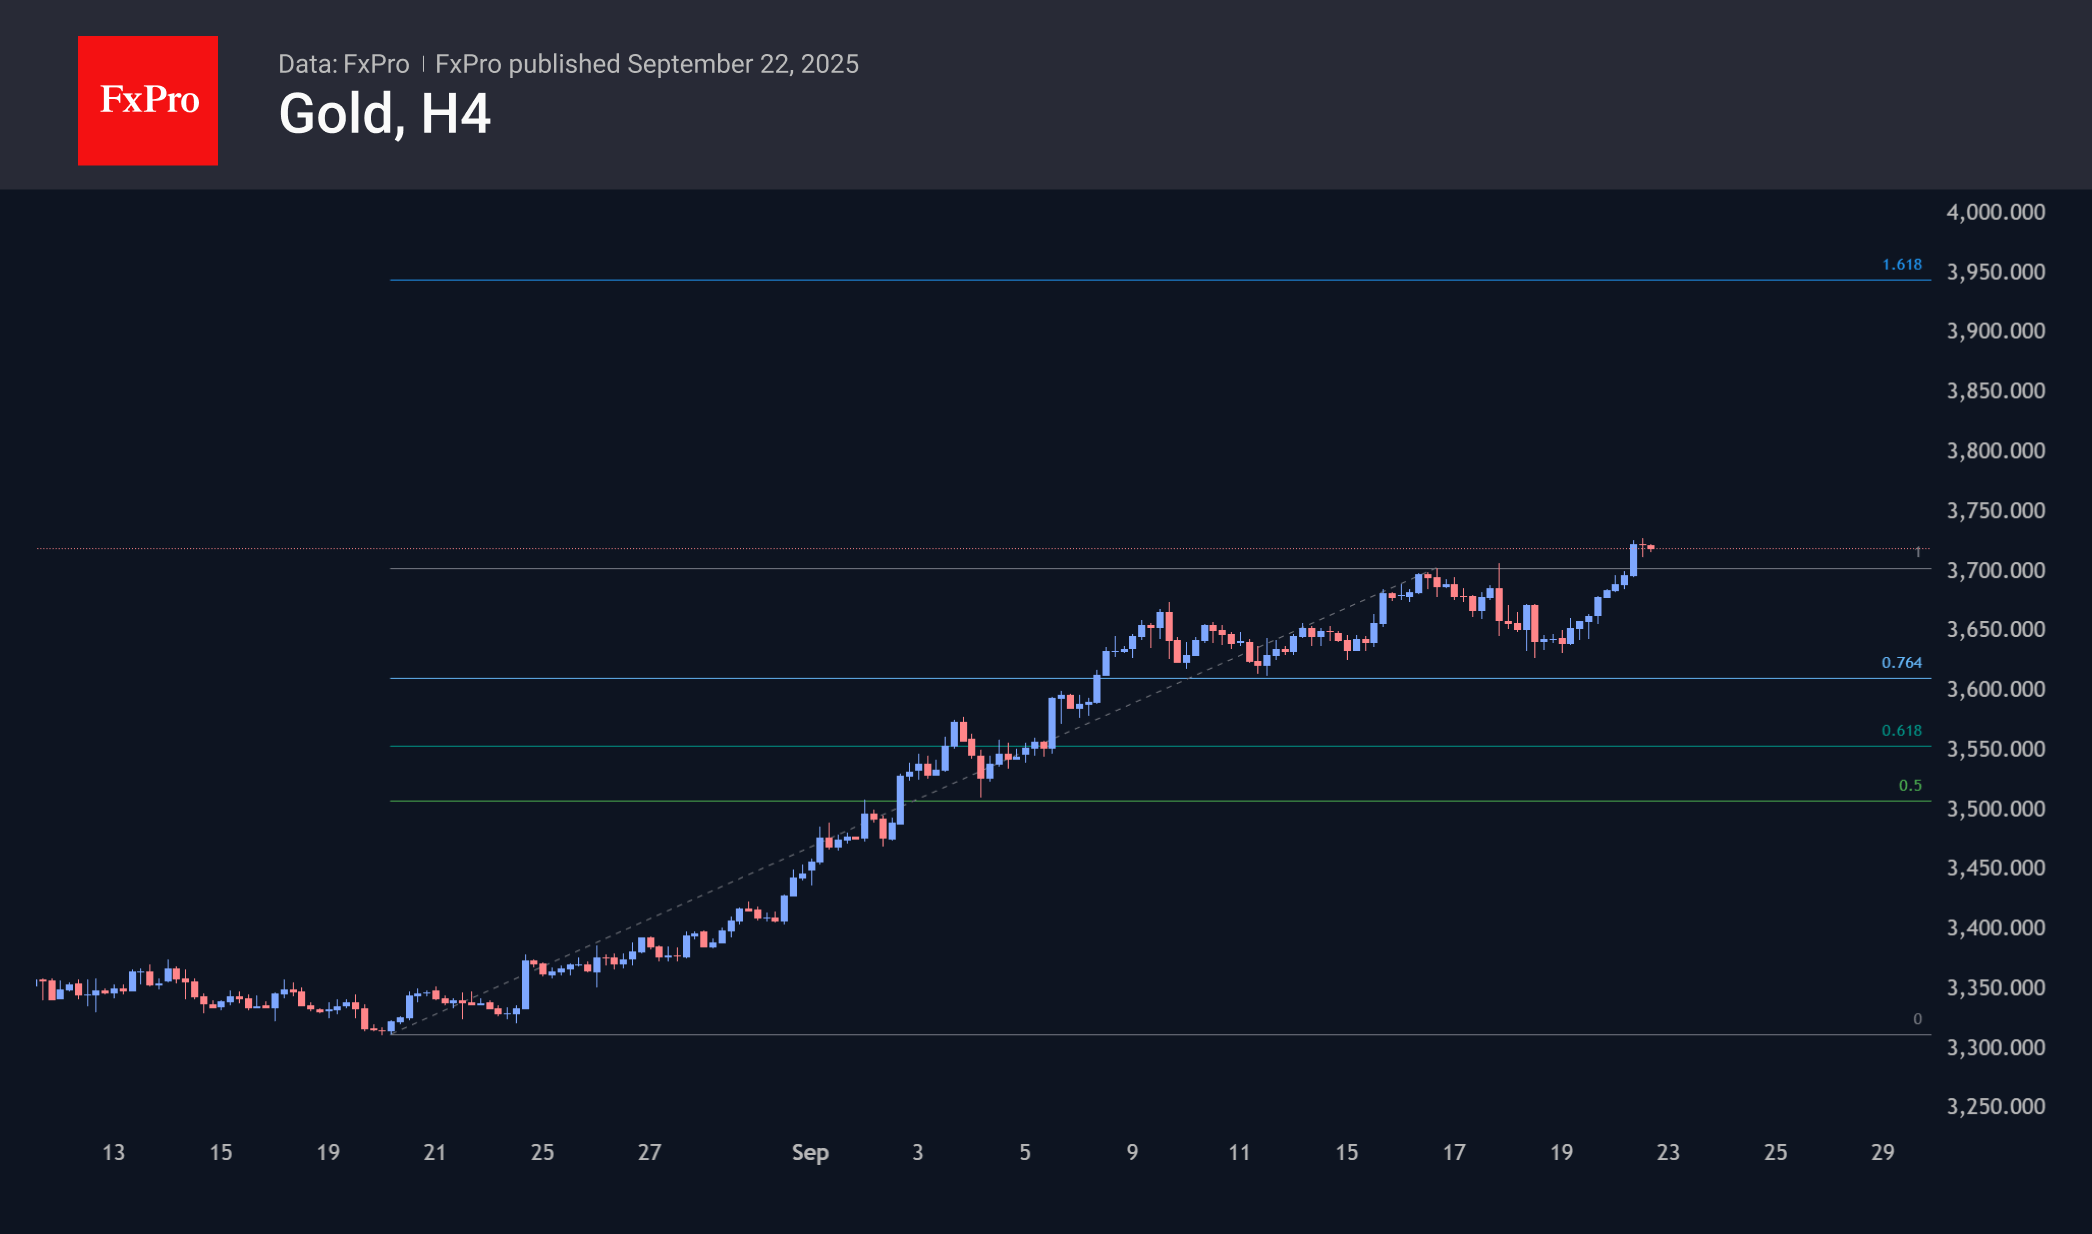
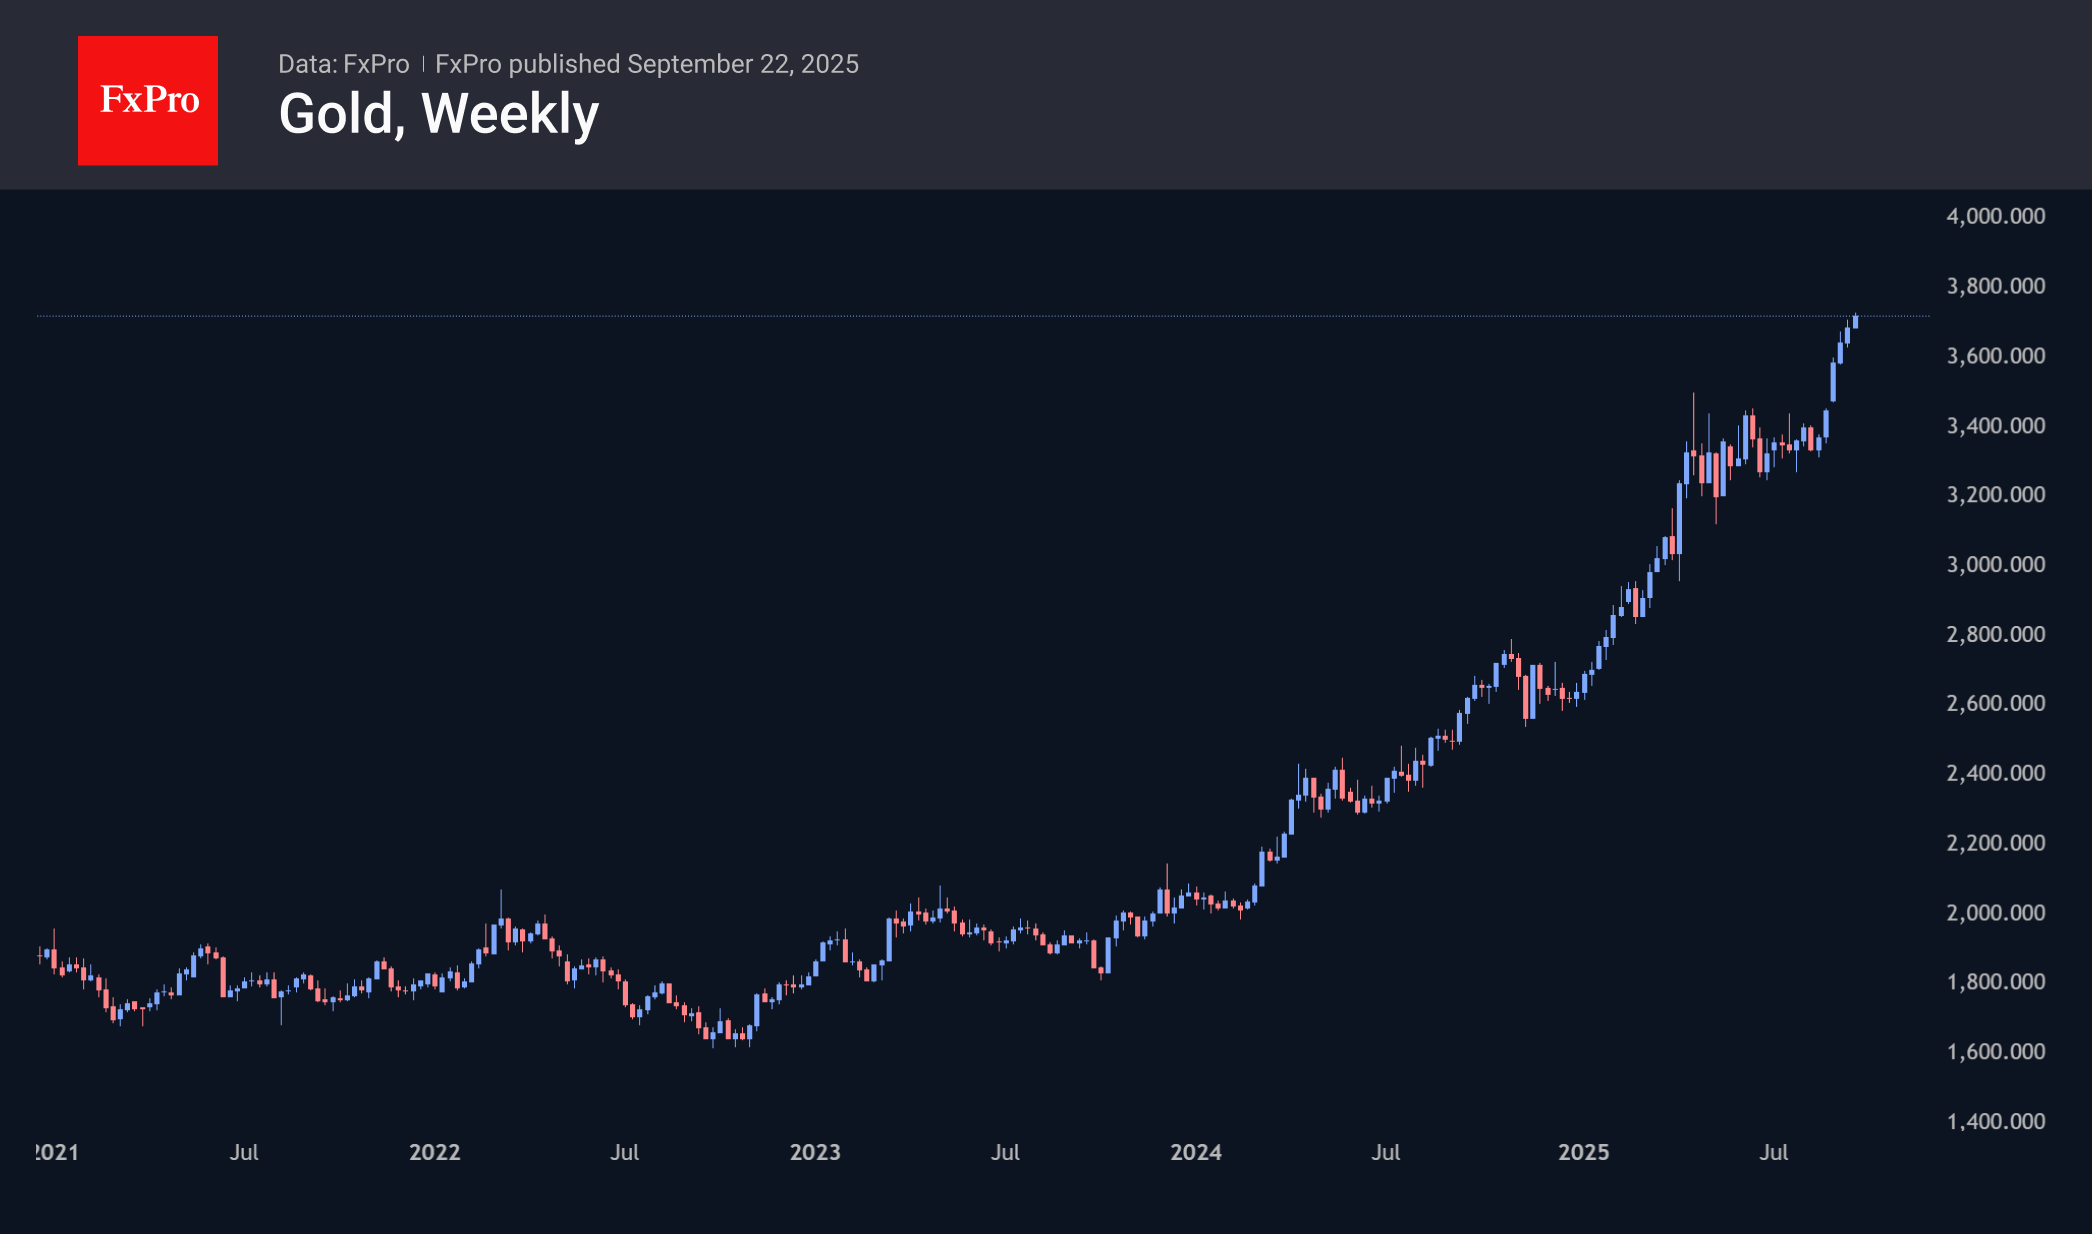
Gold is once again benefiting from a combination of geopolitical tensions, demand for safe-haven assets, and reduced risk appetite in the stock and cryptocurrency markets. The price per ounce returned to its historic highs, reaching $3,750 on the spot market and adding 3% from the start of the day on Friday to the start of active trading in Europe on Tuesday.
The previous historic high was set on 17 September, followed by two days of profit-taking. However, the wave of decline was not long-lasting, and gold corrected by less than 20% from its last rally on 20 August. This indicates a strong appetite for gold, despite the price highs and an almost unprecedented rate of growth since the beginning of the year. From a technical point of view, the expansion of this pattern indicates the potential for the price to rise to $4,000.
Politics is once again working in favour of gold bugs. The tightening of work visa rules is likely to cause discontent in India. Modi’s statements about the need to make the country independent of foreign markets are undermining hopes for a trade settlement.
The latest discussion of a government shutdown also supports gold purchases.
The Fed’s softening of its monetary policy stance is providing additional long-term confidence to buyers. Although this reassessment of market prospects has paused in recent days, it appears to be a pause rather than a reversal, as it would take a strong improvement in labour market indicators and a surge in inflation to change this trend.
Gold is being pushed in the same direction by expectations that global central banks will continue to accumulate gold reserves at the expense of the dollar’s share in them, as alternative currencies do not look much better in terms of fundamentals.
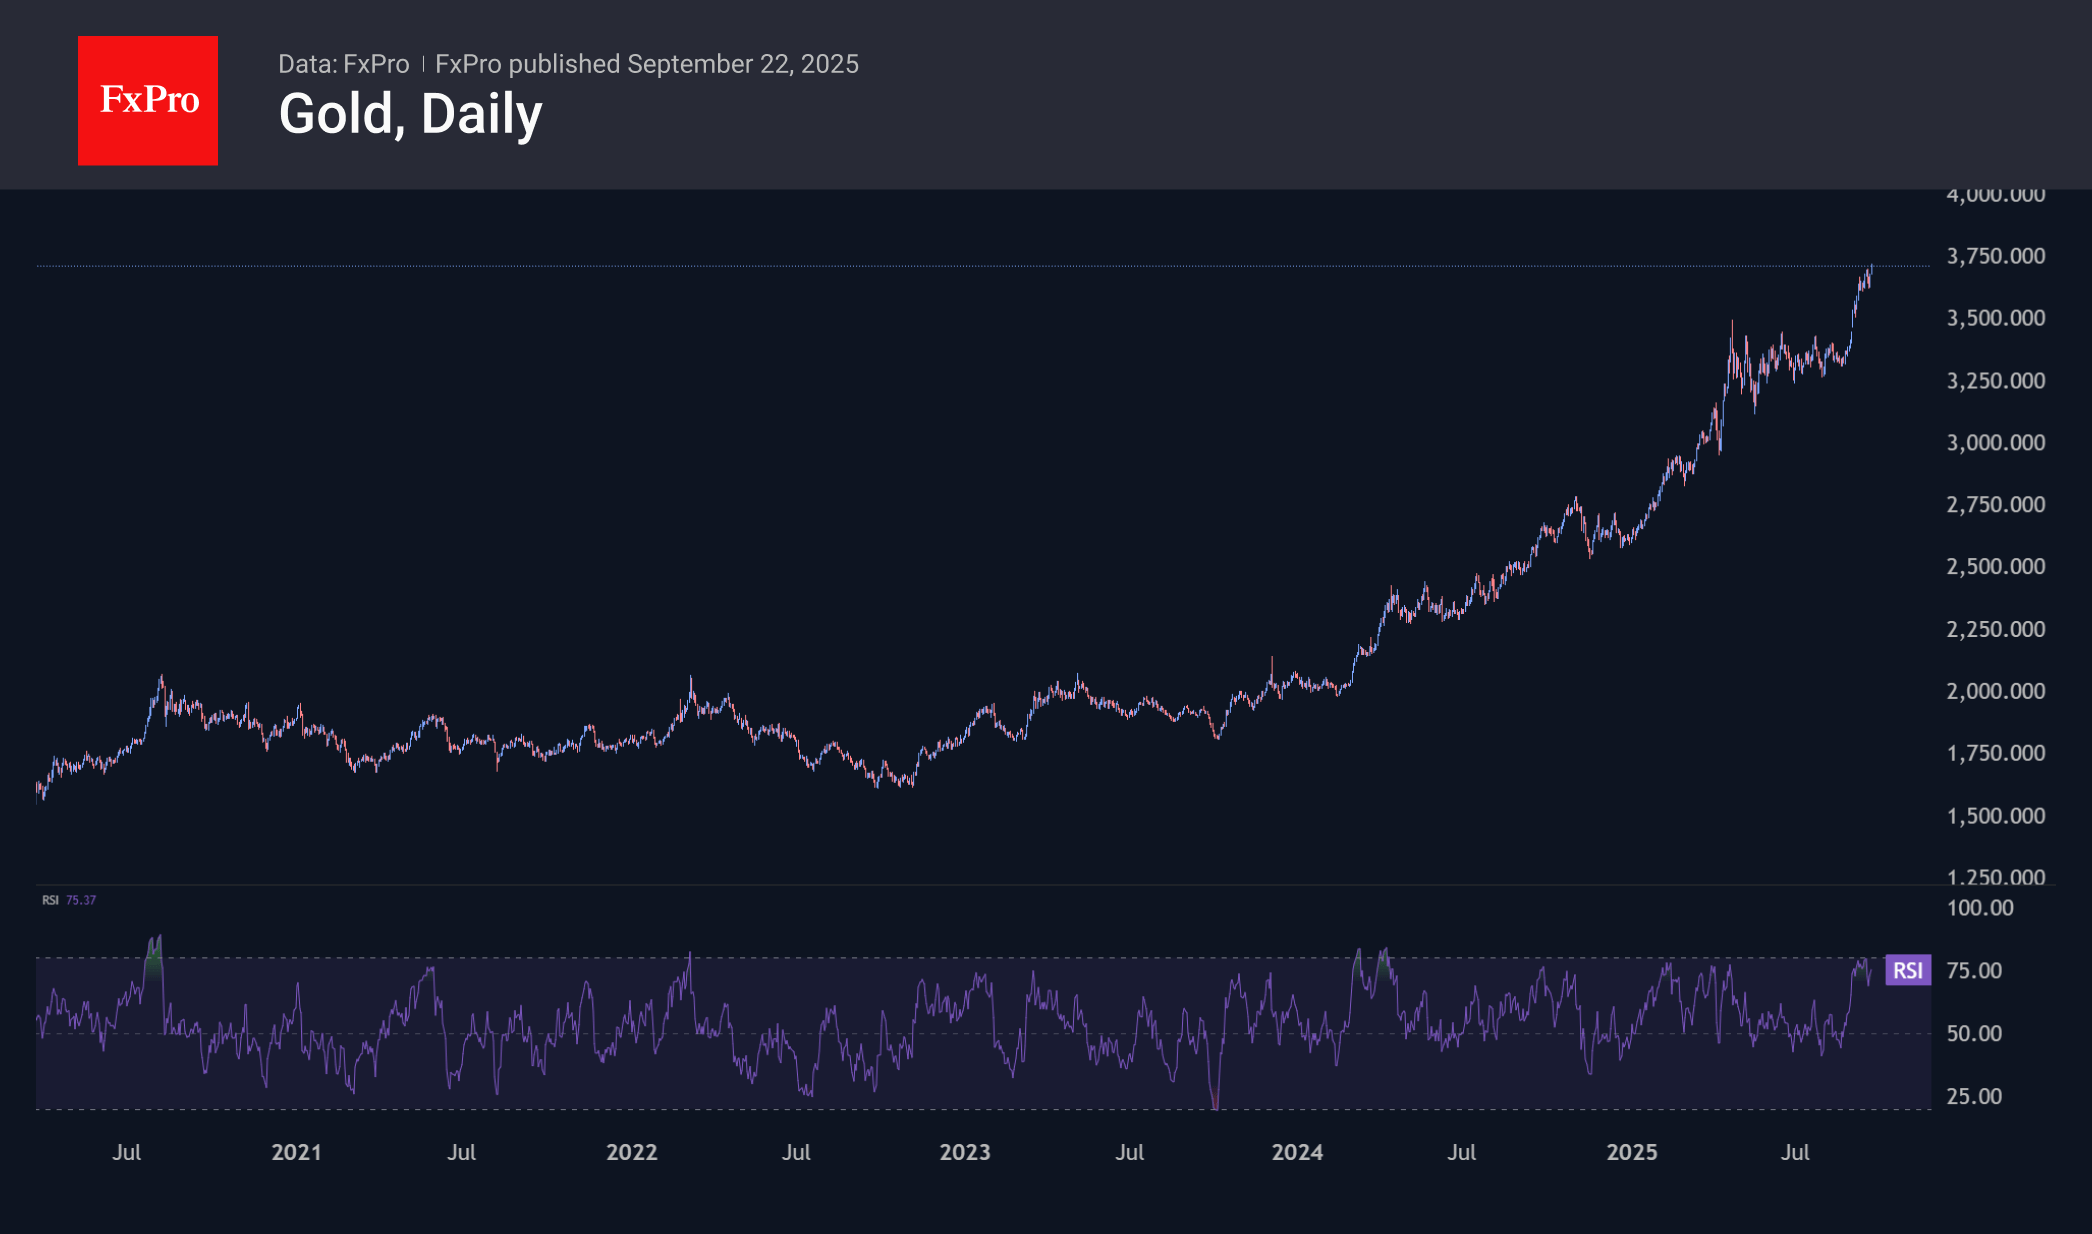
On the other hand, the price growth rate is now more of a bearish factor. The historic rally is increasing demand for a full-fledged portfolio shake-up, with a correction of more than 130% growth over the last three years. The period from September to November, with the end of the financial and calendar year, looks like a suitable point to start this trend.
Additionally, the RSI on daily timeframes entering the overbought zone above 80 earlier in September increases the risks of a decline. Last week’s price decline pushed the index back to 70. A similar signal has triggered a sideways movement or correction about a dozen times in the last five years, with only one exception in April 2024, when we saw an 8% price increase before a three-month sideways movement.
On balance, we view the situation as the final stage of gold’s increase over the past three years. Growth within it may be quite aggressive, combined with accelerated closing of short positions. However, for medium- and long-term investors, this is suitable for closing long positions and looking for the right moment to open short ones.
Hang Seng Index Finds Support
As the chart shows, Hong Kong’s Hang Seng Index (Hong Kong 50 on FXOpen) has fallen more than 3% from its 2025 high over the past week. In recent days, several factors may have driven bearish sentiment:
→ Domestic Chinese policy: Media reports indicate that on Monday the head of China’s central bank held a press conference, but market participants may have been disappointed by the proposed economic stimulus measures.
→ US influence: This includes both trade deal negotiations and the Federal Reserve’s recent decision to cut interest rates.
→ Other news: For example, the approach of Typhoon Ragas.
Additionally, reaching a peak near 27,000 points may have prompted long-position holders to take profits, creating a wave of selling.
Nevertheless, the chart shows several technical signs suggesting that the market is finding support, and the scope for further declines appears limited.
Technical Analysis of the Hang Seng Index Chart
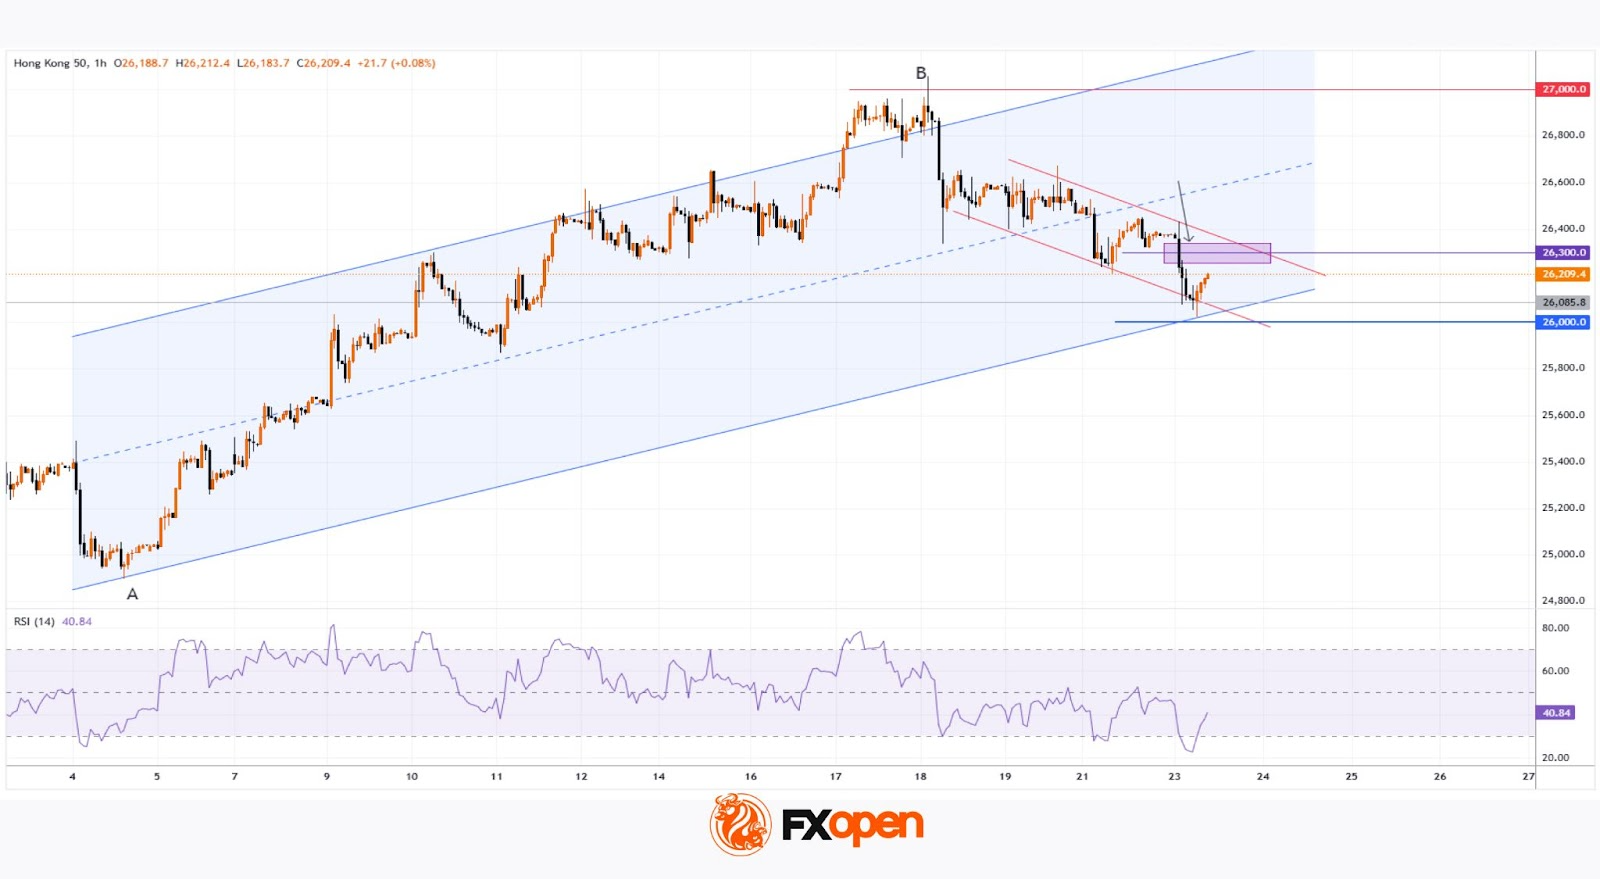
Market movements in September have formed an ascending channel (shown in blue), with support provided by:
→ the lower boundary of this channel;
→ the psychological level of $26,000;
→ the 50% retracement level following the A→B impulse.
Bulls may take confidence from the fact that the RSI is in oversold territory.
In the short term, the initiative remains with the bears:
→ they are holding the Hang Seng stock price within a descending trajectory (shown in red);
→ the break below the 26,300 level occurred aggressively (marked with an arrow) — wide candles indicate a seller-dominated imbalance, making the consideration of a bearish Fair Value Gap pattern (highlighted in purple) relevant.
However, in the longer term, the odds favour the bulls:
→ the index has risen approximately 30% since the start of 2025;
→ in this context, we may be inside a Bullish Flag pattern, suggesting a potential resumption of the prevailing uptrend after an intermediate correction.
Trade global index CFDs with zero commission and tight spreads. Open your FXOpen account now or learn more about trading index CFDs with FXOpen.
This article represents the opinion of the Companies operating under the FXOpen brand only. It is not to be construed as an offer, solicitation, or recommendation with respect to products and services provided by the Companies operating under the FXOpen brand, nor is it to be considered financial advice.