Sample Category Title
UK PMI composite falls to 51, raises pressure on BoE to turn dovish
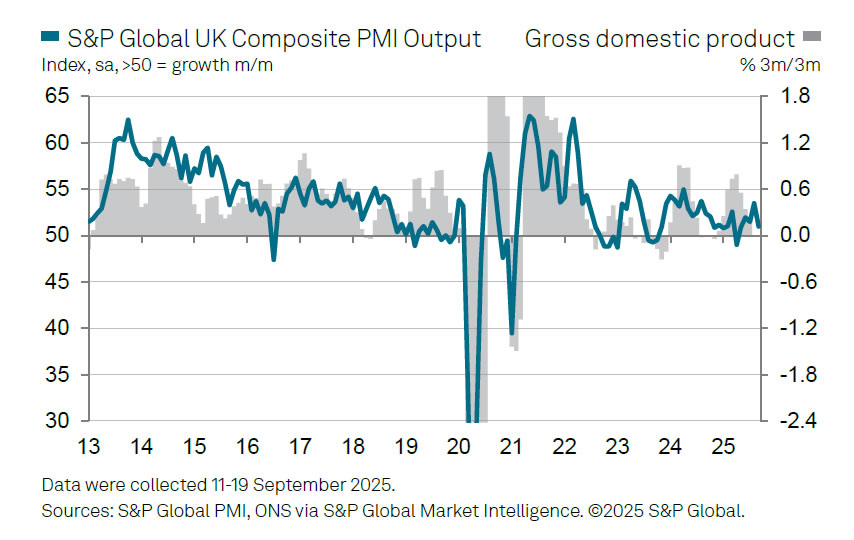
UK business activity weakened sharply in September, with the flash composite PMI dropping from 53.5 to 51.0, a 4-month low. Manufacturing fell further into contraction from 47.0 to 46.2. Services slipped from 54.2 to 51.9, pointing to a broad loss of momentum across sectors.
S&P Global’s Chris Williamson described the report as a “litany of worrying news,” citing slumping overseas trade, worsening confidence, and steep job losses. The survey signalled around 50,000 job cuts over the past three months, underscoring that the economy is “almost stalling.”
The only bright spot was softer price pressures, with firms reporting one of the smallest increases in goods and services prices since the pandemic. For the BoE, the combination of weakening growth, easing inflation, and rising unemployment may shift the debate back toward a "more dovish stance" in the months ahead.
Eurozone PMI composite at 16-month high of 51.2, Germany lifts while France drags
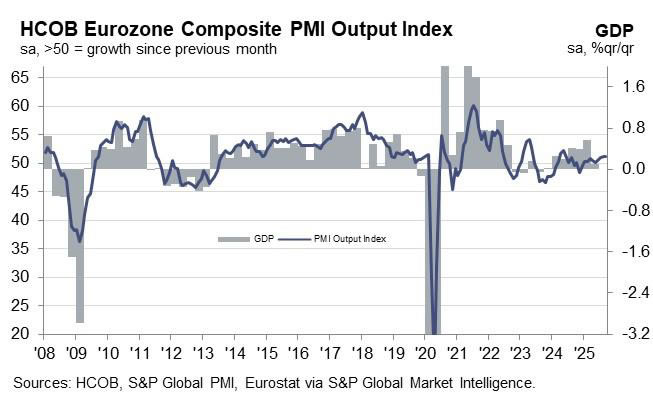
Eurozone flash PMIs for September showed a mixed picture, with manufacturing slipping back into contraction while services drove growth. The manufacturing index fell from 50.7 to 49.5, but services rose from 50.5 to 51.4, a 9-month high, lifting the Composite PMI from 51.0to 51.2 — its strongest in 16 months.
Hamburg Commercial Bank’s Cyrus de la Rubia said the bloc is “still on a growth path,” though far from gaining "any real momentum". Germany’s recovery stood out, with manufacturing falling from 59.8 to 48.5 but services jumping to 52.5, pushing its Composite PMI from 50.5 to 52.4 (a 16-month high). France lagged, with both manufacturing and services sliding back below 50, leaving its composite at 48.4, down from 49.8 and a 5-month low.
De la Rubia cautioned that French political uncertainty had disrupted production plans, while order books in both Germany and France showed significant declines. Hiring has now “come to a halt” across the bloc, with sluggish job creation in services and sharper losses in manufacturing. Confidence in rising output has dipped.
On the inflation side, cost pressures in services have "eased slightly" but remain unusually high, while selling prices "cooled more noticeably". That combination could give the ECB reason to consider whether a rate cut before year-end is back on the table.
Silver (XAGUSD) Elliott Wave Outlook: Powerful Bullish Rally in Motion
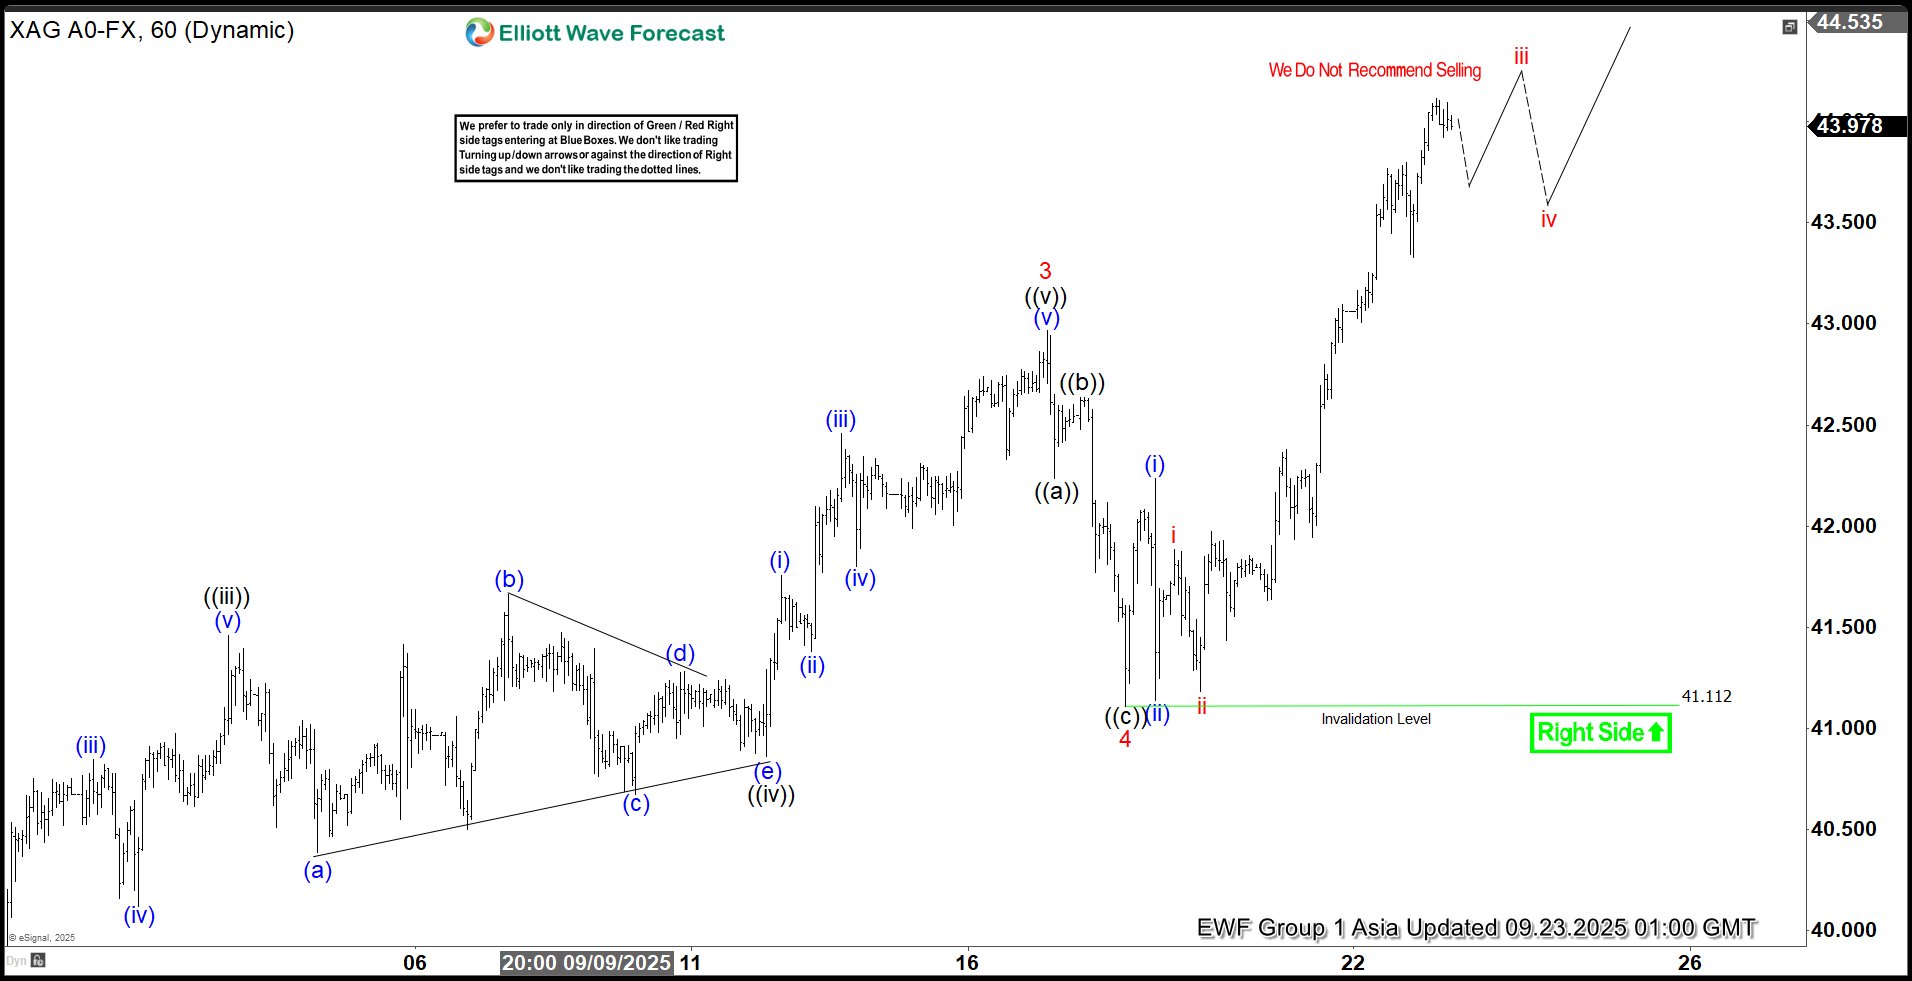
The short-term Elliott Wave analysis for Silver (XAGUSD) indicates a robust impulsive rally that began on July 31. From that low, the metal surged, completing wave 1 at $38.73, followed by a corrective pullback in wave 2 that concluded at $36.94. The upward momentum resumed in wave 3, which peaked at $42.96, as illustrated on the one-hour chart. Subsequently, wave 4 unfolded as a zigzag structure, with wave ((a)) terminating at $42.23 and wave ((b)) reaching $42.636. The decline in wave ((c)) finalized at $41.11, marking the completion of wave 4 in the higher degree.
Silver then turned higher in wave 5, exhibiting an internal structure of five smaller-degree waves. From the wave 4 low, wave (i) advanced to $42.23, followed by a dip in wave (ii) to $41.13. The metal continued its ascent, with wave i concluding at $41.88 and wave ii finding support at $41.18. In the near term, as long as the price remains above $41.11, dips are expected to attract buyers in a 3, 7, or 11-swing sequence, supporting further upward extensions. This analysis suggests that Silver’s bullish trend remains intact, with potential for additional gains as the impulsive structure continues to develop.
Silver (XAGUSD) – 60 Minute Elliott Wave Technical Chart:
XAGUSD – Elliott Wave Technical Video:
https://www.youtube.com/watch?v=KURP_M3v3FA
Nikkei 225: Bullish Reversal Above 45,000, No Negative Impact from BoJ’s ETF Unwind
The Japan 225 CFD Index (a proxy of the Nikkei 225 futures) has continued to remain in a bullish trend as expected and rallied by 5.3% to hit a fresh all-time high of 45,956 on last Thursday, 18 September 2025, ex-post FOMC.
Thereafter, the Japan 225 CFD Index staged a minor corrective pull-back of -3.2% to print an intraday low of 44,485 on Friday, 19 September 2025, on the onset of the Bank of Japan (BoJ) announcement to start unwinding its massive hoard of around 79.5 trillion yen of exchange-traded funds (ETF) by market value as of mid-September tied to Japan benchmark stock indices.
BoJ aims to sell its ETF holdings at a pace of around ¥620 billion per year by market value, or ¥330 billion by book value, starting in 2026. It will be a gradual unwinding process that may take more than 100 years to complete under the current plan. Additionally, it marks the first time the BoJ has laid out a plan for offloading the assets it has accumulated over years of ultra-easy monetary policy.
Let’s now examine a fundamental factor that still supports a medium-term bullish trend in the Nikkei 225.
Earnings revision continues to get upgraded for Japanese equities
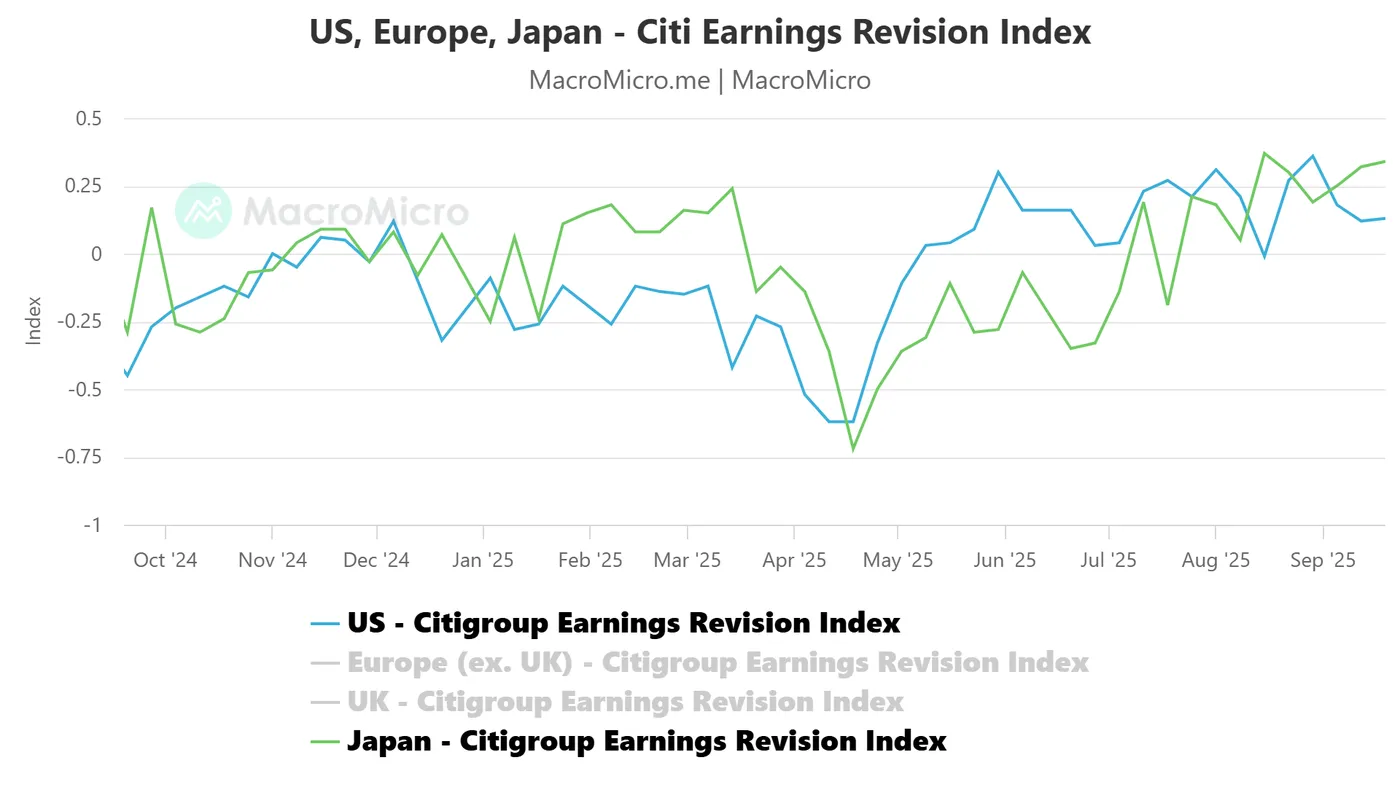
Fig. 1: Japan & US Citigroup Earnings Revision Index as of 19 Sep 2025 (Source: MacroMicro)
Sell-side analysts have continued to upgrade the earnings growth potential of the Japanese stock market. Based on the latest data from the Citigroup Earnings Revision Index for Japanese equities as of 19 September 2025, it rose to 0.34 from the previous reading of 0.19 on 29 August 2025 (see Fig. 1).
The Japan Citigroup Earnings Revision Index has been trending upwards since 20 June 2025, printing -0.35, which suggests that analysts, on average, are becoming more optimistic about the outlook for corporate earnings in Japan, in turn supporting the ongoing medium-term bullish trend in the Nikkei 225.
In addition, the pace of analysts’ earnings upgrades in Japan rose at a steeper pace since 29 August 2025, versus the US Citigroup Earnings Revision Index.
We now focus on the short-term (1to 3 days) trajectory, key elements, and key levels to watch on the Japan 225 CFD Index from a technical analysis perspective.
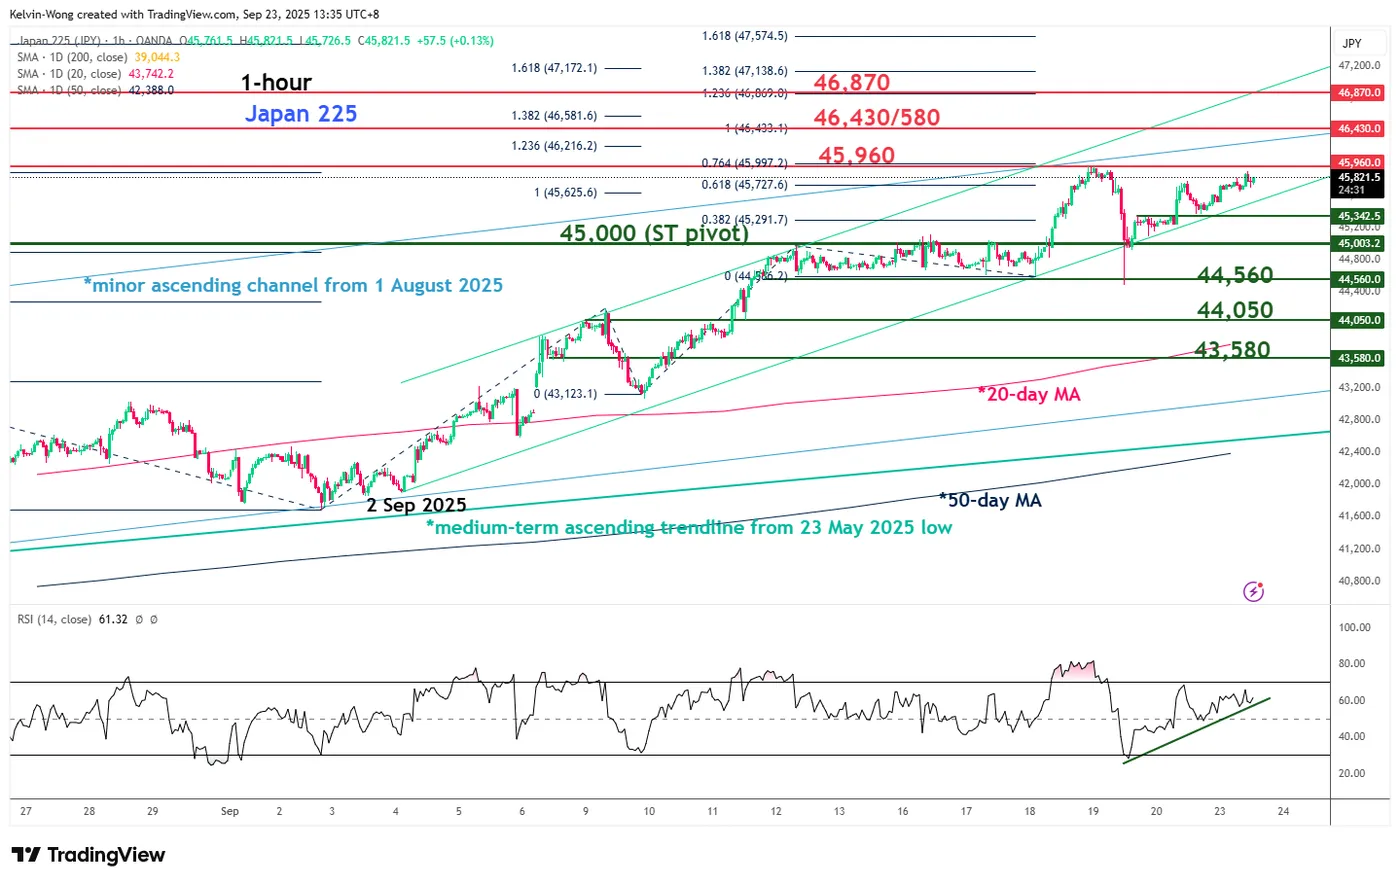
Fig. 2: Japan 225 CFD Index minor trend as of 23 Sep 2025 (Source: TradingView)
Preferred trend bias (1-3 days)
Maintain the bullish bias on the Japan 225 CFD Index with a tightened short-term pivotal support now at 45,000. A clearance above 45,960 increases the odds of bullish impetus for the next intermediate resistances to come in at 46,430/46,580 and 46,870 (Fibonacci extension cluster and towards the upper boundary of a steeper minor ascending channel from the 2 September 2025 low) (see Fig. 2).
Key elements
- The price actions of the Japan 225 CFD Index have continued to oscillate above its 20-day and 50-day moving averages, which suggests that its minor and medium-term uptrend phases remain intact.
- The hourly RSI momentum indicator of the Japan 225 CFD Index has exhibited a bullish momentum condition as it managed to trend higher above an ascending support and has not reached its overbought zone (above the 70 level).
Alternative trend bias (1 to 3 days)
A break below the 45,000 key short-term support for the Japan 225 CFD Index invalidates the bullish acceleration scenario to kickstart a minor corrective decline sequence to expose the next intermediate supports at 44,560 and 44,050.
Euro Area Economy Bottoming Out But at Snail’s Pace
Markets
The slight US Treasury underperformance vs Bunds throughout the day yesterday deepened in the wake of some Fed policymakers hitting the wires after last week’s meeting. Fed’s Hammack and Bostic, both non-voters this year, and Musalem (voter) are all worried about inflation, which has been and still is too high for a long time. Bostic and Musalem supported the September rate cut but warned the room for further easing is limited (without policy becoming overly accommodative). Hammack prior to that meeting said she saw no case for lowering interest rates with inflation too high and the labour market “still in a pretty good shape”. The Fed should be very cautious in removing policy restriction, the Cleveland Fed president noted. Miran repeated his call for jumbo cuts this year to 3%-3.25% and added that’s he’ll likely continue to dissent at future Fed meetings. Such comments make him a man to ignore from a market point of view. The US yield curve bear flattened with net daily changes varying between +1.9 bps (30-yr) to 3.2 bps (2-yr). German rates traded within a 2.5 bps trading range to end the day basically flat, the exception being the 30-yr (+2 bps). Interest differentials widened in favour of the USD but it were the technicals that dominated EUR/USD. The pair bounced off a short-term upward sloping trendline (originating in August) to end around the 1.18 big figure. EUR/GBP followed higher in EUR/USD’s slipstream and closes in on the July high (0.8769). Gold rallied to a new record high ($3746/ounce) like a two-staged-rocket while oil prices dropped for a fourth day straight ($66.57/b). Wall Street keeps hitting records, although the one yesterday was driven by the usual (tech) suspects.
The economic calendar churns out September PMI business confidence indicators today. It started with Australia and India this morning (see below), heads into the euro area and the UK before arriving in the US. Japan is scheduled for release tomorrow due to a national holiday. The euro area economy is bottoming out but it’s happening at a snail’s pace. That’s the main message coming from the PMIs for the last couple of months now and we don’t expect a major acceleration having taken place last month. Consensus expects readings similar to August: 51.1 for the composite with both manufacturing (50.7) and services (50.5) growing marginally. US PMIs are usually of second tier importance (compared to the ISMs) but nevertheless worth following up. We’ve seen US yields correcting higher in the wake of the Fed’s very dispersed dot plot. It lacked clear, unambiguous guidance for future moves lower while markets were positioned as such. Given the wide views at the Fed, (money) markets are vulnerable for economic data in both directions. Upside surprises strengthen calls from the likes mentioned above and vice versa. For the US dollar to lose support at EUR/USD 1.1919 (September multiyear high) the US PMIs would probably have to deliver a major miss though. Fed chair Powell later vents views on the economy but they shouldn’t differ much from the ones set out last week.
News & Views
Australia and India kicked off September global PMI releases this morning. Australian business activity growth slowed with the composite PMI falling back from a multi-year high of 55.5 in August to 52.1. The weaker expansion of output was driven by a slower rise in incoming new orders (even drop in goods new orders), attributed partly to a renewed fall in export orders. Business optimism also fell to the lowest level in a year. That said, firms continued to hire at a solid pace to cope with ongoing workloads and to clear existing orders. Average input costs continued to increase at an above-average pace while selling price inflation eased slightly. Indian private sector growth cooled as well in September. The composite PMI came off a multi-year high as well but still points at a sharp rate of expansion (63.2 from 61.9). A softer expansion in new business intakes accompanied slower increases in private sector output and employment, with international sales also rising at a weaker pace. The impact of higher US tariffs (50%) on India was partly offset by stronger domestic order growth backed by lower tax rates. Prices trends were more benign as cooler input cost inflation allowed for selling charges to be lifted to a lesser degree. Nevertheless, business confidence strengthened at the end of the second fiscal quarter.
EUR/USD Daily Outlook
Daily Pivots: (S1) 1.1751; (P) 1.1777; (R1) 1.1829; More...
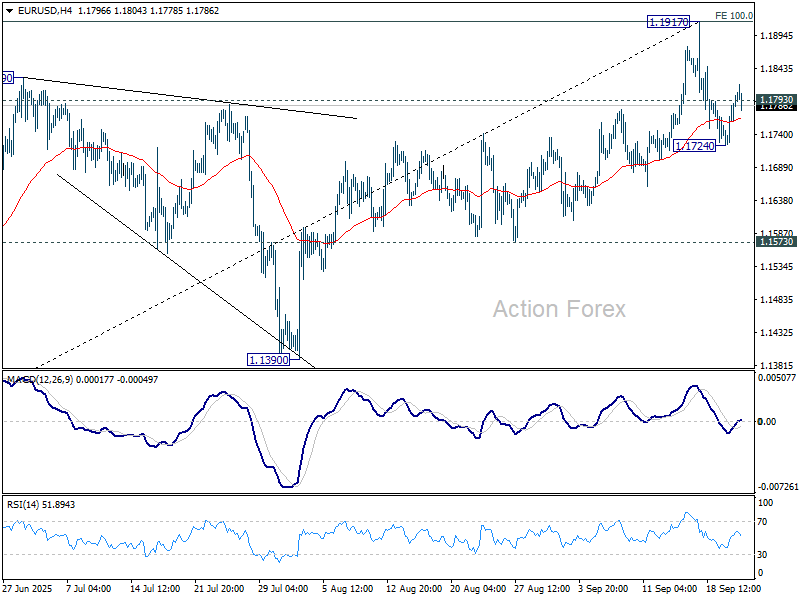
EUR/USD's recovery from 1.1724 extended higher but upside momentum is unconvincing. Intraday bias is turned neutral first. On the downside, break of 1.1724 will resume the fall from 1.1917 to 55 D EMA (now at 1.1663). Considering bearish divergence condition in D EMA, sustained break of 55 D EMA will argue that 1.1917 is already a medium term top. Deeper fall should then be seen to 1.1390 support next. However, sustained break of 1.1917 will resume larger up trend to 1.2 psychological level.
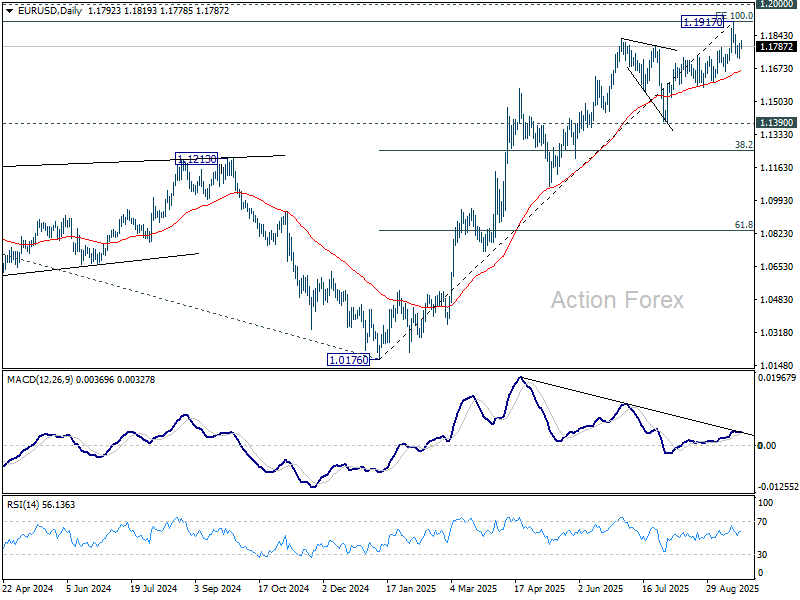
In the bigger picture, rise from 1.0176 (2025 low) is seen as the third leg of the pattern from 0.9534 (2022 low). 100% projection of 0.9534 to 1.1274 from 1.0176 at 1.1916 was already met. For now, further rally will remain in favor as long as 1.1390 support holds, and firm break of 1.2000 psychological level will carry larger bullish implications. However, firm break of 1.1390 will suggest that rise from 1.0176 has already completed and bring deeper fall to 55 W EMA (now at 1.1214).
USD/JPY Daily Outlook
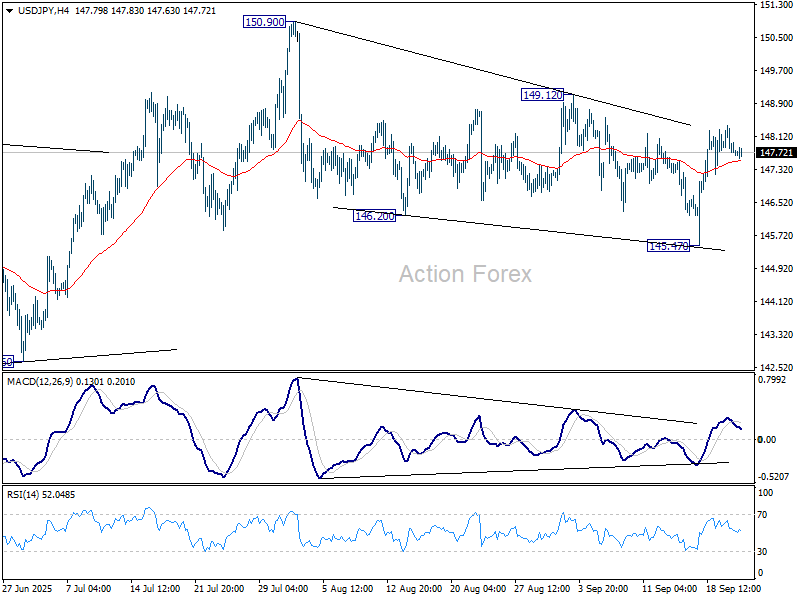
Daily Pivots: (S1) 147.47; (P) 147.93; (R1) 148.19; More...
Intraday bias in USD/JPY remains neutral and outlook is unchanged. Current development suggests that rise from 139.87 might still be in progress. On the upside, break of 149.12 will bring stronger rally to retest 150.90 high. However, break of 145.47 will resume the fall from 150.90 instead.
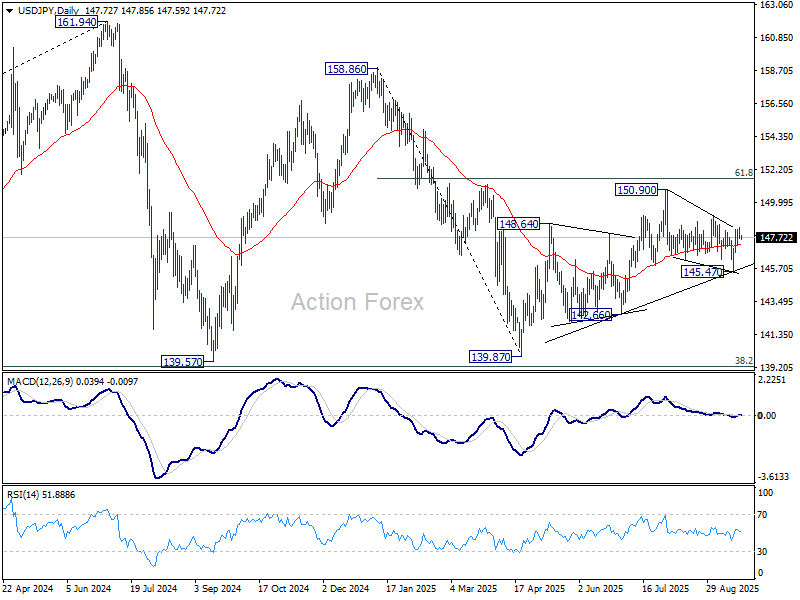
In the bigger picture, price actions from 161.94 (2024 high) are seen as a corrective pattern to rise from 102.58 (2021 low). Decisive break of 61.8% retracement of 158.86 to 139.87 at 151.22 will argue that it has already completed with three waves at 139.87. Larger up trend might then be ready to resume through 161.94 high. In case the corrective pattern extends with another fall, strong support is expected from 38.2% retracement of 102.58 to 161.94 at 139.26 to bring rebound.
GBP/USD Daily Outlook
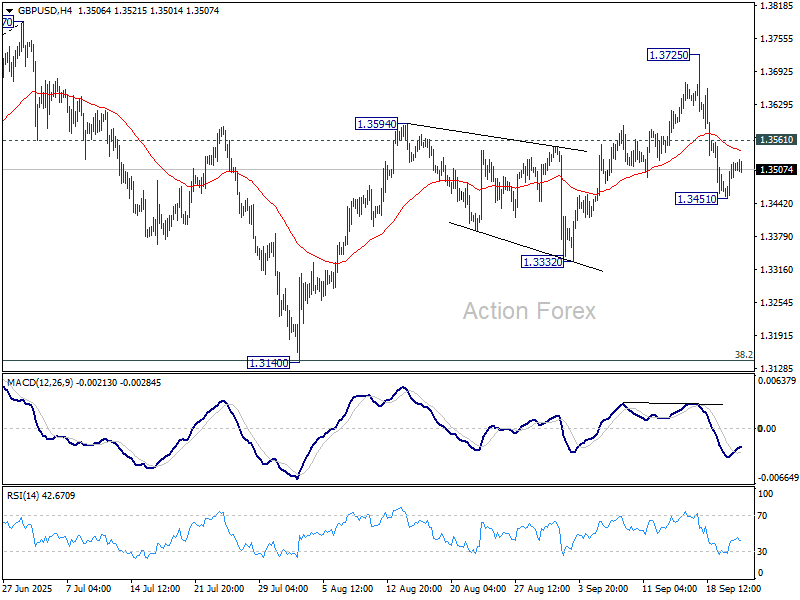
Daily Pivots: (S1) 1.3471; (P) 1.3496; (R1) 1.3538; More...
Intraday bias in GBP/USD is turned neutral with current recovery. On the downside, below 1.3451 will resume the fall from 1.3725, as the third leg of the pattern from 1.3787, and target 1.3332 support first. Nevertheless, decisive break of 1.3561 will turn bias back to the upside for retesting 1.3725 instead.
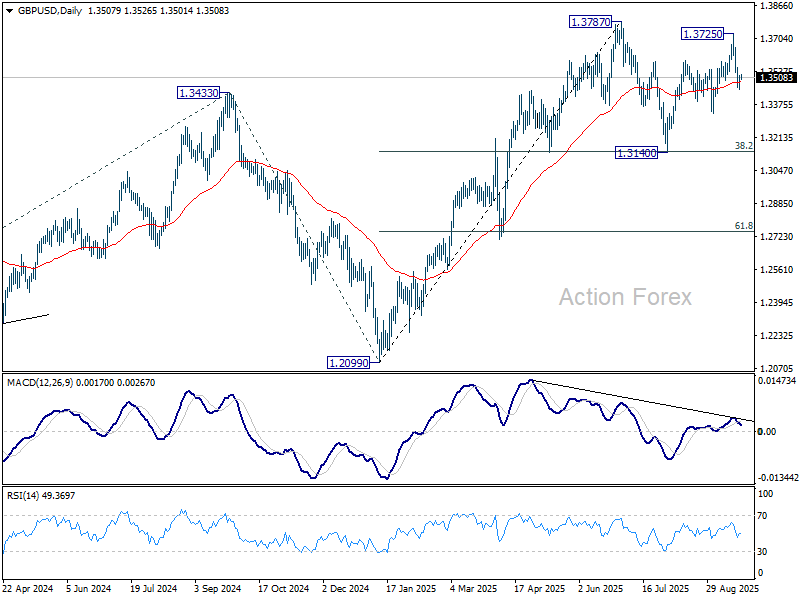
In the bigger picture, rise from 1.3051 (2022 low) is in progress, and would target 61.8% projection of 1.0351 to 1.3433 (2024 high) from 1.2099 (2025 low) at 1.4004. However, with 1.4248 resistance (2021 high) intact, this rally is more likely a corrective move. Sustained break of 55 W EMA (now at 1.3157) will argue that a medium term top has already formed and bring deeper fall back to 1.2099.
USD/CHF Daily Outlook
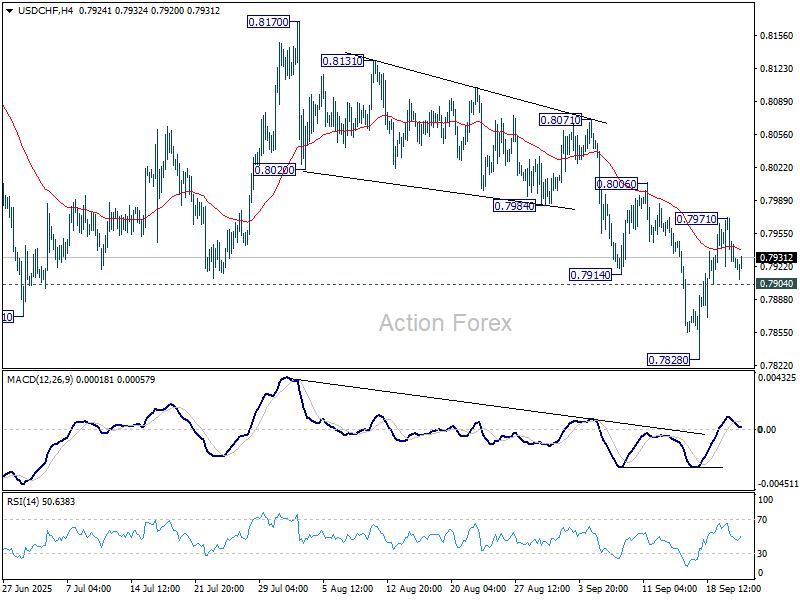
Daily Pivots: (S1) 0.7906; (P) 0.7940; (R1) 0.7958; More….
Intraday bias in USD/CHF is turned neutral first with current retreat. On the upside, above 0.7971 will resume the rebound from 0.7828 short term bottom to 0.8006 resistance. Firm break there will bring stronger rise back to 0.8170. On the downside though, below 0.7904 minor support will bring retest of 0.7828 low instead.
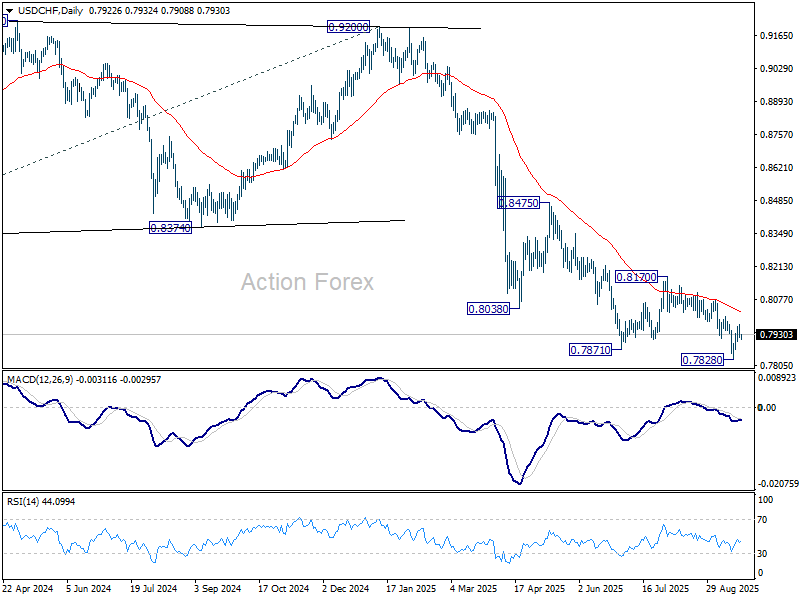
In the bigger picture, long term down trend from 1.0342 (2017 high) is still in progress. Next target is 100% projection of 1.0146 (2022 high) to 0.8332 from 0.9200 at 0.7382. In any case, outlook will stay bearish as long as 0.8332 support turned resistance holds (2023 low).
AUD/USD Daily Report
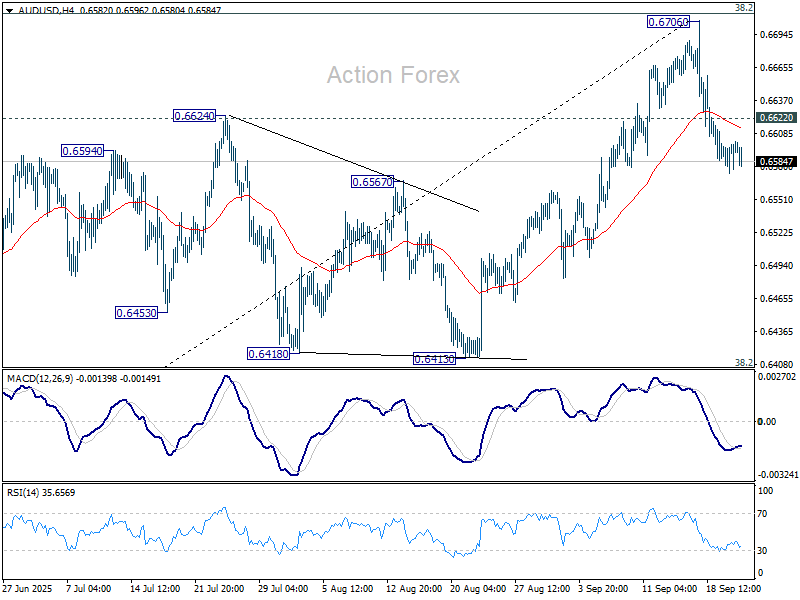
Daily Pivots: (S1) 0.6577; (P) 0.6598; (R1) 0.6622; More...
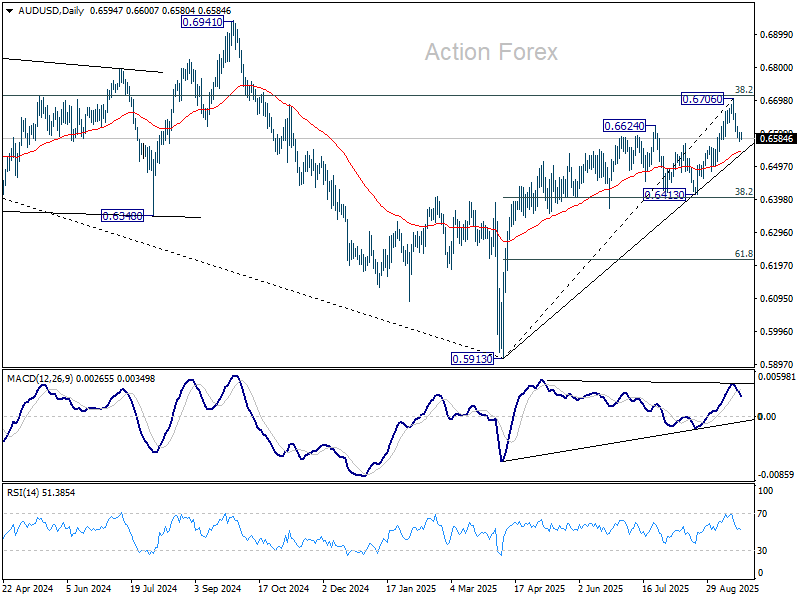
Intraday bias in AUD/USD remains on the downside as fall from 0.6705 short term top is in progress for 55 D EMA (now at 0.6540). Firm break there will target 0.6413 support. On the upside, though above 0.6622 minor resistance will bring retest of 0.6706 high.
In the bigger picture, there is no clear sign that down trend from 0.8006 (2021 high) has completed. Rebound from 0.5913 is seen as a corrective move. Outlook will remain bearish as long as 38.2% retracement of 0.8006 to 0.5913 at 0.6713 holds. Nevertheless, considering bullish convergence condition in W MACD, sustained break of 0.6713 will be a strong sign of bullish trend reversal, and path the way to 0.6941 structural resistance for confirmation.