
Sample Category Title
Dollar Rebound Pauses, FX Range-Bound as Markets Awaits Fedspeaks
Trading remained subdued in the forex markets today, with most major pairs consolidating within Friday’s ranges. Dollar has given back some of last week’s gains, though selling momentum remains modest and order flows are light. Market conviction on the Fed outlook remains steady. Futures price a 92% probability of a rate cut at the October meeting, with slightly less than 80% odds of another cut in December. These expectations continue to anchor positioning even as the Dollar cools.
Attention today will turn to remarks from a slate of Fed officials, most notably New York Fed President John Williams. While Williams’ comments often carry weight given his central role, markets doubt any of the speakers will meaningfully alter expectations for two more cuts this year. Instead, traders are looking further ahead to next week’s U.S. non-farm payrolls as the data event that could shift sentiment.
Before that, September PMI releases from Australia, the Eurozone, the UK, and the U.S. will arrive tomorrow. With tariff tensions largely settled, the improving trend in business activity is expected to continue, leaving only major surprises capable of stirring the FX market.
For now, Euro is the day’s outperformer, supported by modest cross-buying flows, followed by Swiss Franc and Sterling. Loonie is lagging at the bottom, trailed by Aussie and Kiwi, while Dollar and Yen sit mid-pack.
In Europe, at the time of writing, FTSE is up 0.18%. DAX is down -0.50%. CAC is down -0.15%. UK 10-year yield is down -0.016 at 4.701. Germany 10-year yield is down -0.007% 2.744. Earlier in Asia, Nikkei rose 0.99%. Hong Kong HSI fell -0.76%. China Shanghai SSE rose 0.22%. Singapore Strait Times fell -0.12%. Japan 10-year JGB yield rose 0.19 to 1.660.
ECB survey finds tariff concerns alter consumption, push up inflation expectations
An ECB Economic Bulletin article revealed that Eurozone consumers are already adjusting their spending patterns in anticipation of US tariffs. The survey showed that 26% of respondents have shifted away from American products, while 16% reported reducing overall spending.
The ECB noted differences across income groups: high-income households were more likely to substitute away from U.S. goods, while lower-income households leaned toward cutting total spending. Most of these reductions have been concentrated in discretionary purchases, with necessities largely shielded.
Beyond current spending patterns, the ECB warned that households are also revising their inflation expectations higher, including longer-term views. That suggests consumers see tariff-related price pressures as more than transitory.
RBA's Bullock: Economy may prove weaker or stronger than forecasts
RBA Governor Michele Bullock told a parliamentary committee today that the central bank expects underlying inflation to moderate toward the midpoint of its 2–3% target range, with forecasts conditioned on the market’s assumption of modest further easing. Recent rate cuts are seen supporting household and business spending, while real income growth should help sustain consumption in the year ahead.
She noted that domestic data since the August meeting have been “broadly in line with expectations, or slightly stronger,” giving the Board some confidence heading into next week’s policy meeting. But Bullock stressed that forecasts remain only estimates, and the outlook is highly uncertain, particularly given the unpredictable global environment.
She highlighted risks on both sides: growth momentum may fade, or it could prove “materially stronger” than anticipated. Bullock warned that "excess demand" in the economy and labour market could persist, particularly that "productivity growth has not picked up and growth in unit labour costs remains high".
PBoC holds fire, China stays patient on stimulus as economy shows strain
The People’s Bank of China left its one-year loan prime rate at 3.0% and the five-year at 3.5% today, extending a steady policy stance for the fourth month running. The unchanged setting came in line with forecasts and follows the central bank’s last 10bps trim in May, part of earlier efforts to shore up growth.
Policymakers opted for patience as the recent strong rally in domestic equities reduced pressure for immediate support, even as official data continue to point to uneven demand and fading momentum in industry and property.
Still, most expect modest easing steps before year-end as Beijing works to lock in its 5% growth target, also as policy focus shifted from deflation management to reflation.
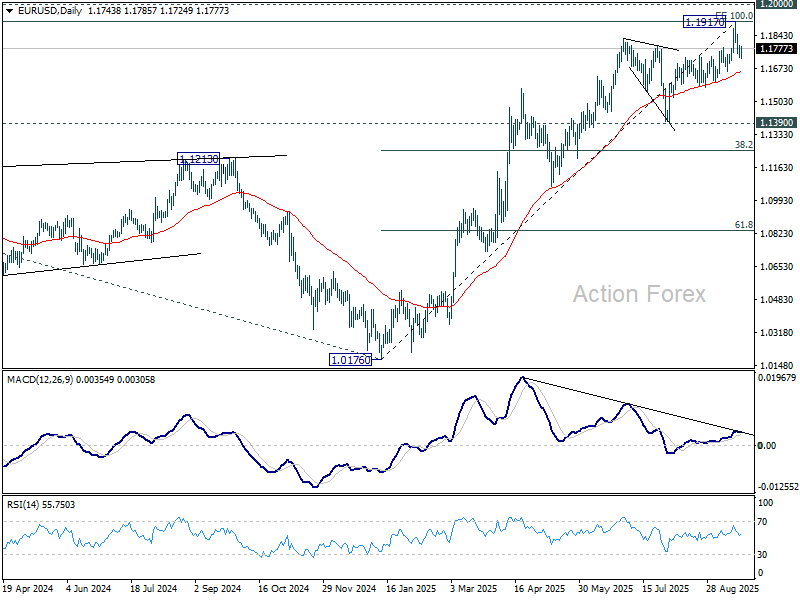
EUR/USD Mid-Day Outlook
Daily Pivots: (S1) 1.1718; (P) 1.1756; (R1) 1.1782; More...
Intraday bias in EUR/USD stays mildly on the downside with 1.1793 minor resistance intact. Fall from 1.1917 short term top should continued to 55 D EMA (now at 1.1657). Considering bearish divergence condition in D EMA, sustained break of 55 D EMA will argue that 1.1917 is already a medium term top. Deeper fall should then be seen to 1.1390 support next. On the upside, though, above 1.1793 minor resistance will retain near term bullishness and bring retest of 1.1917 high instead.
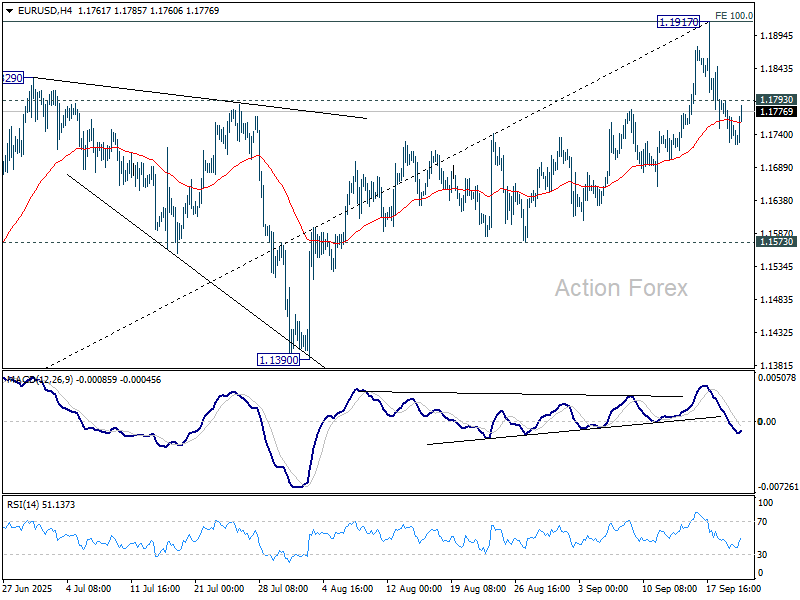
In the bigger picture, rise from 1.0176 (2025 low) is seen as the third leg of the pattern from 0.9534 (2022 low). 100% projection of 0.9534 to 1.1274 from 1.0176 at 1.1916 was already met. For now, further rally will remain in favor as long as 1.1390 support holds, and firm break of 1.2000 psychological level will carry larger bullish implications. However, firm break of 1.1390 will suggest that rise from 1.0176 has already completed and bring deeper fall to 55 W EMA (now at 1.1214).
ECB survey finds tariff concerns alter consumption, push up inflation expectations
An ECB Economic Bulletin article revealed that Eurozone consumers are already adjusting their spending patterns in anticipation of US tariffs. The survey showed that 26% of respondents have shifted away from American products, while 16% reported reducing overall spending.
The ECB noted differences across income groups: high-income households were more likely to substitute away from U.S. goods, while lower-income households leaned toward cutting total spending. Most of these reductions have been concentrated in discretionary purchases, with necessities largely shielded.
Beyond current spending patterns, the ECB warned that households are also revising their inflation expectations higher, including longer-term views. That suggests consumers see tariff-related price pressures as more than transitory.
EUR/USD Mid-Day Outlook
Daily Pivots: (S1) 1.1718; (P) 1.1756; (R1) 1.1782; More...
Intraday bias in EUR/USD stays mildly on the downside with 1.1793 minor resistance intact. Fall from 1.1917 short term top should continued to 55 D EMA (now at 1.1657). Considering bearish divergence condition in D EMA, sustained break of 55 D EMA will argue that 1.1917 is already a medium term top. Deeper fall should then be seen to 1.1390 support next. On the upside, though, above 1.1793 minor resistance will retain near term bullishness and bring retest of 1.1917 high instead.
In the bigger picture, rise from 1.0176 (2025 low) is seen as the third leg of the pattern from 0.9534 (2022 low). 100% projection of 0.9534 to 1.1274 from 1.0176 at 1.1916 was already met. For now, further rally will remain in favor as long as 1.1390 support holds, and firm break of 1.2000 psychological level will carry larger bullish implications. However, firm break of 1.1390 will suggest that rise from 1.0176 has already completed and bring deeper fall to 55 W EMA (now at 1.1214).
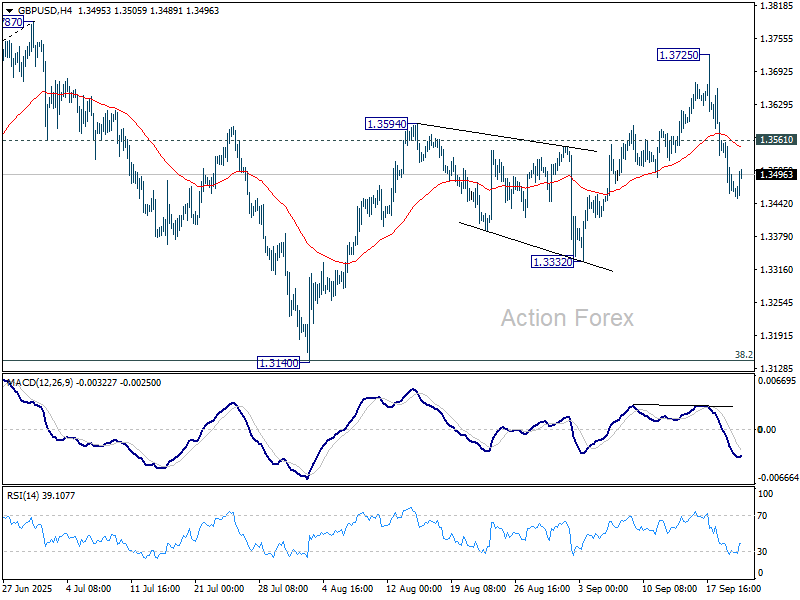
GBP/USD Mid-Day Outlook
Daily Pivots: (S1) 1.3436; (P) 1.3498; (R1) 1.3533; More...
Intraday bias in GBP/USD remains mildly on the downside at this point. Fall from 1.3725 is seen as the third leg of the corrective pattern from 1.3787 high. Further fall should be seen to 1.3332 support first. Break there will bring deeper fall to 1.3140. On the upside, though, above 1.3561 minor resistance will turn intraday bias neutral.
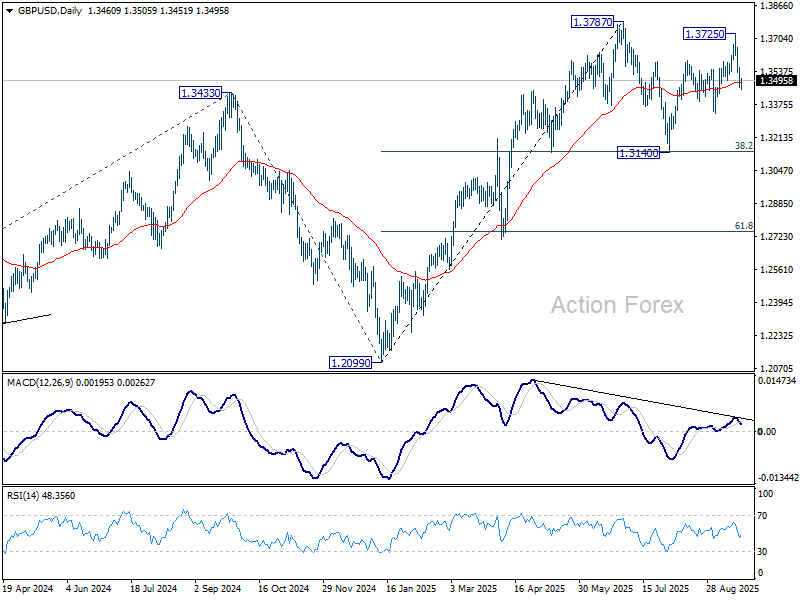
In the bigger picture, rise from 1.3051 (2022 low) is in progress, and would target 61.8% projection of 1.0351 to 1.3433 (2024 high) from 1.2099 (2025 low) at 1.4004. However, with 1.4248 resistance (2021 high) intact, this rally is more likely a corrective move. Sustained break of 55 W EMA (now at 1.3157) will argue that a medium term top has already formed and bring deeper fall back to 1.2099.
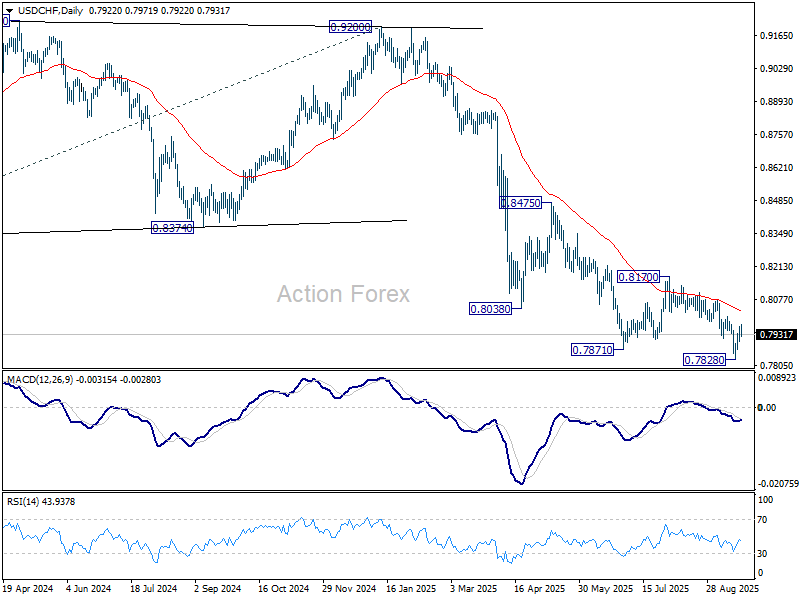
USD/CHF Mid-Day Outlook
Daily Pivots: (S1) 0.7917; (P) 0.7942; (R1) 0.7978; More….
Intraday bias in USD/CHF stays mildly on the upside as rebound from 0.7828 short term bottom is in progress for 0.8006 resistance. Firm break there will bring stronger rise back to 0.8170. On the downside though, below 0.7904 minor support will bring retest of 0.7828 low instead.
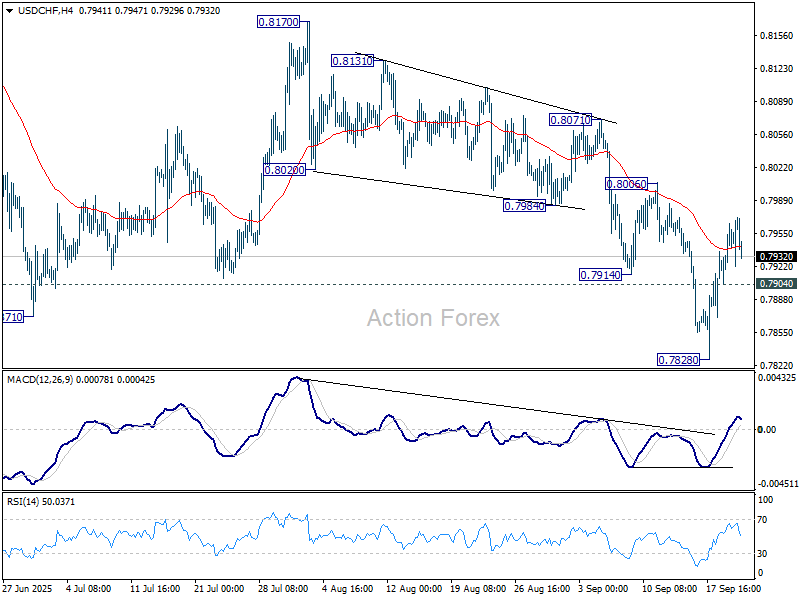
In the bigger picture, long term down trend from 1.0342 (2017 high) is still in progress. Next target is 100% projection of 1.0146 (2022 high) to 0.8332 from 0.9200 at 0.7382. In any case, outlook will stay bearish as long as 0.8332 support turned resistance holds (2023 low).
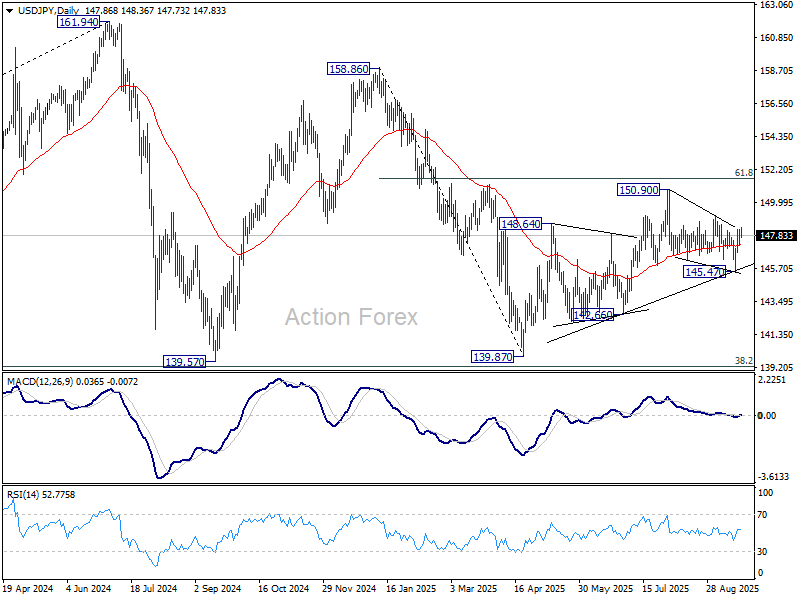
USD/JPY Mid-Day Outlook
Daily Pivots: (S1) 147.35; (P) 147.82; (R1) 148.43; More...
No change in USD/JPY's outlook and intraday bias stays neutral for the moment. Current development suggests that rise from 139.87 might still be in progress. On the upside, break of 149.12 will bring stronger rally to retest 150.90 high. However, break of 145.47 will resume the fall from 150.90 instead.
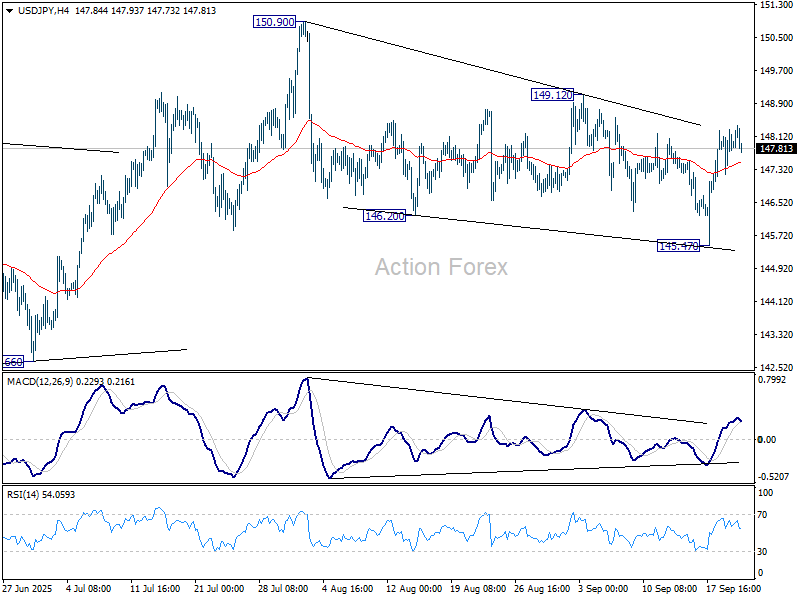
In the bigger picture, price actions from 161.94 (2024 high) are seen as a corrective pattern to rise from 102.58 (2021 low). Decisive break of 61.8% retracement of 158.86 to 139.87 at 151.22 will argue that it has already completed with three waves at 139.87. Larger up trend might then be ready to resume through 161.94 high. In case the corrective pattern extends with another fall, strong support is expected from 38.2% retracement of 102.58 to 161.94 at 139.26 to bring rebound.
Silver Price Hits 14-Year High
As shown on the XAG/USD chart, today the price of silver has climbed above $43.60 per ounce for the first time since 2011.
This may reflect expectations that the recent Federal Reserve interest rate cut will provide a boost to the global economy, where demand for silver is strengthening due to the growth of sectors such as solar energy, electric vehicles, and electronics. In addition, XAG/USD gains further support from gold, which today set a new record high above $3,720.
Technical Analysis of the XAG/USD Chart
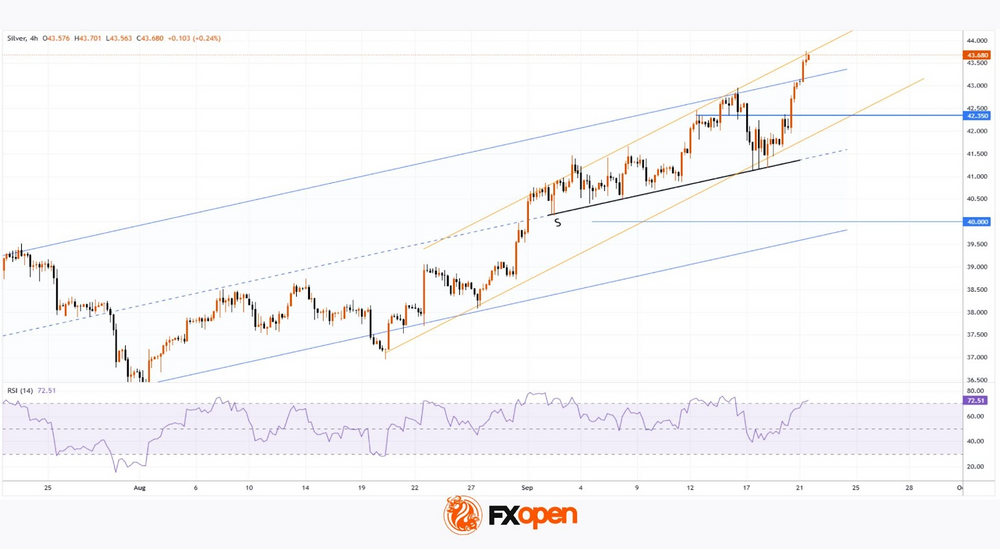
When analysing XAG/USD price movements earlier this month, we:
→ drew an ascending blue channel;
→ noted that silver had encountered a resistance block;
→ suggested a possible corrective scenario towards the psychological $40 level.
Since then, the black line (S) has:
→ proved itself as a strong support level, preventing a decline towards $40;
→ provided enough local pivot points to update the slope of the blue channel.
As of today, silver has broken above the upper boundary of this channel (highlighting strong demand). At the same time:
→ the RSI indicator is in overbought territory;
→ the price is positioned at the upper boundary of a steeper short-term uptrend, plotted from fluctuations over the past month (shown in orange).
Thus, we could assume that XAG/USD is currently vulnerable to a correction following a nearly 10% rally since the beginning of the month, as buyers are likely tempted to take profits.
Should a pullback occur in the near term, silver may find support:
→ around $42.35 – a level that has repeatedly switched roles between resistance and support;
→ at the lower boundary of the orange channel.
Looking further ahead, we may well witness fresh records for both silver and gold before year-end – particularly if the news flow continues to fuel trader expectations of additional Fed rate cuts and inflation concerns persist.
Start trading commodity CFDs with tight spreads. Open your trading account now or learn more about trading commodity CFDs with FXOpen.
This article represents the opinion of the Companies operating under the FXOpen brand only. It is not to be construed as an offer, solicitation, or recommendation with respect to products and services provided by the Companies operating under the FXOpen brand, nor is it to be considered financial advice.
Crypto Market Frightened by Calm
Market Overview
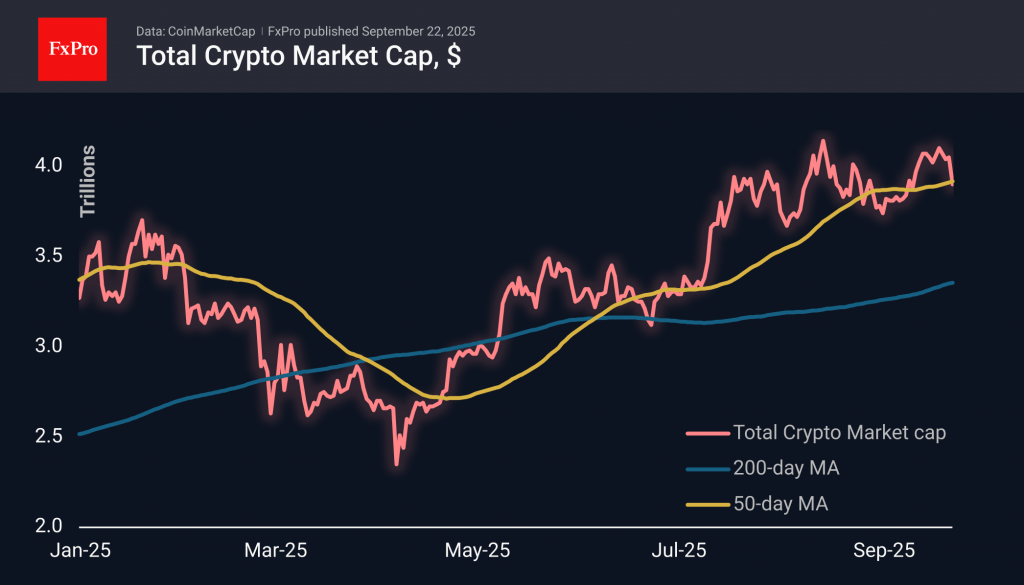
The crypto market capitalisation plummeted below $3.9 trillion on Monday morning, which is 4% lower than the previous day. Among the top altcoins, Bitcoin is losing less than others, while SushiSwap (-13%) and Dogecoin (-11%) lead the list of outsiders. This contrasts with gold hitting new highs and silver surging since the morning, indicating investors’ appetite for safe-haven assets after a period of low volatility.
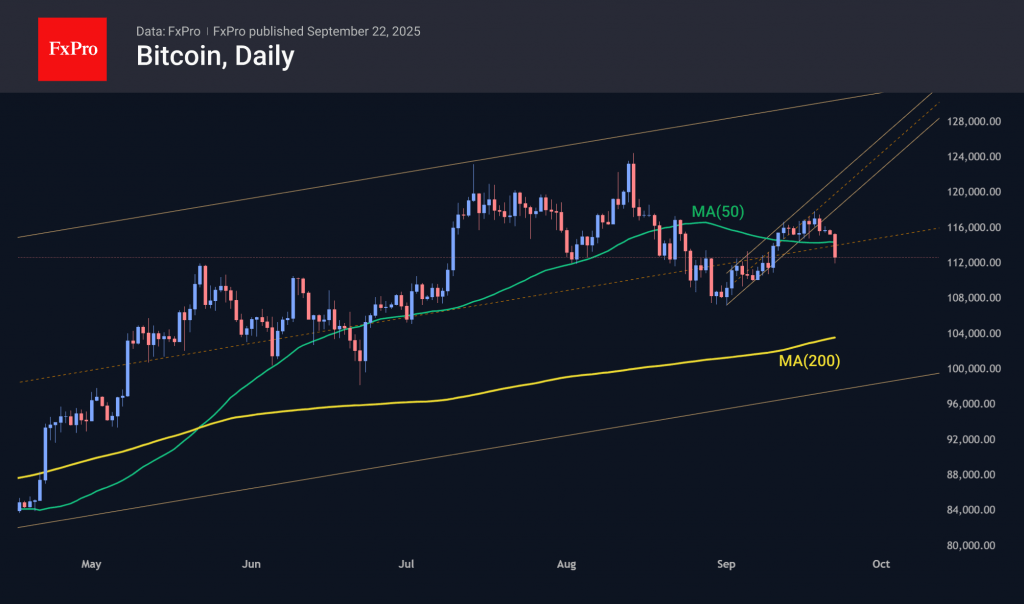
On Monday, Bitcoin broke through support near $115K, which bears had been trying to push through since 13 September. In recent days, there have been several signals of a shift to a downward trend in the first cryptocurrency. BTCUSD fell out of the upward channel that had been in place since early September, dropped below horizontal support and fell sharply below the 50-day moving average. This combination of negative signals suggests a further decline is likely unless there is a fundamental change in financial market sentiment.
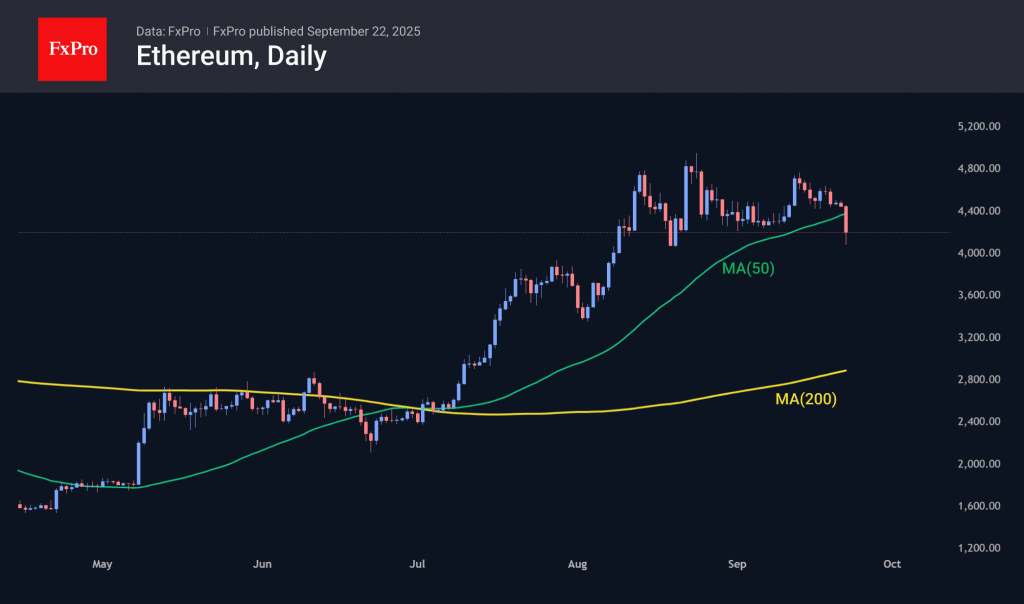
By the start of active trading in Europe, Ethereum had fallen to $4,000, starting the day at $4,500. The price broke through the 50-day moving average for the first time since early July — an alarming technical warning, as the second-largest cryptocurrency fairly accurately reflects signals from the intersection with this curve.
News Background
According to SoSoValue, net weekly inflows into spot BTC ETFs fell to $886.7 million, remaining quite impressive. Cumulative inflows since the approval of Bitcoin ETFs in January 2024 have increased to $57.72 billion.
Inflows into spot Ethereum ETFs in the US fell to $556.9 million, bringing cumulative inflows since July 2024 to $13.92 billion.
According to Glassnode, the share of the first cryptocurrency held by hodlers for more than seven years reached a record 14.3 million BTC, up 3% since the beginning of the year and reflecting growing confidence in Bitcoin’s prospects.
According to a survey by the MEXC crypto exchange, the share of investors using cryptocurrencies to hedge against inflation rose from 29% to 46% in the second quarter. Macroeconomic instability, weakening national currencies, and inflationary pressures are forcing people worldwide to look for alternative ways to preserve the value of their savings.
ETH developers said the Fusaka hard fork will be launched on the Ethereum mainnet on 3 December after a series of deployments on the Holesky, Sepolia, and Hoodi testnets. A key improvement will be the introduction of the PeerDAS protocol, which could double the network’s throughput.
RBA’s Bullock Says Inflation Under Control, Aussie Steady
The Australian dollar is coming off its best week since July, with gains of close to 1%. In Monday's European session, AUD/USD is trading at 0.6589, down 0.07% on the day.
Bullock says inflation in good place but China a concern
RBA Governor Bullock testified before a parliamentary committee on Monday. Bullock said that inflation was in a "very good position" as higher interest rates had curbed demand. Still, she warned that there inflation risks remained on "both sides".
Bullock was less positive about the geopolitical environment, warning that the significant change in the global trading system which had created massive uncertainty. The Reserve Bank was particularly concerned about the impact of US tariffs on China, Australia's largest trading partner.
Bullock warned that the financial markets had not priced in the risks of the tariffs, which could affect financial stability if the the domstic economy was significantly affected by the tariffs.
The RBA is expected to hold the cash rate at 3.6% at next week's meeting, after lowering rates by a quarter-point in August. The markets have priced in a 10% likelihood of a rate cut at the upcoming meeting, with an 86% likelihood of a cut in November.
Investors eye Fedspeak
There are no US economic releases today but investors will be keeping a close eye on Fedspeak, with five FOMC members scheduled to deliver public remarks. New Fed Governor MIran, who voted for a 50-bp cut at the September 17 meeting, is expected to give a detailed explanation of his view in today's speech.
At last week's meeting, the Fed signaled that more rate cuts were coming and the markets have priced in an October cut at 90%, according to CME's FedWatch. The Fed appears to have shifted to a more dovish stance after maintaining rates since December 2024 until lowering rates last week.
AUD/USD Technical
- AUDUSD tested support at 0.6589 and 0.6580 earlier. Next, there is support at 0.6567
- There is resistance at 0.6602 and 0.6611
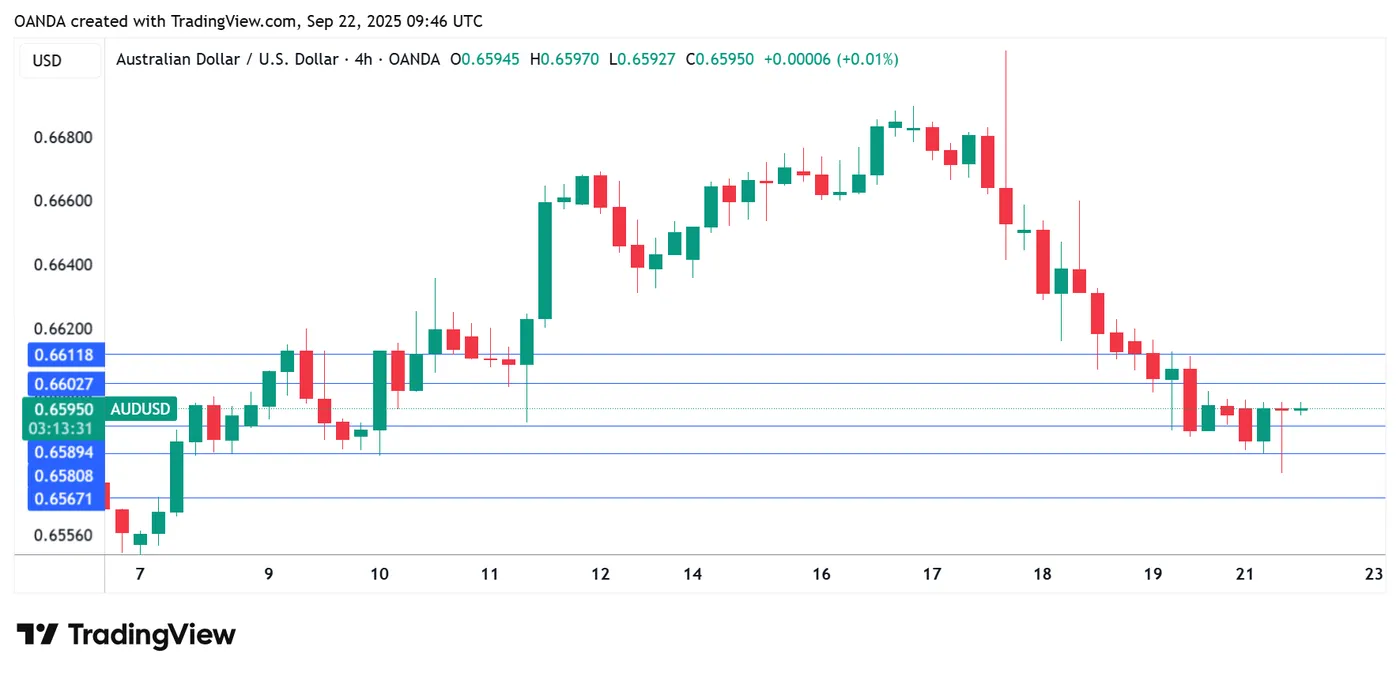
AUDUSD 4-Hour Chart, September 21, 2025
USD/JPY Soars as Yen Weakens on BoJ Policy Concerns
The USD/JPY pair climbed to 148.31 on Monday, extending its gains from the previous week as the US dollar strengthened across the board. The yen faced additional pressure from heightened anticipation around upcoming comments from Federal Reserve officials and the release of critical US inflation data.
Last week, the Federal Reserve delivered a widely expected 25-basis-point cut – its first since December. The central bank's projections indicated two further reductions before the end of the year.
This contrasts sharply with the Bank of Japan's (BoJ) stance. Last Friday, the BoJ held its key rate at 0.5% per annum for a fifth consecutive meeting, a decision that was squarely in line with market forecasts. In its accompanying statement, the central bank described a moderate economic recovery but pointed to persistent weak spots and warned of risks stemming from global trade policy.
In a more significant step, the regulator unanimously approved plans to begin selling ETFs and J-REITs from its vast portfolio. This detail is particularly noteworthy and can be interpreted as a cautious signal that the bank is preparing to wind down its long-standing asset purchase program.
This week, investor focus will shift to the latest PMI data and inflation figures for Tokyo, alongside the release of the minutes from the BoJ's July meeting. These documents may provide crucial insights into the timing and nature of the regulator's next policy steps.
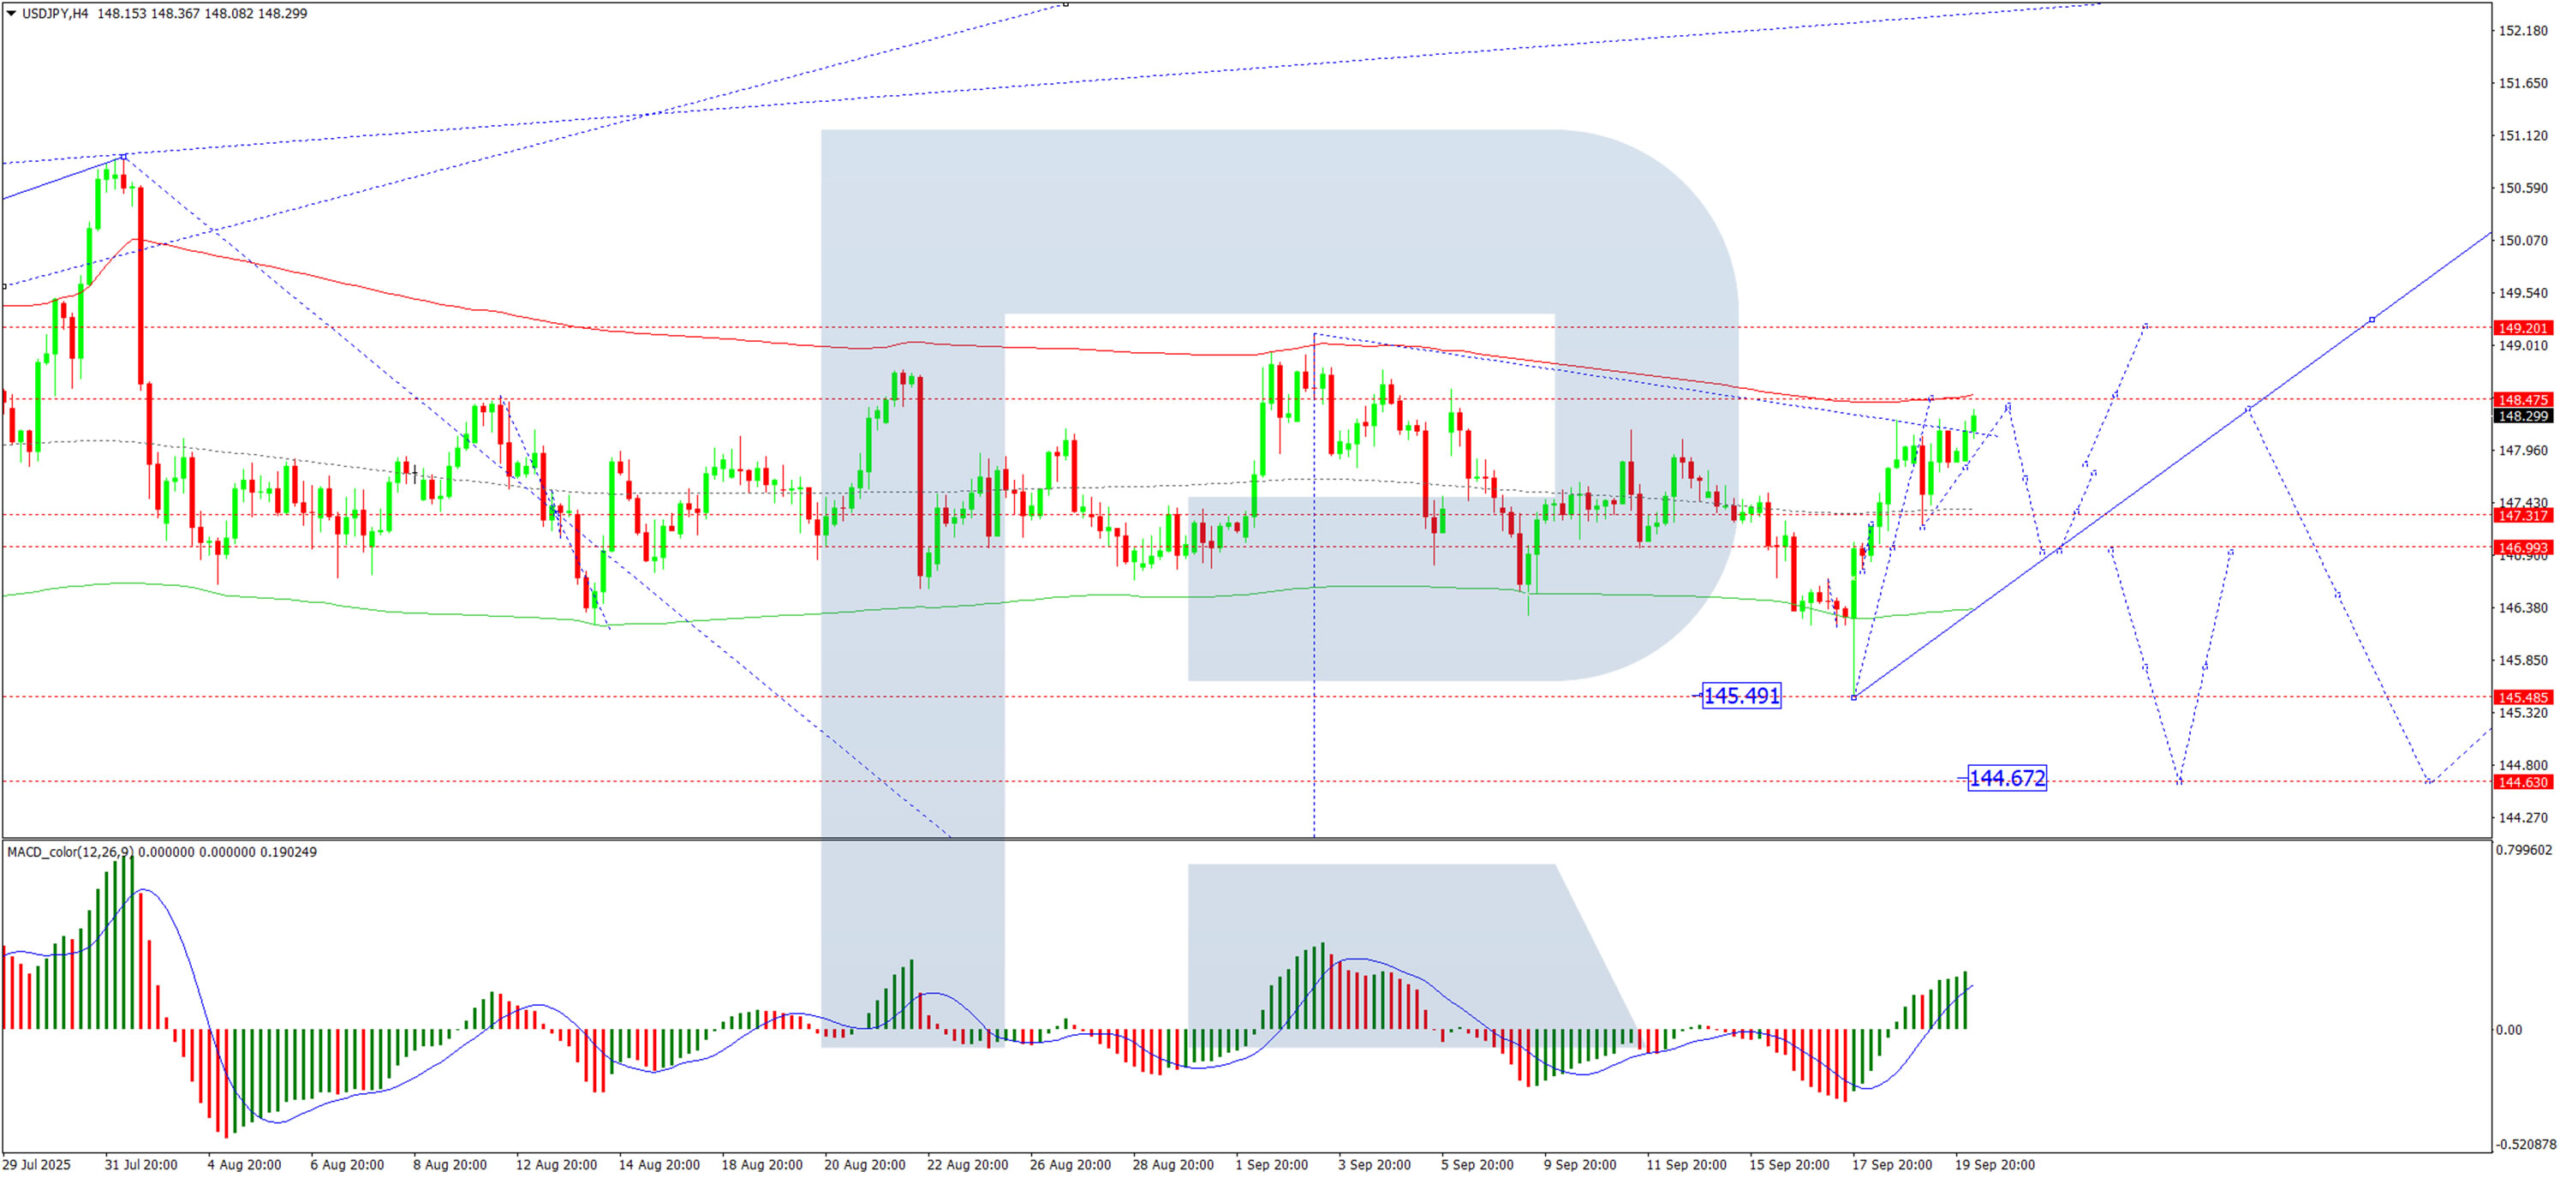
Technical Analysis: USD/JPY
H4 Chart:
On the H4 chart, USD/JPY found solid support at the 147.20 level and is now developing a fresh upward move targeting 148.88. We expect this target to be tested today. Following this, a corrective pullback towards 147.20 is likely. Following this correction, we anticipate another upward move aiming for the 150.00 psychological level. This outlook is technically confirmed by the MACD indicator, whose signal line is positioned above zero and pointing sharply upwards.
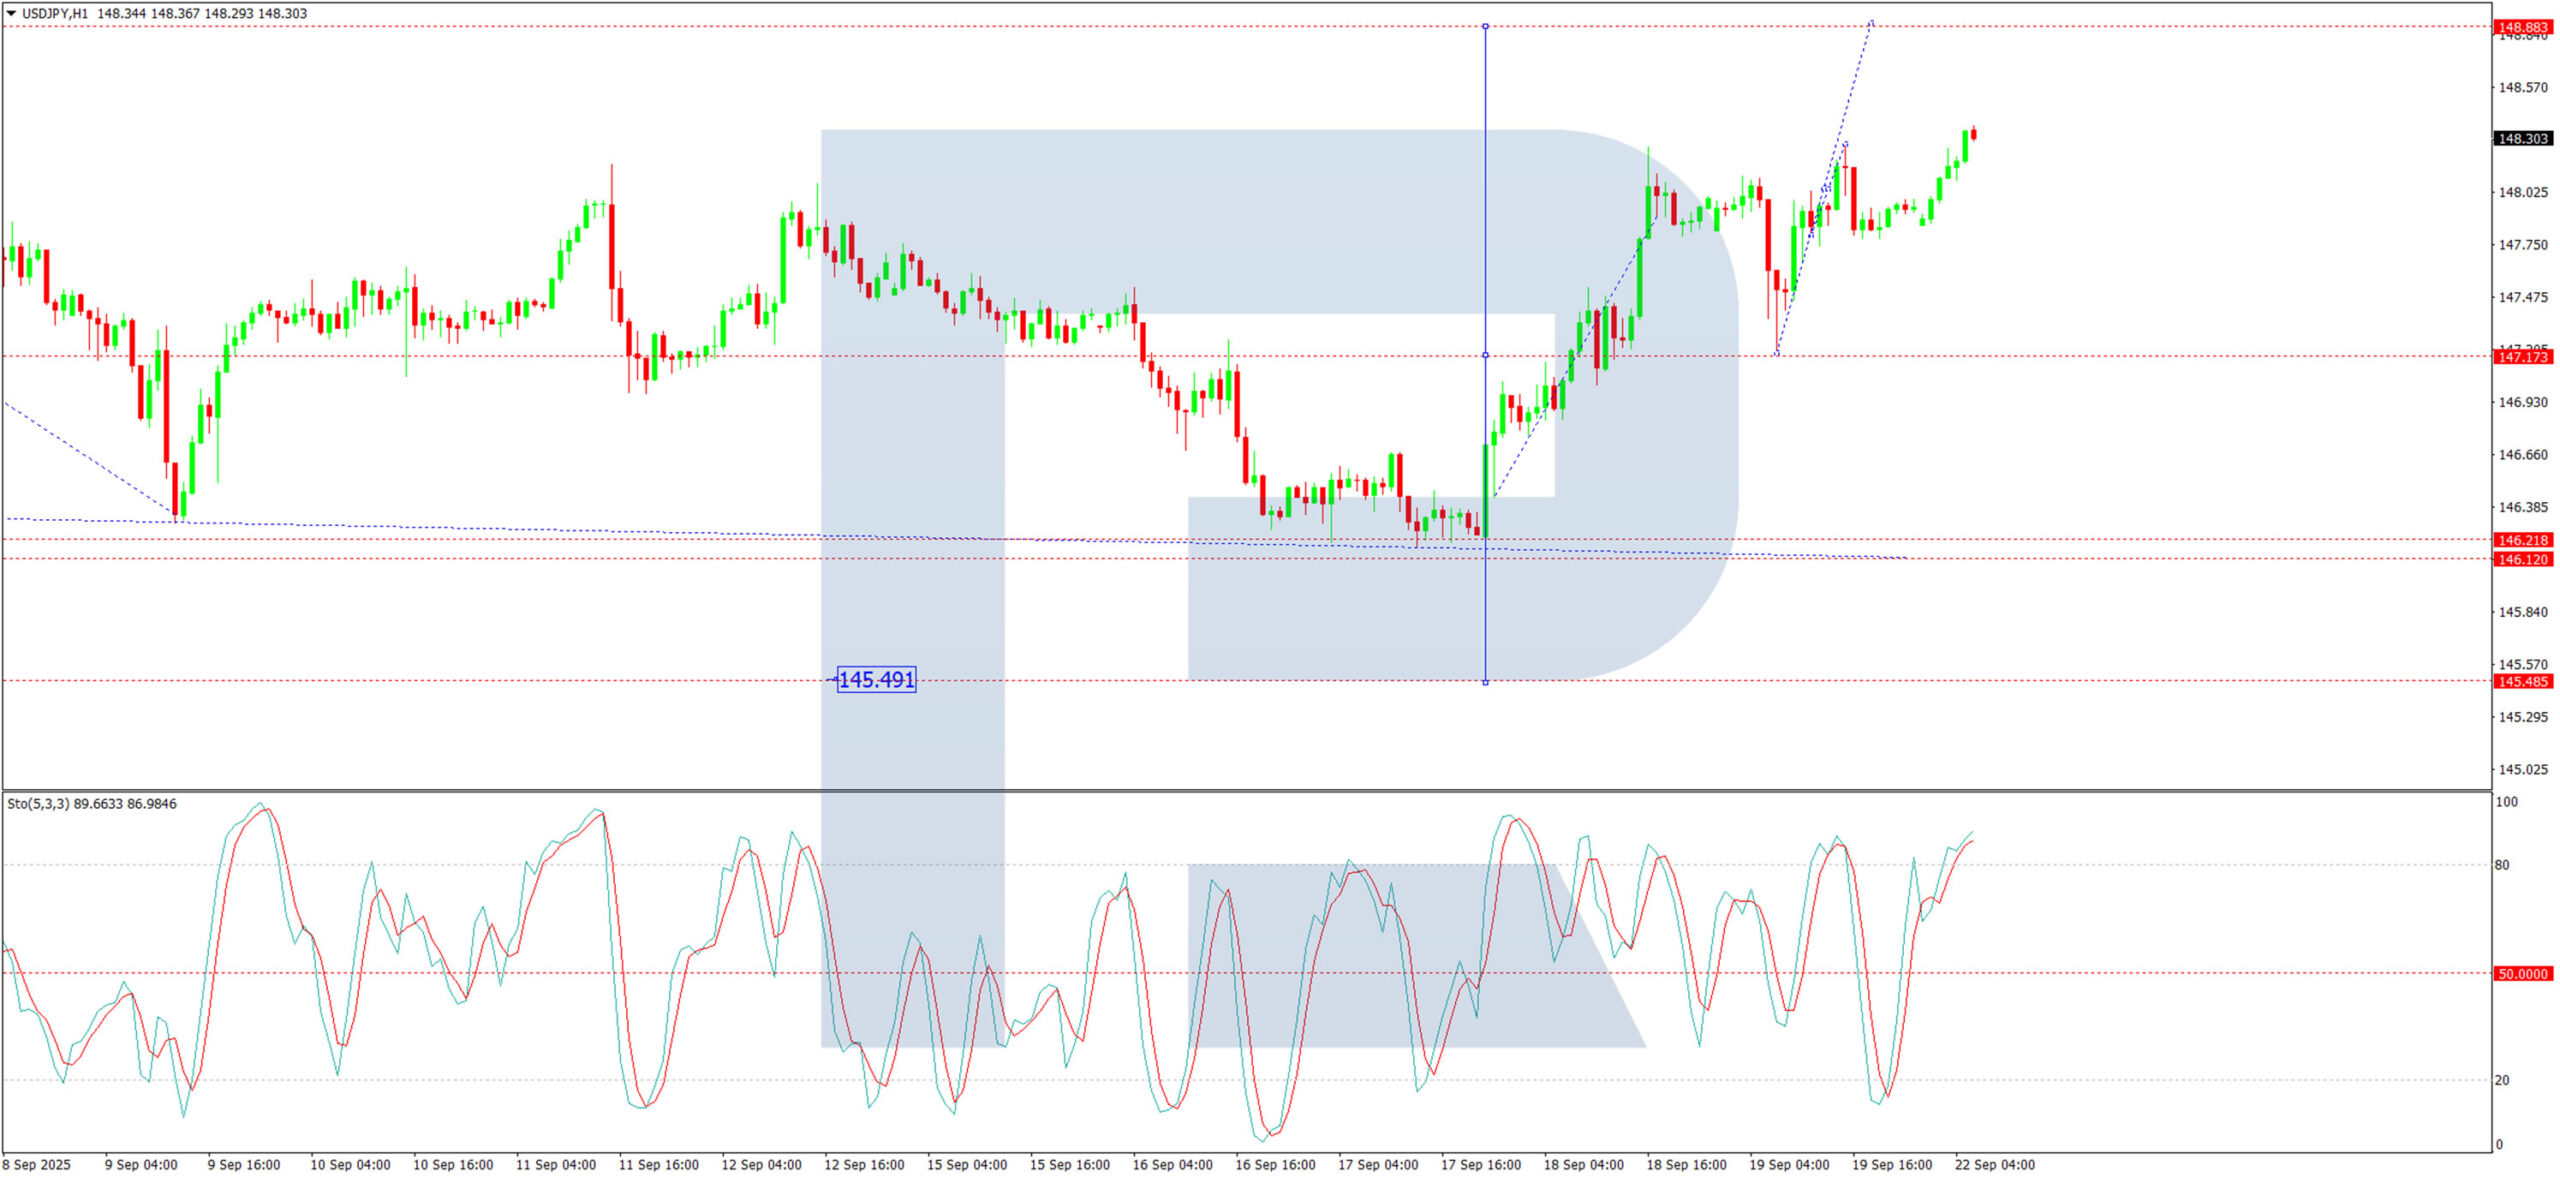
H1 Chart:
The H1 chart shows the pair completed an upward move to 148.23, followed by a correction to 147.20. The current momentum is building for a further advance towards 148.88. Upon reaching this level, a corrective pullback towards 147.20 is possible. The broader upward trajectory is then expected to resume, with a minimum target of 150.00. This scenario is supported by the Stochastic oscillator, with its signal line currently above 50 and rising firmly towards the 80 level.
Conclusion
The yen remains under significant pressure, caught between a resilient US dollar and the Bank of Japan's cautious, gradual approach to policy normalisation. The path of least resistance for USD/JPY remains higher, contingent on this week's key data releases reinforcing the current fundamental and technical picture.