Sample Category Title
Fed Cuts 0.25%, BoJ ETF Sale Shocks Market, U.S. Stocks Hit Records
Markets moved sideways early in the week as traders waited for key central bank decisions. U.S. retail sales were stronger than expected, while U.K. inflation stayed high at 3.8%. The Bank of England met first, kept rates unchanged as expected, and said any future cuts would depend on clear signs that inflation is falling steadily.
The U.S. Federal Reserve then cut interest rates by 0.25% and suggested there could be two more cuts before the end of 2025. The Fed noted slower job growth and a weaker labor market but also said inflation is still somewhat high. The U.S. dollar dipped at first but soon recovered, finishing the week strong. U.S. stock markets hit new record highs, helped by the rate cut and strong gains in technology shares.
The Bank of Japan also kept rates unchanged but surprised markets by saying it will slowly start selling some of its large holdings of exchange-traded funds (ETFs) and real estate trusts (J-REITs). The Nikkei index fell briefly but rebounded after the BoJ promised the sales would be very gradual. Two board members voted for a 0.25% rate hike, and Governor Kazuo Ueda said gradual tightening is possible if the economy and inflation stay on track, leading markets to expect a possible rate increase later this year.
Markets This Week
U.S. Stocks
U.S. equities saw profit-taking early last week ahead of the FOMC announcement, but the selling was brief as buyers stepped in near the 10-day moving average. The Dow then climbed to fresh record highs after the Fed’s 0.25% rate cut and guidance for two more cuts in 2026. With the FOMC maintaining a bullish tone, the uptrend has resumed, making buying on dips toward the 10-day moving average the preferred strategy. Key resistance is now at 46,500, 47,000, and 48,000, while support lies at 45,700, 45,000, 44,000, and 43,000.
Japanese Stocks
The Nikkei 225 surged after the FOMC announcement, extending its recent strong gains. However, the Bank of Japan’s surprise plan to begin selling its ETF and J-REIT holdings caused a sharp drop on Friday before the market recovered into the close. With the BoJ moving closer to a possible rate hike and starting asset sales, further gains may be harder to achieve, so a sideways-to-lower move is expected this week. Resistance is at 46,000円 and 47,000円, while support is at 45,500円, 45,000円, and 44,000円.
USD/JPY
USD/JPY again tested the lower end of its recent range last week after the U.S. rate cut and dovish comments from Fed Chair Powell. Surprisingly, strong support held near 146, and the pair finished the week firmly as the market had been positioned for deeper losses. The rebound is notable and could attract more buying this week, but range trading between 146 and 149 remains the preferred strategy. Key resistance is at 148, 149, and 150, with support at 146 and 145.
Gold
Gold had a volatile week, posting new record highs again after the U.S. interest rate cut. The uptrend remains very strong, with prices holding above the 10-day moving average as buyers stay aggressive. In the short term, following the uptrend can be profitable, but waiting for a break below the 10-day moving average to sell may offer the best near-term trading opportunity given how far the market has already climbed. Resistance is at $3,700 and $3,800, while support stands at $3,600, $3,500, and $3,450.
Crude Oil
WTI crude stayed under pressure last week, failing to hold above the key $65 level after an early rise. Concerns about a slowing U.S. economy and the potential for weaker demand kept sellers in control, limiting any upward momentum. For short- and medium-term traders, selling into strength or waiting for a decisive break below $60 remains the preferred strategy as the market struggles to find support. Key resistance is at $65, $70, and $75, while support is at $60 and $55.
Bitcoin
Bitcoin had a quiet week, consolidating earlier gains and briefly rising on the U.S. interest rate cut before sellers pushed prices back below the 10-day moving average, signaling an end to September’s uptrend. The market is now expected to test lower and provide range-trading opportunities between $112,000 and $120,000 in the near term. Key levels remain unchanged, with resistance at $120,000, $125,000, and $150,000, and support at $112,000, $105,000, and $100,000.
This Week’s Focus
- Monday: U.K. BoE Gov Bailey Speaks
- Tuesday: E.U. HCOB Eurozone Manufacturing PMI, U.K. S&P Global Manufacturing PMI, U.S. Current Account and S&P Global Manufacturing PMI
- Wednesday: Japan au Jibun Bank Services PMI and BoJ Core, U.S. Building Permits and New Home Sales
- Thursday: Japan Monetary Policy Meeting Minutes, U.S.Initial Jobless Claims, Durable Goods Orders, GDP and Existing Home Sales
- Friday: Japan Tokyo Core CPI, U.S. Core PCE Price Index and Michigan Consumer Sentiment
This week the market will continue to forecast the next moves in U.S. and Japanese interest rates as traders digest last week’s central bank meetings. A busy economic calendar includes manufacturing data from Europe, the U.K., and the U.S., with Thursday’s U.S. durable goods orders and GDP, and Friday’s U.S. Core PCE Price Index and Michigan Consumer Sentiment all likely to create volatility and trading opportunities. FX markets remain range-bound but look ready for a breakout, while traders will watch closely to see if equities and gold can extend their strong uptrends.
GBP/USD: Cable Bears Face Headwinds from Daily Cloud Top
Cable remains in a step fall from last Wednesday’s 2 ½ month peak (1.3725) which has so far retraced over 61.8% of recent 1.3333/1.3725 rally and cracked next significant support at 1.3465 (daily cloud top).
Pound was initially hit by stronger dollar after Fed disappointed expectations for keeping very dovish stance, with signals from BoE Governor for possible further rate reductions, boosting bears on Thursday, while Friday’s unexpectedly high rise in UK borrowing sparked fresh acceleration lower.
Technical studies weakened on daily chart, with the pair being on track for weekly close in red (potential formation of bearish engulfing and long upper shadow on weekly candle add to negative signals).
On the other hand, daily cloud top offers solid support, which may hold bears for some time, with limited upticks to be capped under 1.3530 (daily Kijun-sen / broken Fibo 50%) to offer better selling levels and keep bears in play.
Res: 1.3500; 1.3530; 1.3559; 1.3575
Sup: 1.3465; 1.3426; 1.3397; 1.3333
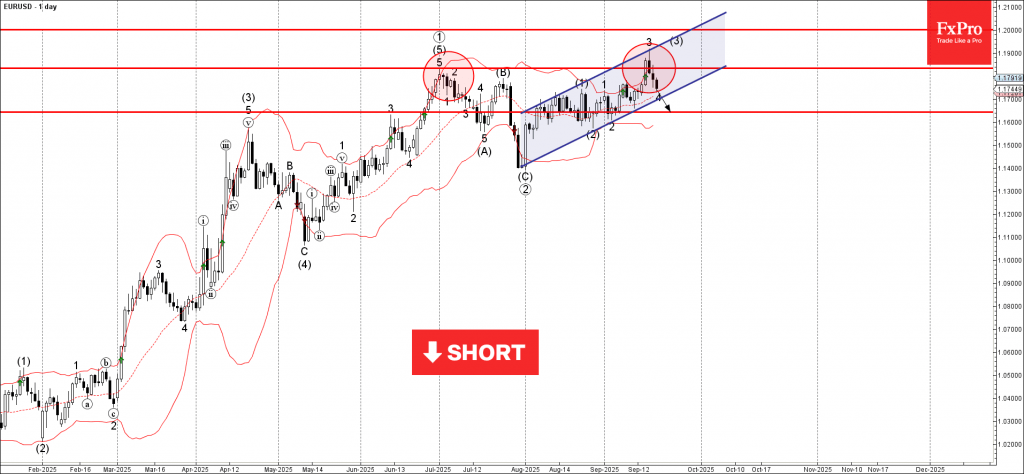
EURUSD Wave Analysis
EURUSD: ⬇️ Sell
- EURUSD reversed from resistance zone
- Likely to fall to support level 1.1640
EURUSD currency pair recently reversed down from the resistance zone between the resistance level 1.1835 (former multi-month high from June), upper daily Bollinger Band and the resistance trendline of the daily up channel from July.
The downward reversal from this resistance zone started the active minor correction 4.
Given the strongly bullish US dollar sentiment seen across the FX markets, EURUSD currency pair can be expected to fall to the next round support level 1.1640.
Everybody Happy? Fed’s Decision Calms Markets—for Now
The past week has been anything but quiet for global markets. A long-anticipated Fed rate cut finally arrived, but the message was less dovish than traders had braced for. Instead, policymakers struck a balance — restarting the easing cycle while simultaneously projecting confidence in the economy’s resilience. That left investors reassured. Equities cheered the outcome, with all three major U.S. indices printing record closes. Bond yields swung sharply before settling higher, while Dollar staged an equally forceful rebound from the week’s lows.
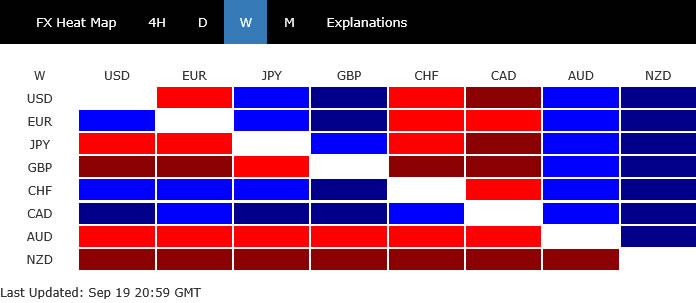
The foreign-exchange market told its own story. By week’s end, Loonie surprisingly sat at the top of the performance ladder, joined by Swiss Franc and Euro. The strength of the Loonie was especially striking, coming despite a widely anticipated BoC rate cut. Solid August retail sales estimates pointed to a Q3 rebound, keeping expectations of further BoC easing measured.
At the other end of the scale, Kiwi was crushed after a shocking Q2 GDP contraction. Traders are now openly speculating about a 50bps RBNZ cut in October, with the policy rate potentially falling below the Bank’s own year-end estimate. Aussie fared little better, weighed down by poor August jobs data and a growing consensus that November will bring another RBA rate cut.
Sterling also struggled, with the BoE holding steady but showing a slightly more dovish split. Euro and Franc were firmer in crosses, yet their momentum against Dollar faded quickly after the Fed’s rebound. Meanwhile, Yen was caught in a tug-of-war: boosted by hawkish dissenters at the BoJ, but capped by rebounding U.S. yields and relentless U.S. equity strength.
Fed’s Balanced Cut Signals Confidence, Not Capitulation
The highly anticipated FOMC decision did not disappoint investors. The Fed lowered federal funds rate by 25bps to 4.00–4.25%, restarting its easing cycle after holding policy steady for much of the year. The overall tone of the announcement leaned less dovish than markets had hoped. Still, equities, bonds, and Dollar responded constructively, showing that the outcome struck a balance that reassured all sides.
What stood out was Chair Jerome Powell’s characterization of the move as a “risk management” cut rather than an emergency measure. This distinction signaled confidence in the underlying strength of the U.S. economy and underlined that the Fed is not panicking in the face of softer labor data and tariff uncertainty. For investors, that was an important reassurance.
The decision was accompanied by a clear signal that policymakers still see two more cuts this year, in October and December. That aligns closely with market pricing, reinforcing the idea that monetary policy is easing in a measured, predictable fashion rather than an abrupt pivot.
Projections offered additional comfort. The Fed nudged its GDP forecasts higher across the projection horizon, with growth now seen at 1.6% in 2025, 1.8% in 2026, and 1.9% in 2027. Unemployment forecasts were revised lower, pointing to a more resilient labor market than previously thought. Together, these revisions suggest policymakers believe the economy can withstand the tariff shock and still maintain positive momentum.
Inflation forecasts were also adjusted only slightly, with 2026 core PCE raised to 2.6% from 2.4% on the view that tariff effects could linger. Crucially, the longer-run trajectory remains anchored around the 2% target, and the shallow upward tweak was viewed as temporary rather than destabilizing.
On the rate path, the overall picture was modestly softer. The Fed now projects one additional cut in 2026 and another in 2027, lowering the terminal policy rate to 3.1%. That remains just above the longer-run neutral estimate of 3.0%, underscoring that policymakers still see policy ending in slightly restrictive territory rather than slipping into excessive accommodation.
Equally significant was the voting composition. Newly confirmed Governor Stephen Miran dissented in favor of a larger 50bps cut, but even well-known doves Christopher Waller and Michelle Bowman supported the 25bps move. This alignment suggests that the decision was broadly supported across the Committee, and that the Fed is maintaining institutional discipline rather than bending to political pressure.
The optics matter. After months of speculation that the Trump administration could force the Fed into more aggressive easing, the outcome showed no evidence of interference. Instead, the vote and dot plot highlighted an independent central bank weighing risks carefully and arriving at a balanced decision.
For markets, this combination of gradual easing, stronger growth projections, and a reaffirmation of Fed independence was almost the ideal mix. Risk assets surged, bond yields rebounded, and Dollar found a floor. The sense was that monetary policy is flexible enough to manage risks while still anchored by confidence in the broader economy.
All told, the decision was received as a pragmatic and measured step. It reminded markets that the Fed is easing, but not capitulating, and that growth and employment prospects remain intact. In that sense, the announcement made “everybody happy”—a rare outcome in today’s polarized policy environment.
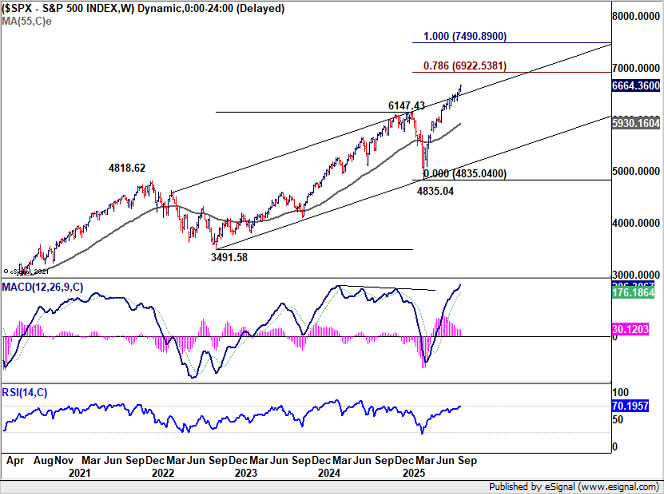
S&P 500 Breaks Higher Eyes Extension Toward 6920 in Q4
S&P 500 closed at a fresh record high after the Fed’s decision, extending an already powerful run in U.S. equities. The index gained ground in tandem with the NASDAQ and DOW.
Technically, Daily MACD has broken above its falling trend line, a sign buying momentum is regathering after a period of consolidation. This comes on top of sustained trading above the long-term channel ceiling on the weekly chart, which continues to reinforce the broader bullish structure.
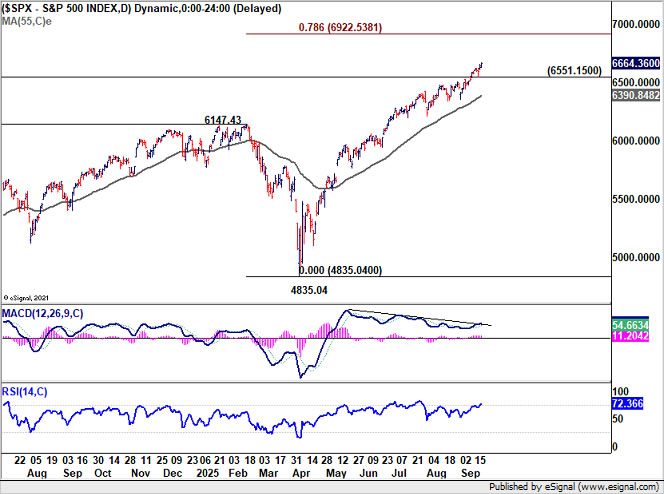
With that backdrop, the S&P 500’s current rise looks on course for 78.6% projection of 3491.58 to 6147.43 from 4835.04 at 6922.53 in Q4.
Nevertheless, firm break of 6551.15 support would indicate that near-term momentum has stalled. Such a pullback would not imply a topping pattern, but rather a transition to a slower, more natural pace of gains rather than the rapid upside bursts seen this week.
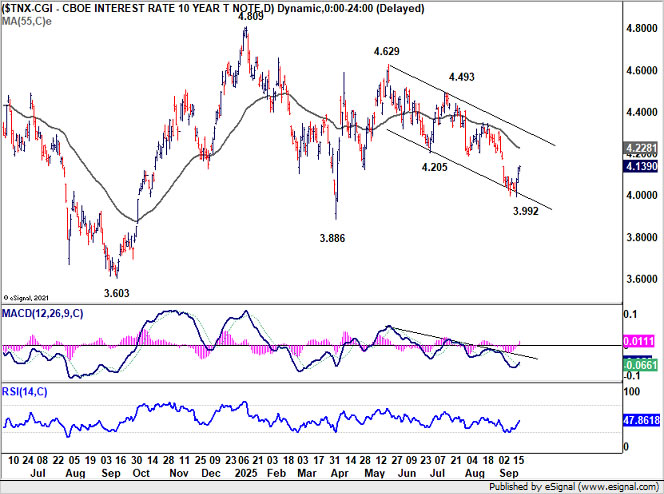
10-Year Yield Rebounds After Finding Support at 4%
U.S. Treasury yields responded decisively to the Fed’s policy shift, with the 10-year climbing to 4.139, its highest close in two weeks. The move was particularly notable given that the benchmark had briefly slipped below 4% psychological level earlier in the week. That level is should now be being recognized as a near-term floor, with buyers reluctant to push yields much lower while the Fed’s easing path remains measured rather than aggressive.
Technically, D MACD has crossed above its signal line, confirming that downside momentum has eased and that a short-term bottom was formed at 3.992. This pivot was also supported by the falling channel floor. With that base in place, further recovery toward 55 D EMA (now at 4.228) is in favor. Nevertheless, strong resistance should be seen above there to limit upside.
Meanwhile, as the US economy is expected to retain resilience even under a measured easing cycle, it's unlikely for yield to collapse. That backdrop leaves the 10-year in a consolidation phase rather than a one-way trend. Another downside attempt cannot be ruled out, but any move lower is likely to be contained by 3.992 low. Sideways trading in a 4.0–4.25% band could define the near-term range until incoming data challenge the Fed’s forecasts.
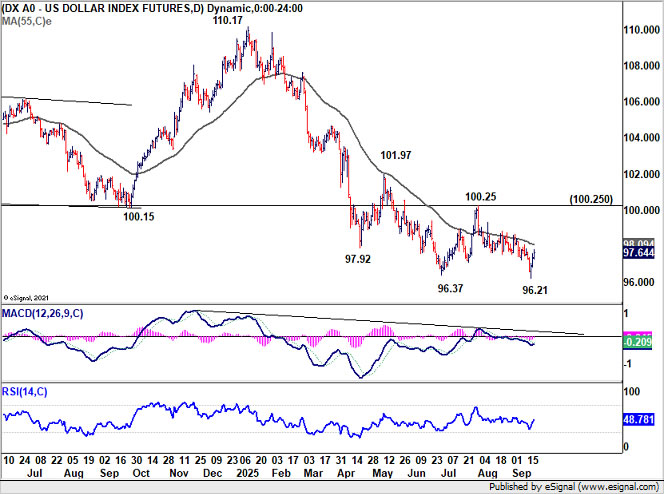
Dollar Index Rebounds Post-Fed, Long-Term Channel Support Intact
Dollar Index staged a strong rebound alongside U.S. yields, shaking off the heavy tone that had dominated in early part of the week.
The broader context is important and shouldn't be ignored. DXY remains perched just above the long-term channel floor that has defined its uptrend since 2008. That structural support matters: rebounds from these levels are common, even if they ultimately resolve into consolidations rather than new bull runs.
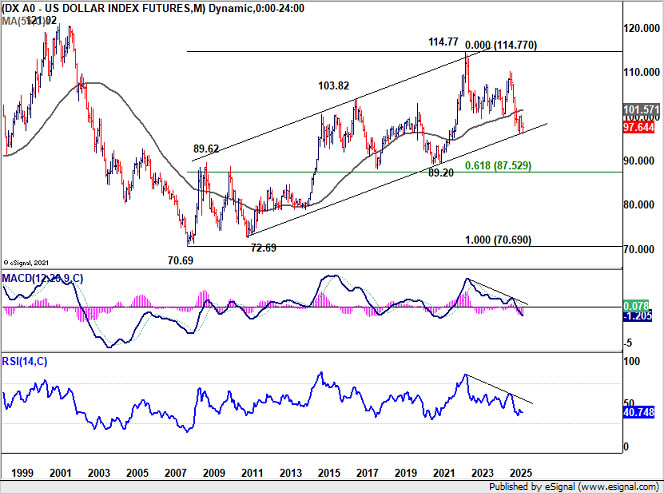
Zooming into the near-term picture, the Index breached 96.37 briefly to 96.21, only to recover sharply. Focus now shifts to 55 D EMA (currently at 98.09). Decisive break there would confirm short-term bottoming at 96.21 and open the path to higher levels.
The first upside marker in such a scenario would be 100.25, a resistance level that represents a natural test of the rebound’s durability. Even under the most conservative interpretation — treating the recovery as just the third leg of a sideway consolidation pattern from 96.37 — that level should be achievable.
More bullish interpretations are also possible. The rebound could evolve into a correction of the whole fall from 110.17, or even the beginning of a reversal of the entire decline from the 2022 high at 114.77. Such outcomes, however, hinge heavily on whether incoming data validate the Fed’s current projections of shallow easing and resilient growth. Until then, Dollar Index remains in a state of cautious, near term recovery first.
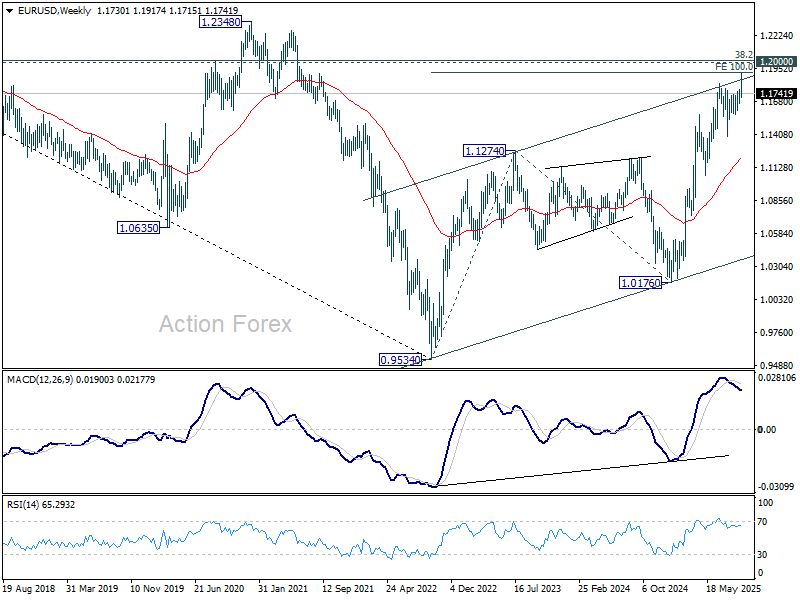
EUR/USD Weekly Outlook
A short term top should be formed in EUR/USD at 1.1917 with subsequent deep pullback. Initial bias is staying on the downside this week for 55 D EMA (now at 1.1653). Considering bearish divergence condition in D EMA, sustained break of 55 D EMA will argue that 1.1917 is already a medium term top. Deeper fall should then be seen to 1.1390 support next. On the upside, though, above 1.1847 minor resistance will retain near term bullishness and bring retest of 1.1917 high instead.
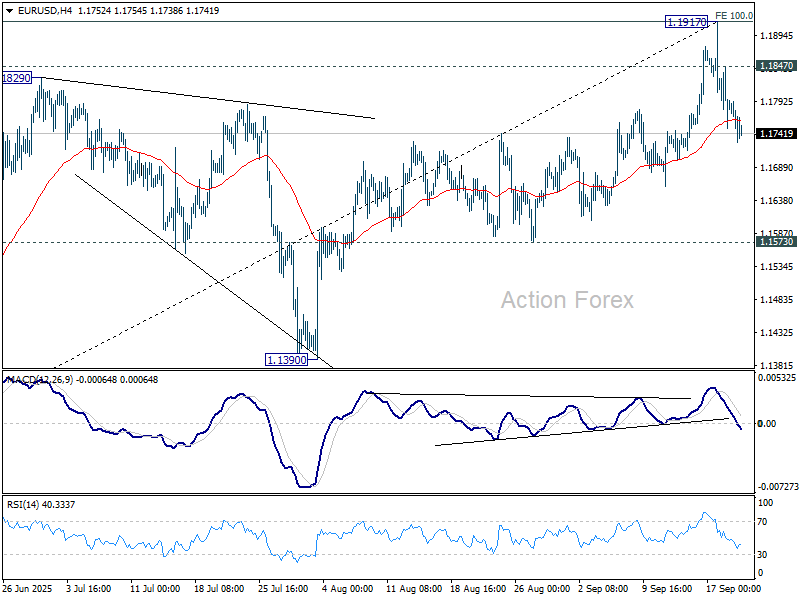
In the bigger picture, rise from 1.0176 (2025 low) is seen as the third leg of the pattern from 0.9534 (2022 low). 100% projection of 0.9534 to 1.1274 from 1.0176 at 1.1916 was already met. For now, further rally will remain in favor as long as 1.1390 support holds, and firm break of 1.2000 psychological level will carry larger bullish implications. However, firm break of 1.1390 will suggest that rise from 1.0176 has already completed and bring deeper fall to 55 W EMA (now at 1.1214).
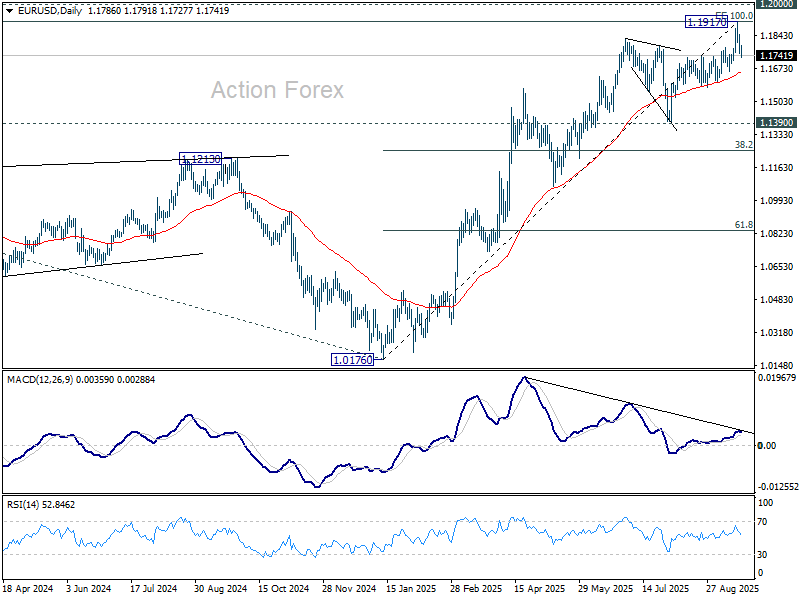
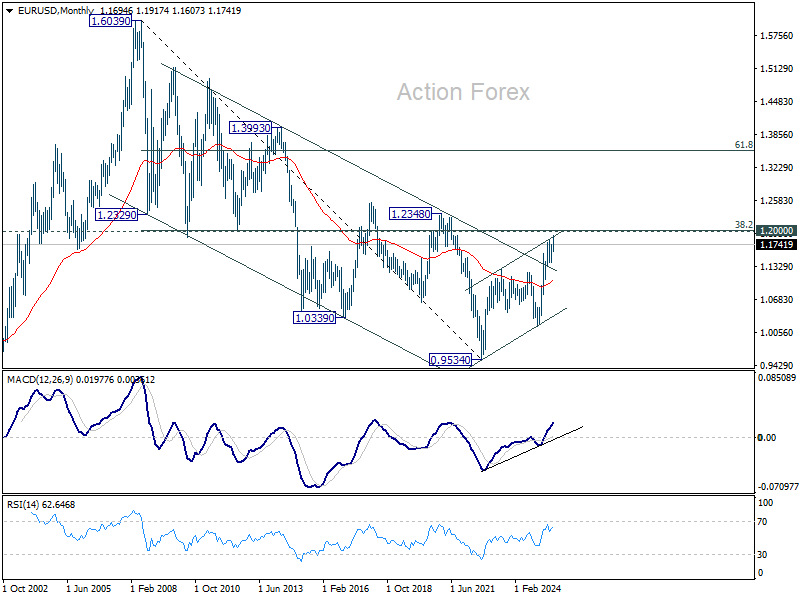
In the long term picture, 38.2% retracement of 1.6039 to 0.9534 at 1.2019, which is close to 1.2000 psychological level is the key for the outlook. Rejection by this level will keep the multi decade down trend from 1.6039 (2008 high) intact, and keep outlook neutral at best. However, decisive break of 1.2000/19, will suggest long term bullish trend reversal, and target 61.8% retracement at 1.3554.
EUR/USD Weekly Outlook
A short term top should be formed in EUR/USD at 1.1917 with subsequent deep pullback. Initial bias is staying on the downside this week for 55 D EMA (now at 1.1653). Considering bearish divergence condition in D EMA, sustained break of 55 D EMA will argue that 1.1917 is already a medium term top. Deeper fall should then be seen to 1.1390 support next. On the upside, though, above 1.1847 minor resistance will retain near term bullishness and bring retest of 1.1917 high instead.
In the bigger picture, rise from 1.0176 (2025 low) is seen as the third leg of the pattern from 0.9534 (2022 low). 100% projection of 0.9534 to 1.1274 from 1.0176 at 1.1916 was already met. For now, further rally will remain in favor as long as 1.1390 support holds, and firm break of 1.2000 psychological level will carry larger bullish implications. However, firm break of 1.1390 will suggest that rise from 1.0176 has already completed and bring deeper fall to 55 W EMA (now at 1.1214).
In the long term picture, 38.2% retracement of 1.6039 to 0.9534 at 1.2019, which is close to 1.2000 psychological level is the key for the outlook. Rejection by this level will keep the multi decade down trend from 1.6039 (2008 high) intact, and keep outlook neutral at best. However, decisive break of 1.2000/19, will suggest long term bullish trend reversal, and target 61.8% retracement at 1.3554.
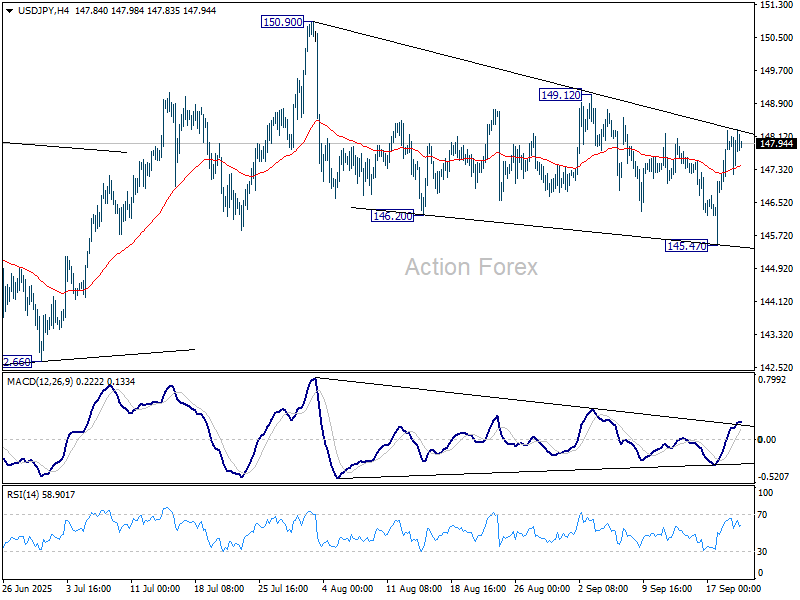
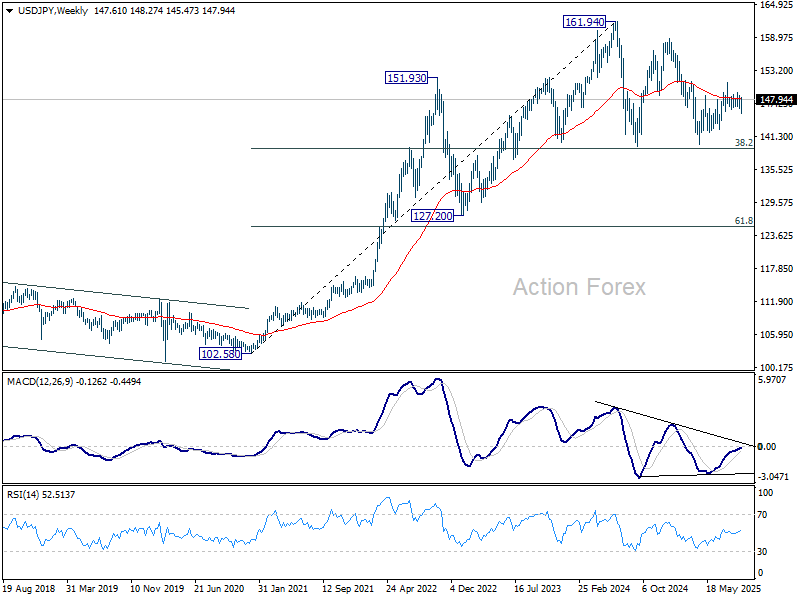
USD/JPY Weekly Outlook
USD/JPY rebounded stronger after initial dip to 145.47 last week. The development argues that rise from 139.87 might still be in progress. But as upside is capped below 149.12 resistance, initial bias stays neutral this week first. On the upside, break of 149.12 will bring stronger rally to retest 150.90 high. However, break of 145.47 will resume the fall from 150.90 instead.
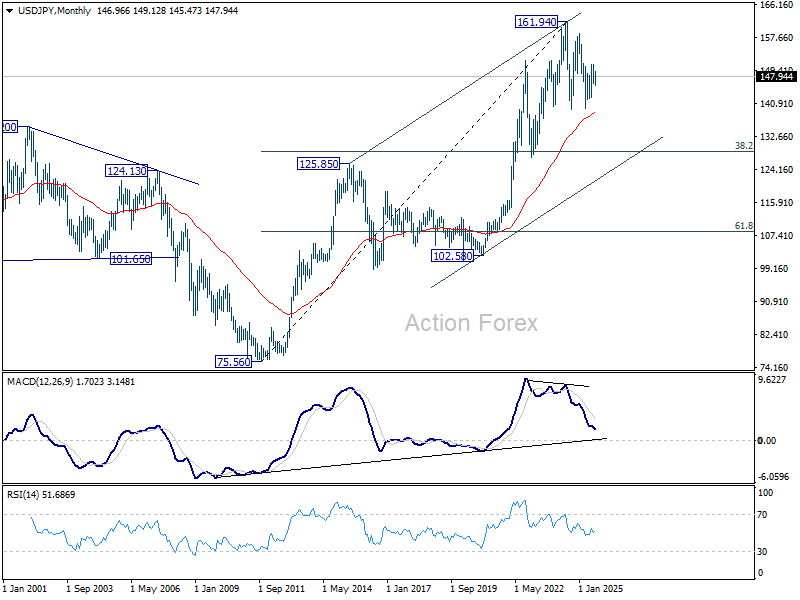
In the bigger picture, price actions from 161.94 (2024 high) are seen as a corrective pattern to rise from 102.58 (2021 low). Decisive break of 61.8% retracement of 158.86 to 139.87 at 151.22 will argue that it has already completed with three waves at 139.87. Larger up trend might then be ready to resume through 161.94 high. In case the corrective pattern extends with another fall, strong support is expected from 38.2% retracement of 102.58 to 161.94 at 139.26 to bring rebound.
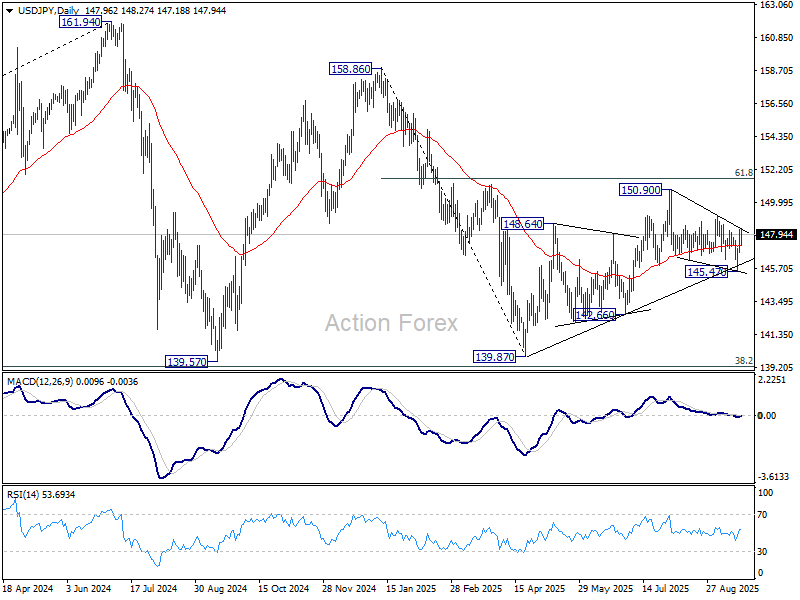
In the long term picture, there is no sign that up trend from 75.56 (2011 low) has completed. But then, firm break of 161.94 is needed to confirm resumption. Otherwise, more medium term range trading could still be seen.
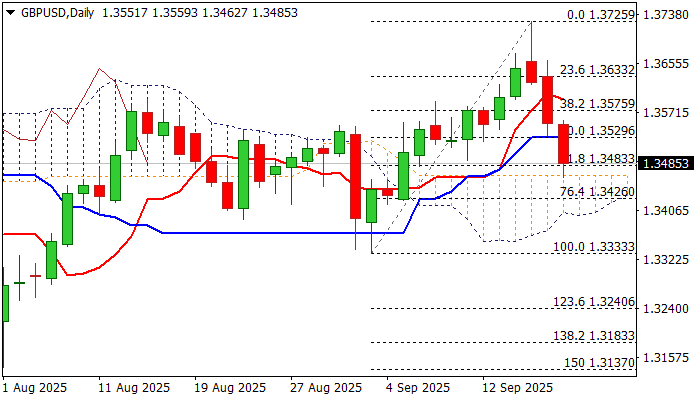
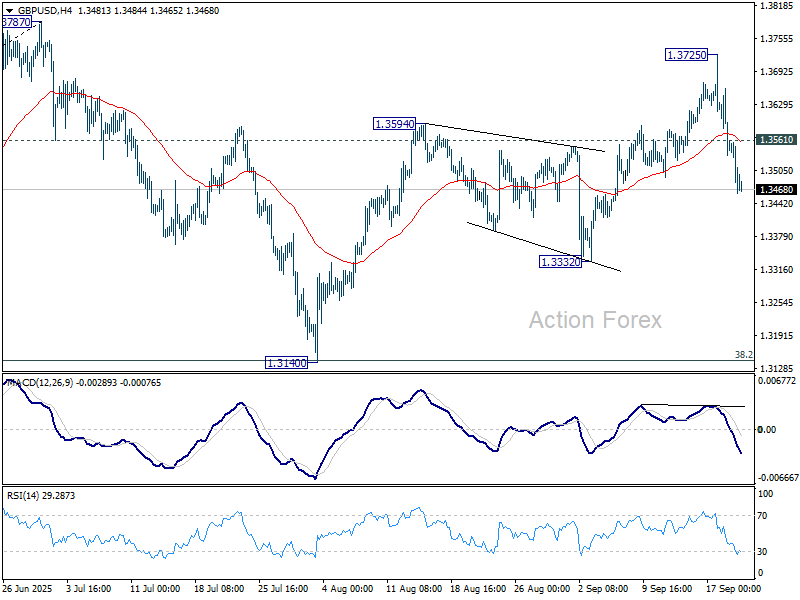
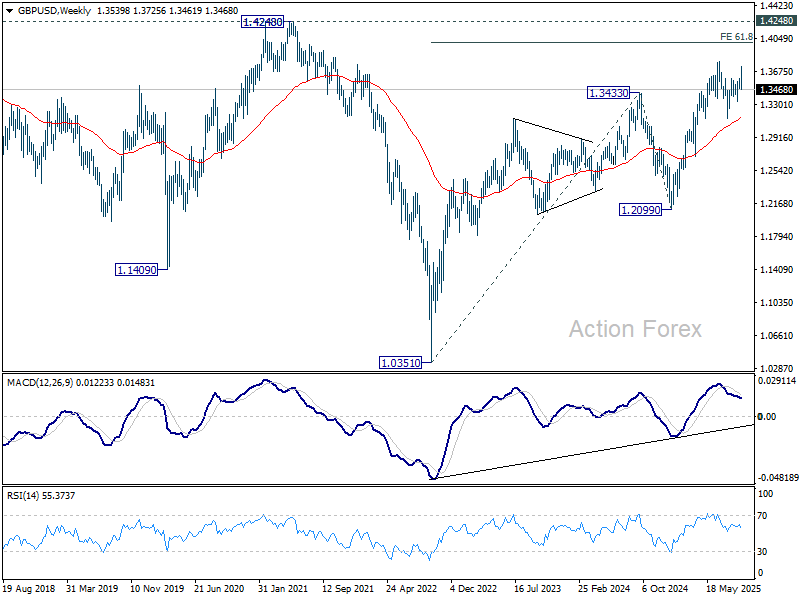
GBP/USD Weekly Outlook
GBP/USD spiked higher to 1.3725 last week but reversed from there. The development suggests that rebound from 1.3140 has completed, and corrective pattern from 1.3787 high is already in the third leg. Initial bias stays on the downside this week for 1.3332 support first. Break there will bring deeper fall to 1.3140. On the upside, though, above 1.3561 minor resistance will turn intraday bias neutral.
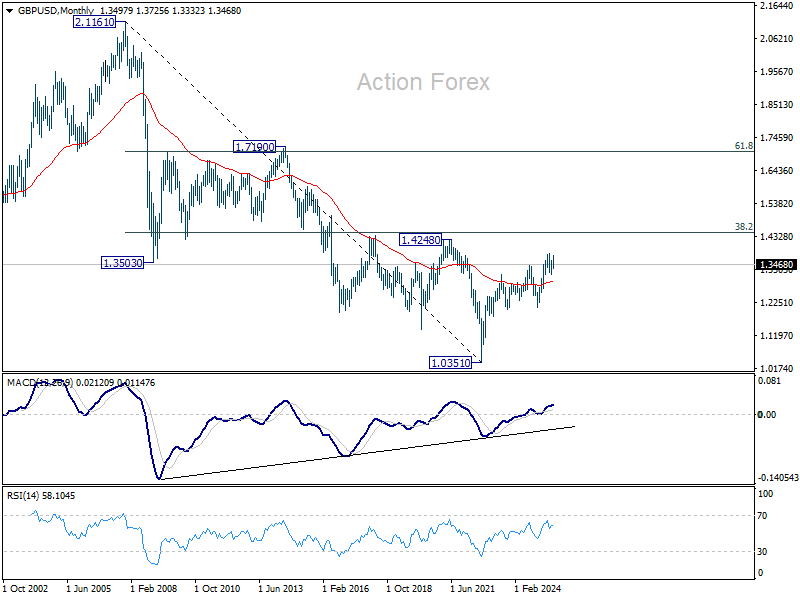
In the bigger picture, rise from 1.3051 (2022 low) is in progress, and would target 61.8% projection of 1.0351 to 1.3433 (2024 high) from 1.2099 (2025 low) at 1.4004. However, with 1.4248 resistance (2021 high) intact, this rally is more likely a corrective move. Sustained break of 55 W EMA (now at 1.3146) will argue that a medium term top has already formed and bring deeper fall back to 1.2099.
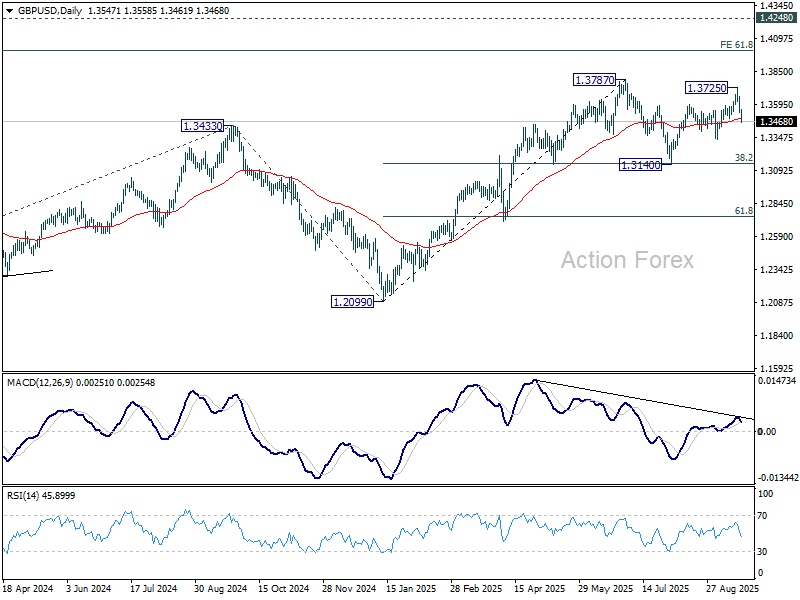
In the long term picture, as long as 1.4248/4480 resistance holds (38.2% retracement of 2.1161 to 1.0351 at 1.4480), the long term outlook will remain bearish. That is, price actions from 1.3051 are seen as a corrective pattern to the long term down trend from 2.1161 (2007 high) only. Nevertheless, decisive break of 1.4248/4480 will be a strong sign of long term bullish reversal.
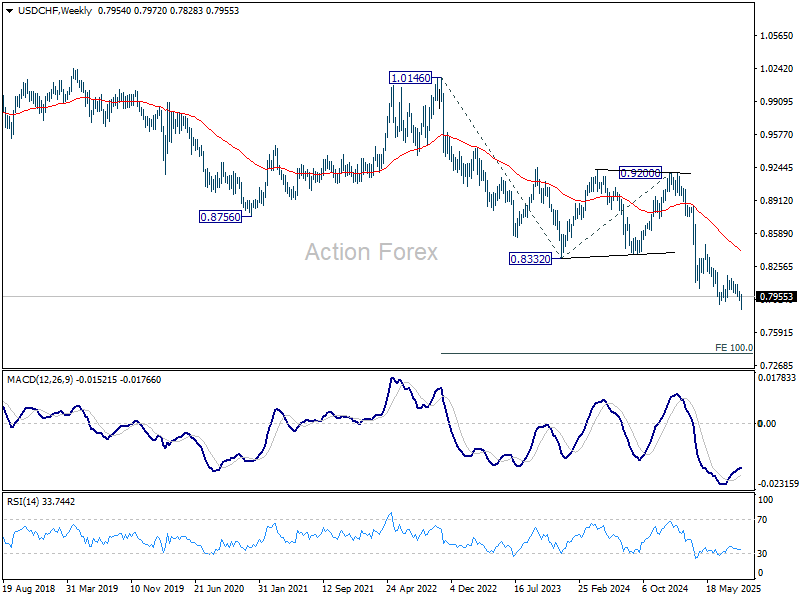
USD/CHF Weekly Outlook
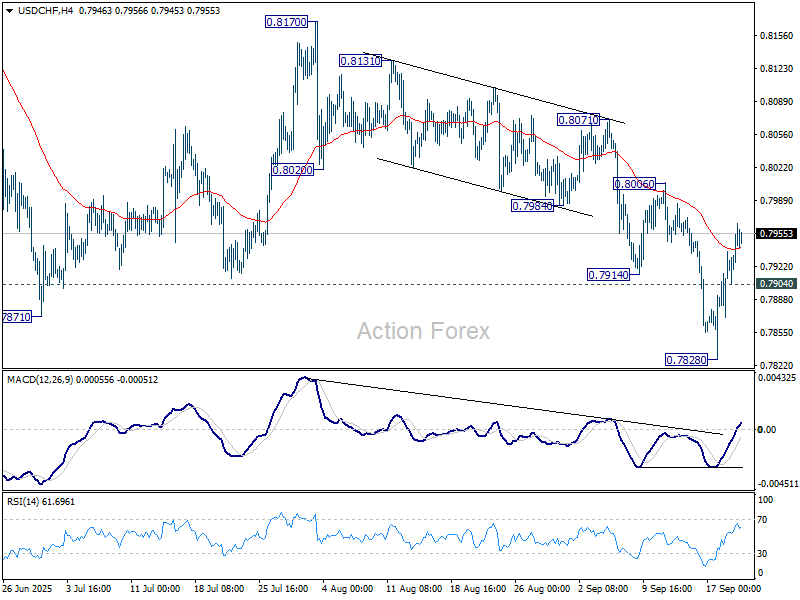
After initial dip to 0.7828 last week, USD/CHF recovered strongly. Break of 55 4H EMA suggests that a short term bottom was formed. Initial bias is mildly on the upside for 0.8006 resistance. Firm break there will bring stronger rise back to 0.8170. On the downside though, below 0.7904 minor support will bring retest of 0.7828 low instead.
In the bigger picture, long term down trend from 1.0342 (2017 high) is still in progress. Next target is 100% projection of 1.0146 (2022 high) to 0.8332 from 0.9200 at 0.7382. In any case, outlook will stay bearish as long as 0.8332 support turned resistance holds (202 low).
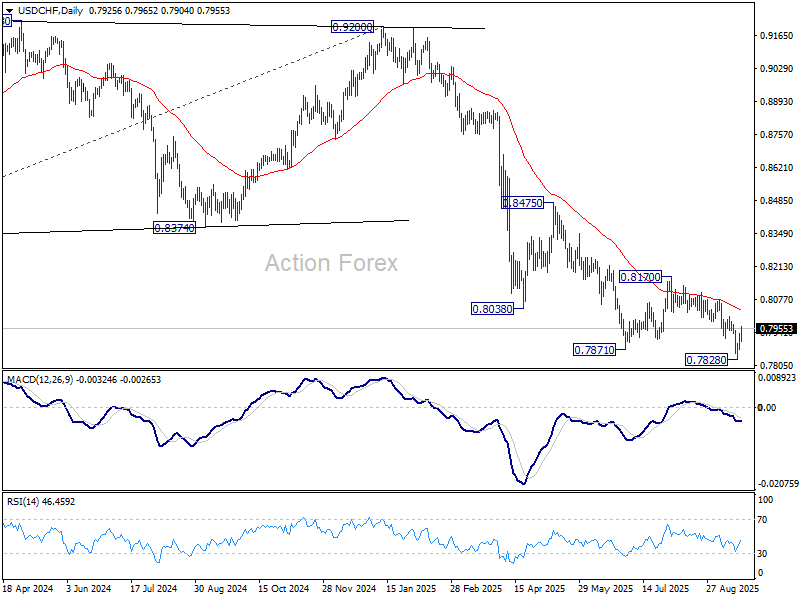
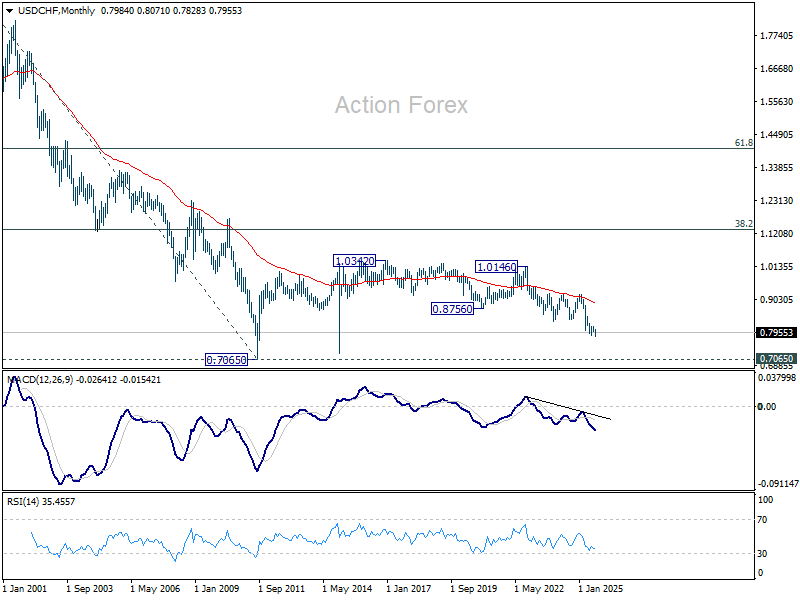
In the long term picture, price action from 0.7065 (2011 low) are seen as a corrective pattern to the multi-decade down trend from 1.8305 (2000 high). It's uncertain if the fall from 1.0342 is the second leg of the pattern, or resumption of the downtrend. But in either case, outlook will stay bearish as long as 0.8756 support turned resistance holds (2021 low). Retest of 0.7065 should be seen next.
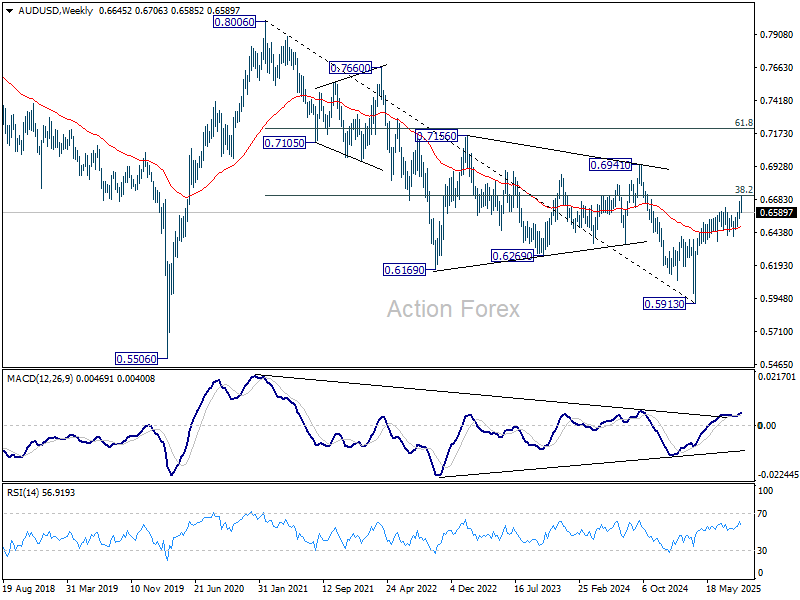
AUD/USD Weekly Report
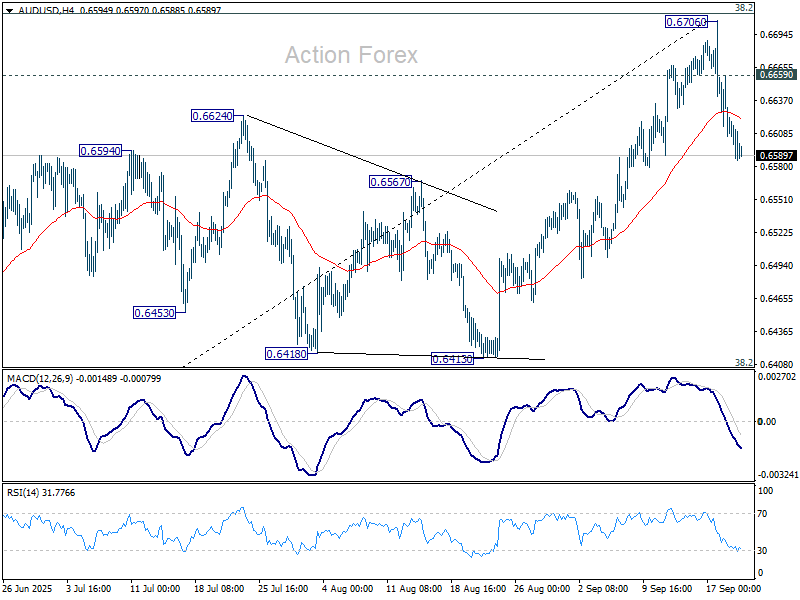
AUD/USD edged higher to 0.6706 last week but reversed after rejection by 0.6713 fibonacci resistance. The firm break of 55 4H EMA suggests that a short term top could be formed already, and deeper pullback is underway. Initial bias is mildly on the downside this week for 55 D EMA (now at 0.6540). Firm break there will target 0.6413 support. On the upside, though above 0.6659 minor resistance will bring retest of 0.6706 high.
In the bigger picture, there is no clear sign that down trend from 0.8006 (2021 high) has completed. Rebound from 0.5913 is seen as a corrective move. Outlook will remain bearish as long as 38.2% retracement of 0.8006 to 0.5913 at 0.6713 holds. Nevertheless, considering bullish convergence condition in W MACD, sustained break of 0.6713 will be a strong sign of bullish trend reversal, and path the way to 0.6941 structural resistance for confirmation.
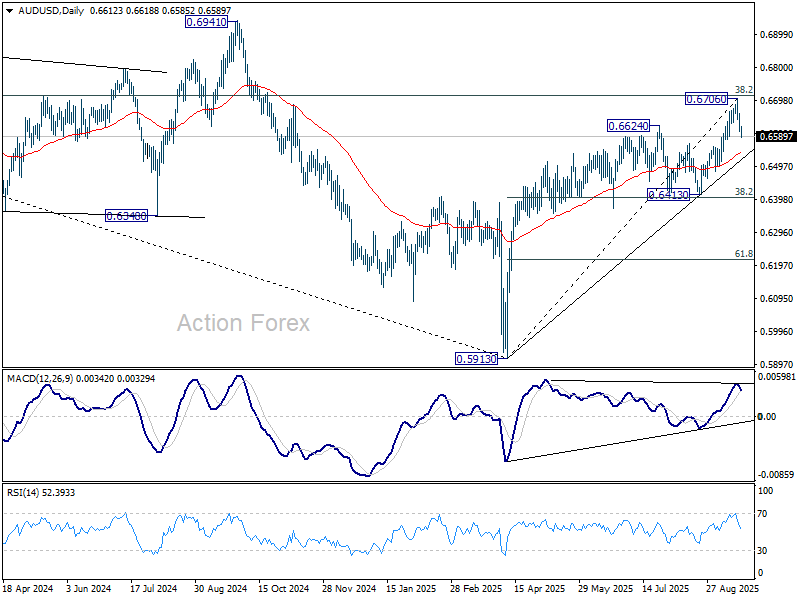
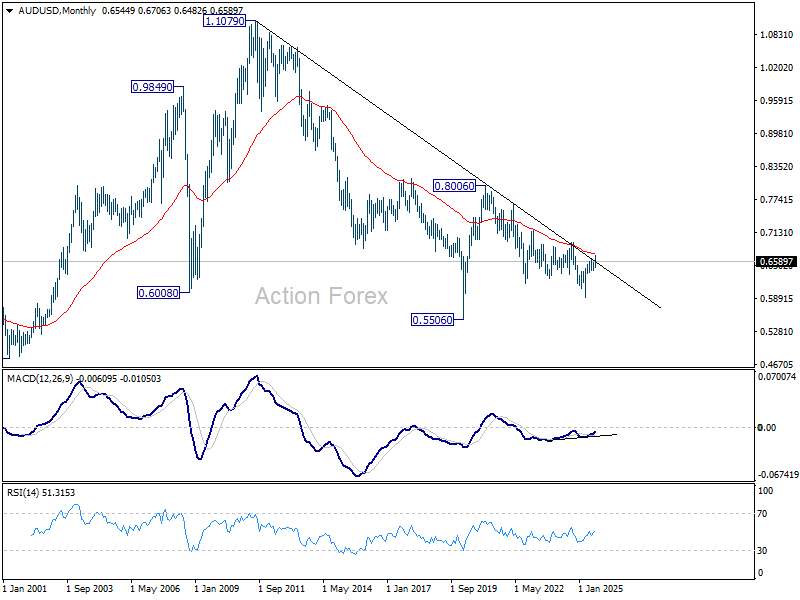
In the long term picture, fall from 0.8006 is seen as the second leg of the corrective pattern from 0.5506 long term bottom (2020 low). Hence, in case of deeper decline, strong support should emerge above 0.5506 to contain downside to bring reversal. On the upside, firm break of 0.6941 will argue that the third leg has already started back to 0.8006.