

Sample Category Title
GBP/USD Mid-Day Outlook
Daily Pivots: (S1) 1.3505; (P) 1.3583; (R1) 1.3631; More...
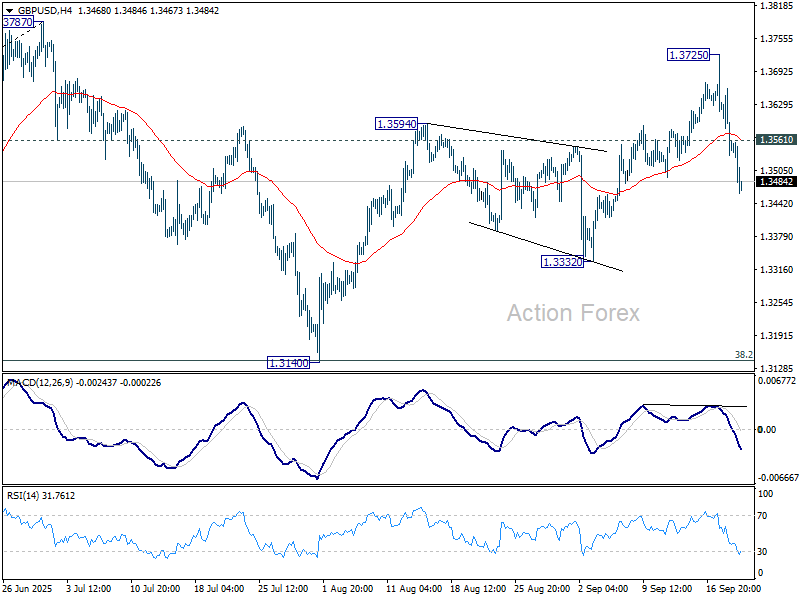
GBP/USD's break of 55 D EMA (now at 1.3486) suggests that rebound from 1.3140 has completed at 1.3725. Fall from there is seen as the third leg of the corrective pattern from 1.3787. Intraday bias is back on the downside for 1.3332 support first. Break there will target 1.3140 support next. On the upside, above 1.3561 minor resistance will turn intraday bias neutral again first.
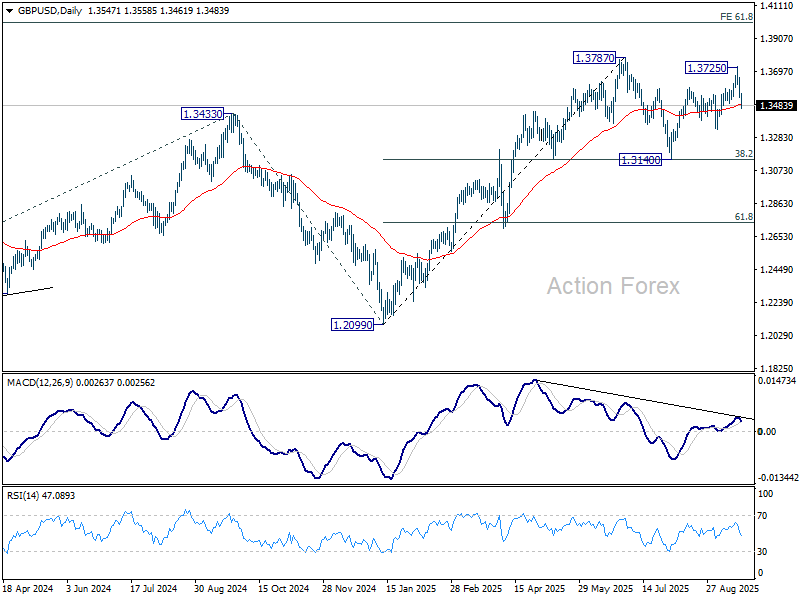
In the bigger picture, up trend from 1.3051 (2022 low) is in progress. Next medium term target is 61.8% projection of 1.0351 to 1.3433 from 1.2099 at 1.4004. Outlook will now stay bullish as long as 55 W EMA (now at 1.3151) holds, even in case of deep pullback.
Dollar Gains Momentum, Outpaces Peers as 10-Year Nears 4.15%
Dollar’s rebound is gathering strong momentum today, surging broadly across the board as markets continue to realign with the Fed’s message from midweek. After being under pressure earlier in the week, the greenback is now positioned to potentially end as one of the strongest performers. Supporting the move, U.S. Treasury yields have extended higher, with the 10-year looking set to break through 4.15% mark. That is notable considering the benchmark yield briefly dipped below 4% twice earlier in the week.
The resilience in Dollar and yields underscores investor confidence that the Fed remains in control of the easing process rather than being pushed into aggressive action by market forces. Indeed, traders appear to have taken comfort in the Fed’s framing of its rate cut as “risk management” rather than a response to imminent economic weakness. Policymakers still project two more cuts this year, but with the overall policy rate just 25bps below June’s projections and the terminal rate expected to stay above the long-run neutral. The message is that the Fed is easing with caution, not capitulation.
Meanwhile, Yen was briefly buoyed by a slightly more hawkish than expected BoJ vote, which saw two dissenters calling for a rate hike. The move triggered a sharp intraday jump in Yen crosses. But that strength quickly faded as Governor Kazuo Ueda’s press conference highlighted the board’s more cautious stance. Ueda stressed that in his personal view, “underlying inflation is still somewhat below 2% but approaching that level.” He added that while upside price risks identified by board member Naoki Tamura deserved attention, downside risks tied to the intensifying impact of U.S. tariffs on Japan’s economy could not be ignored. His balanced tone signaled that the hawkish dissent remains a minority position.
For the week so far, Swiss Franc and Loonie still lead the performance table, followed closely by Dollar. If current momentum persists into the close, the greenback could overtake both. At the other end, Kiwi and Aussie remain pinned to the bottom, with Sterling also soft. Euro and Yen are stuck in the middle of the pack.
In Europe, at the time of writing, FTSE is up 0.03%. DAX is down -0.16%. CAC is up 0.15%. UK 10-year yield is up 0.043 at 4.723. Germany 10-year yield is up 0.025 at 2.750. Earlier in Asia, Nikkei fell -0.57%. Hong Kong HSI closed flat. China Shanghai SSE fell -0.30%. Singapore Strait Times fell -0.23%. Japan 10-year JGB yield rose 0.04 to 1.641.
Canada's retail sales drop -0.8% mom in July, but advance data signal August rebound
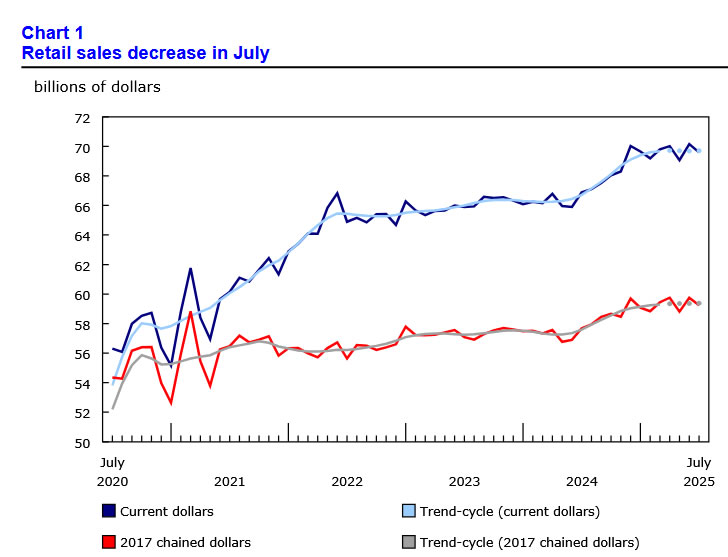
Canadian retail sales declined -0.8% mom to CAD 69.6B in July, worse than expectations of a -0.6% drop. Core sales, which exclude motor vehicles, parts, and fuel, fell even more sharply by -1.2%.
The downturn was broad-based, with eight of nine subsectors posting declines, led by food and beverage retailers. The figures point to cooling consumer demand as households remain squeezed by high borrowing costs and lingering price pressures.
Still, Statistics Canada’s advance estimate suggested a brighter picture ahead, with retail sales projected to rebound by 1.0% mom in August.
Fed’s Kashkari sees two more cuts this year, labor market risks more pressing
Minneapolis Fed President Neel Kashkari said the balance of risks facing the U.S. economy tilted toward the labor market rather than inflation. In an essay, he argued that given the “large concurrent changes” in trade, immigration, and tax policies, and the mixed signals in the economy, the more pressing danger is “rapid further weakening” in employment rather than a major inflation overshoot.
Kashkari noted that labor markets historically can deteriorate “quickly and non-linearly,” making preemptive action necessary. By contrast, he said tariff-related uncertainty implies a risk of inflation persistence near 3% rather than a sharp surge to 4–5%.
That backdrop led him to support this week’s rate cut, raising his own projection from two to three cuts this year in the Fed’s Summary of Economic Projections.
Still, Kashkari stressed that policy is not on a preset course. If the labor market proves more resilient or inflation surprises on the upside, the Fed should pause, or even consider raising rates again. Conversely, if jobs weaken more rapidly than expected, he said policymakers should be ready to act more aggressively to support growth.
UK retail sales rise 0.5% mom in August, third monthly gain
UK retail sales rose 0.5% mom in August, slightly above expectations of 0.4%, marking a third consecutive month of growth. Still, volumes remain shy of their March 2025 peak, highlighting that the rebound is steady but incomplete.
The broader three-month trend still points to weakness, with sales down -0.1% compared to the three months to May. However, this marks an improvement from July’s -0.6% decline, indicating the downturn in spending is losing intensity.
BoJ holds with two members calling for hike, starts selling ETFs and J-REITs
The BoJ kept rates steady at 0.50% in September, but the 7–2 vote revealed a growing hawkish bias. Naoki Tamura and Hajime Takata broke ranks to support a rate increase, citing upside risks to inflation and progress toward achieving the 2% price stability target. Takata said that Japan has more or less achieved its inflation goal, while Tamura argued that the key rate should move closer to neutral given skewed risks to the upside.
Alongside the decision, the BoJ unveiled plans to shrink its massive balance sheet by selling assets. The Bank will sell ETFs at a pace of JPY 330B annually and J-REITs at JPY 5B, with the principle of minimizing market disruption. With its balance sheet at 125% of GDP—far larger than other major central banks—the BoJ’s move marks a notable shift toward normalization, even as rates remain unchanged for now.
Japan core CPI Slows to 2.7%, lowest since late 2024
Japan’s consumer inflation eased notably in August, with both headline CPI and core CPI (excluding fresh food) falling to 2.7% yoy from 3.1% in July, the lowest since November 2024. Despite the slowdown, inflation has remained above the BoJ’s 2% target for over three years.
Core-core CPI, which strips out both fresh food and energy and is seen as a key gauge of underlying price dynamics, ticked down to 3.3% yoy from 3.4%. The moderation suggests a gradual cooling in inflationary pressures, though price growth remains elevated relative to historical norms.
Food prices continued to drive the cost-of-living squeeze, with processed food up 8.0% yoy, though slower than July’s 8.3%. Rice inflation also eased to 69.7% yoy from an eye-watering 90.7%. Energy prices provided some relief, falling -3.3% yoy after a -0.3% drop in July.
NZ exports jump 23% in August, imports flat, deficit at NZD -1.2B
New Zealand recorded a goods trade deficit of NZD 1.2B in August as imports outpaced a sharp rise in exports. Goods exports climbed NZD 1.1B, or 23% yoy, to NZD 5.9B, supported by strong shipments to major partners. Imports slipped slightly, falling NZD 30m (-0.4% yoy) to NZD 7.1B, but remained elevated enough to keep the monthly balance in deficit.
Export growth was broad-based, with China (+35% yoy, the EU (+52%), Australia (+17%), and the U.S. (+14%) all showing strong gains. Japan was the notable exception, where exports fell -11% yoy, driven by a NZD 28m decline in milk powder, butter, and cheese.
On the import side, flows from China rose 6.2% yoy, while purchases from the EU fell -6.0% and from the U.S. declined -1.3%. The largest pullback came from South Korea, where imports dropped -32% yoy.
GBP/USD Mid-Day Outlook
Daily Pivots: (S1) 1.3505; (P) 1.3583; (R1) 1.3631; More...
GBP/USD's break of 55 D EMA (now at 1.3486) suggests that rebound from 1.3140 has completed at 1.3725. Fall from there is seen as the third leg of the corrective pattern from 1.3787. Intraday bias is back on the downside for 1.3332 support first. Break there will target 1.3140 support next. On the upside, above 1.3561 minor resistance will turn intraday bias neutral again first.
In the bigger picture, up trend from 1.3051 (2022 low) is in progress. Next medium term target is 61.8% projection of 1.0351 to 1.3433 from 1.2099 at 1.4004. Outlook will now stay bullish as long as 55 W EMA (now at 1.3151) holds, even in case of deep pullback.
Canada’s retail sales drop -0.8% mom in July, but advance data signal August rebound
Canadian retail sales declined -0.8% mom to CAD 69.6B in July, worse than expectations of a -0.6% drop. Core sales, which exclude motor vehicles, parts, and fuel, fell even more sharply by -1.2%.
The downturn was broad-based, with eight of nine subsectors posting declines, led by food and beverage retailers. The figures point to cooling consumer demand as households remain squeezed by high borrowing costs and lingering price pressures.
Still, Statistics Canada’s advance estimate suggested a brighter picture ahead, with retail sales projected to rebound by 1.0% mom in August.
Fed’s Kashkari sees two more cuts this year, labor market risks more pressing
Minneapolis Fed President Neel Kashkari said the balance of risks facing the U.S. economy tilted toward the labor market rather than inflation. In an essay, he argued that given the “large concurrent changes” in trade, immigration, and tax policies, and the mixed signals in the economy, the more pressing danger is “rapid further weakening” in employment rather than a major inflation overshoot.
Kashkari noted that labor markets historically can deteriorate “quickly and non-linearly,” making preemptive action necessary. By contrast, he said tariff-related uncertainty implies a risk of inflation persistence near 3% rather than a sharp surge to 4–5%.
That backdrop led him to support this week’s rate cut, raising his own projection from two to three cuts this year in the Fed’s Summary of Economic Projections.
Still, Kashkari stressed that policy is not on a preset course. If the labor market proves more resilient or inflation surprises on the upside, the Fed should pause, or even consider raising rates again. Conversely, if jobs weaken more rapidly than expected, he said policymakers should be ready to act more aggressively to support growth.
BoJ Holds Rates, Yen Gives Up Gains
The Japanese yen climbed 0.50% earlier against the US dollar but was unable to consolidate these gains. In the European session, USD/JPY is trading at 147.92, down 0.04% on the day.
Bank of Japan delivers hawkish hold
The Bank of Japan maintained its key interest rate at 0.50% at today's meeting. The non-move was widely expected by the markets. What was a surprise was the split vote, as two of the nine members voted in favor of a rate hike, indicating some support for a more hawkish montary policy.
Governor Ueda has been cautious and has the markets guessing as to when the BoJ will raise rates. The markets have priced in a 59% chance of a rate hike before the end of the year, up from 50% a week ago, according to LSEG.
The policy statement noted that the domestic economy had "recovered moderately" but was still showing signs of weakness. Members also expressed concern that exports will be hurt by US tariffs, with Japan facing a 15% tarriff on most of its exports to the US.
On the inflation front, the statement said that underlying inflation is weak but is expected to increase gradually and reach the 2% inflation target.
After years of deflation, prices are moving higher, which has led to expectations that a rate hike is just a question of timing. Consumer inflation is running between 2.5-3%, above the BoJ's 2% target. The central bank has stressed that it wants to see sustainable underling inflation at around 2% before the next rate hike.
The BoJ is also concerned about the political turmoil in Japan. Prime Minister Ishiba recently resigned and the ruling Liberal Democratic Party is holding an election to choose a new leader.
USD/JPY Technical
- USDJPY tested support at 1.4777 and 147.51 earlier
- There is resistance at 148.12 and 148.38
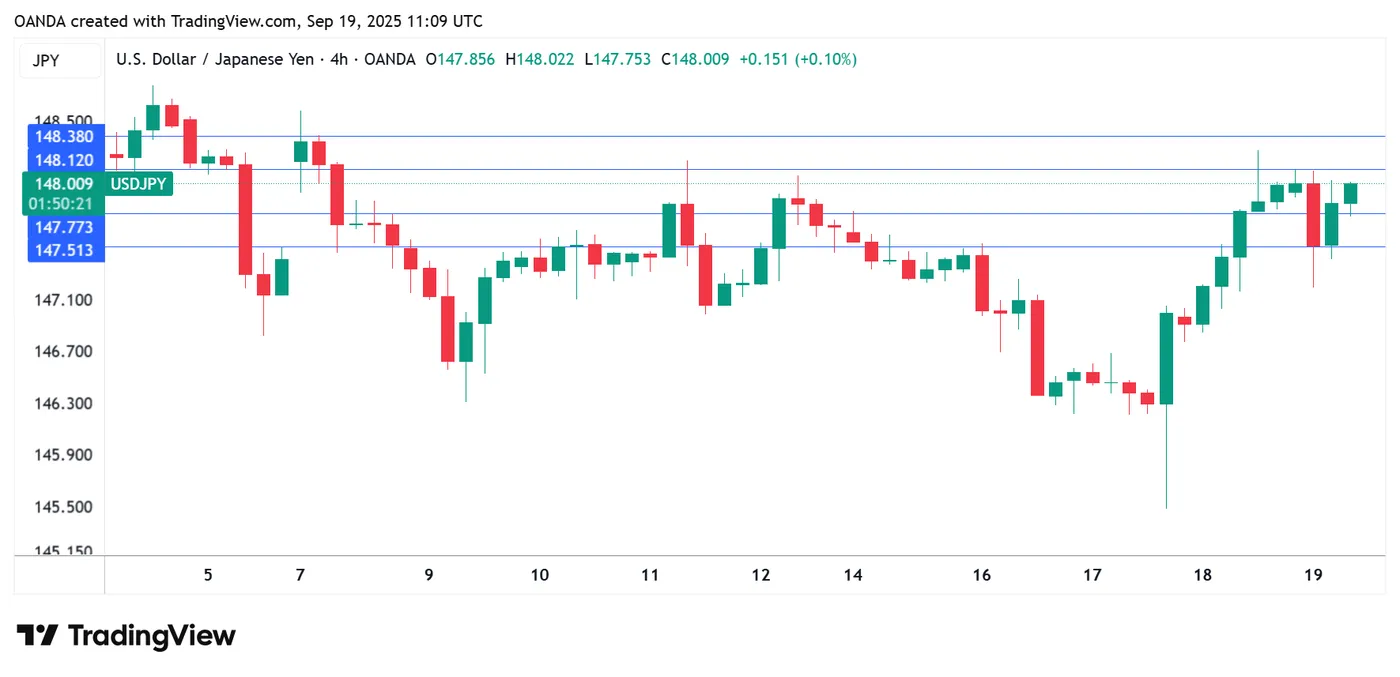
USDJPY 4-Hour Chart, September 19, 2025
GBP/JPY Braces for Volatility
- GBPJPY pulls back from highs as BoJ hike scenario gains support.
- Short-term bias stays bullish, a new volatile episode might be underway.
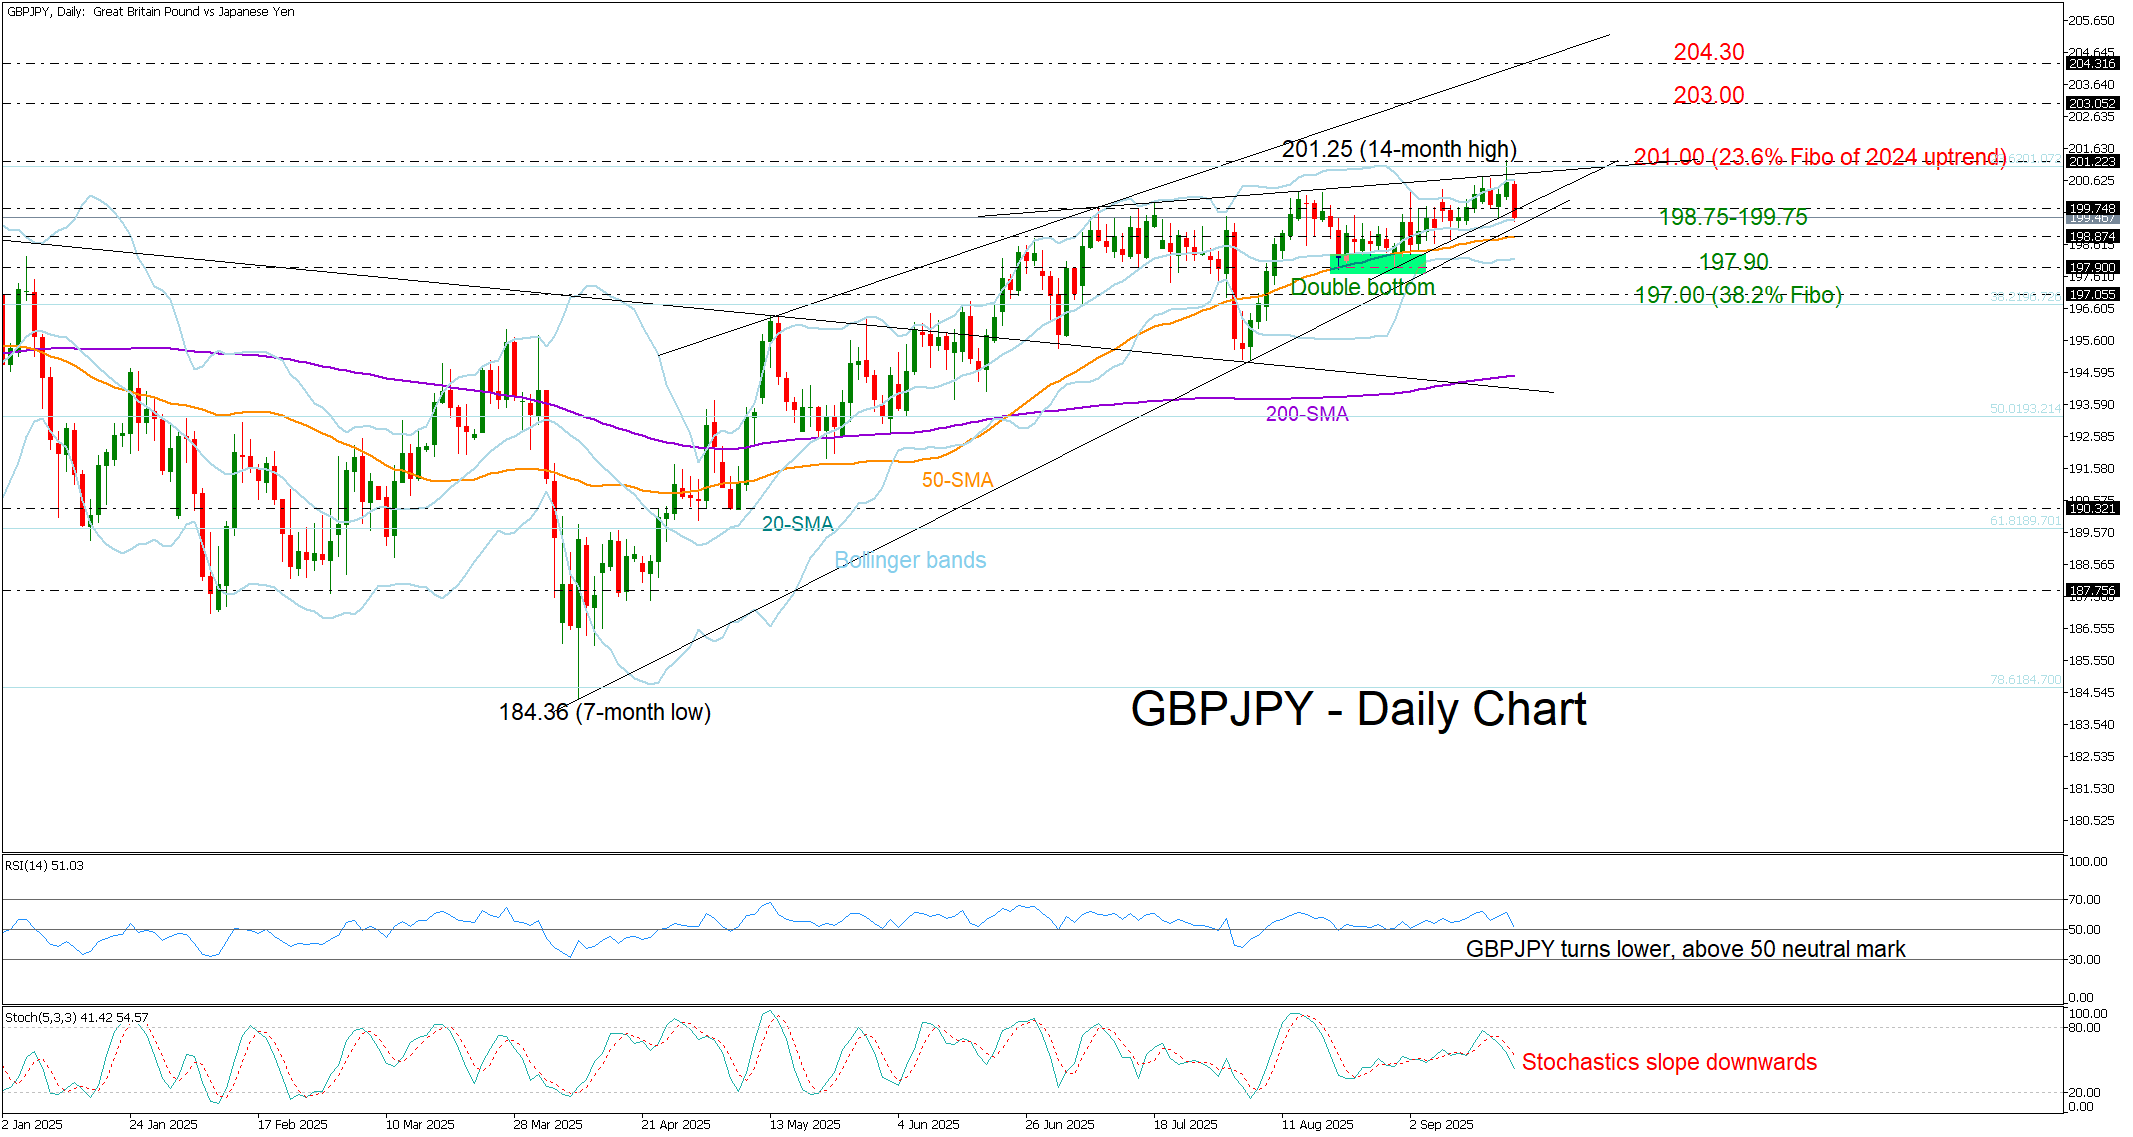
GBPJPY slipped about 0.5% to 199.34 after the Bank of Japan held rates steady as expected but two policymakers surprisingly called for a hike to 0.75%. The central bank also announced plans to sell $250bn of traded funds.
The retreat immediately followed the peak at a 14-month high at 201.25, where the pair stalled below the 23.6% Fibonacci retracement of the 2024 uptrend. The focus is now on the 198.75-199.75 area, where the 20- and 50-day SMAs and the ascending trendline from April are positioned. A break lower could expose 197.90 or even 197.00, where the 38.2% retracement level is located.
Momentum signals are softening, with the RSI and stochastics pointing lower. Still, as long as the RSI holds above 50, the bulls have room to regroup. In any case, the Bollinger Band squeeze suggests a new episode of volatility is imminent.
In the event buying interest resurfaces above 199.75, the pair may again battle the 201.00 bar with scope to meet the 203.00 mark and possibly stretch up to the key resistance line at 204.30.
Overall, despite selling pressure, the short-term outlook remains constructive. Holding 198.90–199.35 would preserve the bullish path.
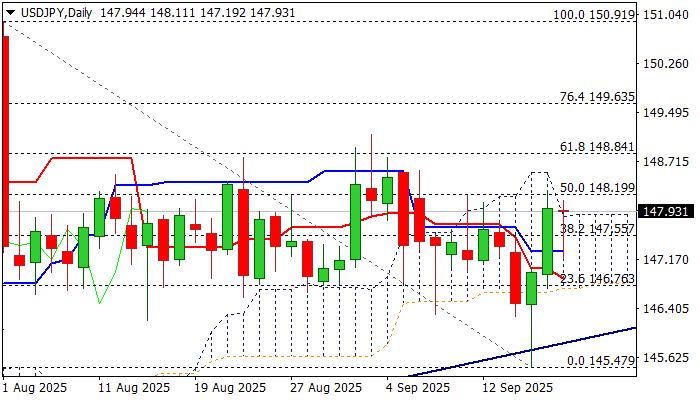
USDJPY: Firm Break Above Daily Cloud Top to Boost Bullish Outlook, Bear-Trap Underpins Recovery
USDJPY regained traction and bounced near Thursday’s one-week high after the Bank of Japan left rates unchanged but signaled potential earlier than expected rate hikes that temporarily inflated yen.
Strong rally in past two days was sparked by Fed’s overall less dovish than expected projections for 2026.
Wednesday’s bullish candle with long tail reflected turbulent post-FOMC action, which resulted in strong downside rejection and formation of bear-trap under 100DMA) and provided positive signal.
Fresh recovery returned to daily Ichimoku cloud and rose through entire cloud (spanned between 146.72 and 147.87) to probe above cloud top on Friday.
Close above cloud top is needed to boost positive near-term outlook, with break above nearby Fibo barrier at 148.20 (50% retracement of 150.91/145.47) to confirm signal and expose targets at 148.58 (200DMA), 148.84 (Fibo 61.8%) and 149.13 (Sep 3 top).
Daily studies are bullishly aligned but require further improvement to stronger underpin the action.
Caution on failure to clear daily cloud top that may keep bulls on hold, though will be biased higher while holding above 55DMA / broken Fibo 38.2% (147.56).
Res: 147.87; 148.20 148.58; 148.84
Sup: 147.56; 147.19;146.72; 146.23
What Was Important for US Dollar Index (DXY) This Week
The long-awaited event — the Fed’s first rate cut of 2025 — has taken place. What is particularly important to note is the price action on the US Dollar Index (DXY) chart.
The value of the USD against a basket of other currencies made a two-step move, forming a pin-bar candle with a long lower shadow:
→ Arrow 1: When the Fed actually announced the easing, the dollar weakened as expected on this “dovish news.”
→ Arrow 2: But at the subsequent press conference, Fed Chair Jerome Powell delivered a series of “hawkish” remarks that shifted the market mood and drove the dollar higher. He stressed that this cut does not mark the beginning of “a series of continuous rate reductions,” and that further decisions will be taken “based on incoming economic data.”
Powell also stated plainly that the option of a more aggressive 50-basis-point cut had not gained sufficient support among FOMC members. Therefore, the “down-then-up” move highlights a sharp change in trader sentiment within a short timeframe, as expectations failed to materialise.
Technical Analysis of the DXY Chart
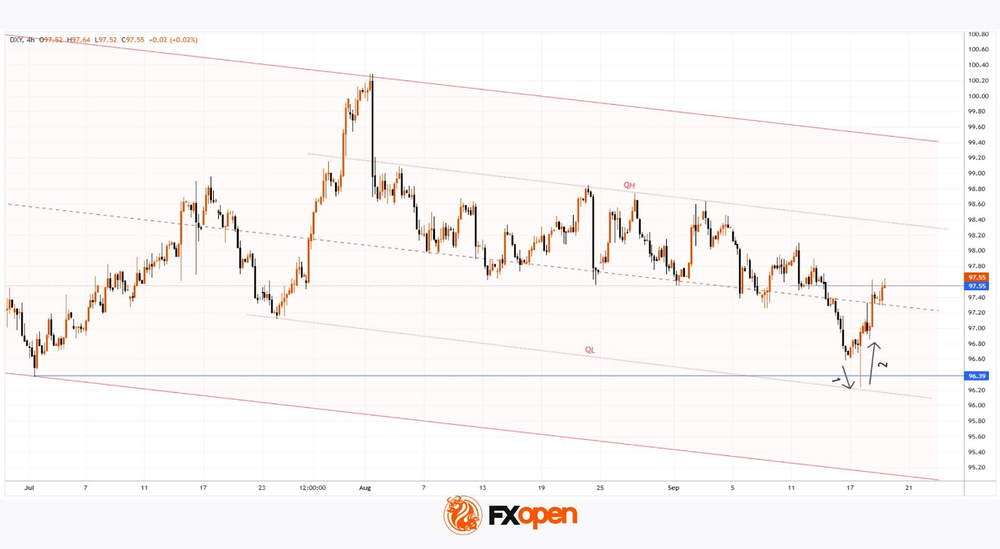
In our 9 September analysis, we confirmed the relevance of:
→ the descending channel (shown in red) defined by a sequence of lower highs and lower lows;
→ the intermediate QL and QH lines, which divide the channel into quarters.
Notably, at Wednesday’s low the price:
→ touched the QL line, underscoring its strength;
→ formed a clear Liquidity Grab pattern (in the terminology of the Smart Money Concept methodology).
From the perspective of Richard Wyckoff’s method, Wednesday’s low may be viewed as a Spring pattern, which preceded a Mark-Up phase of rising prices.
How Might Events Unfold Next?
Given the above, we could assume that the hawkish tone could serve as a longer-term factor for the DXY index. The 97.55 level appears to act as resistance, but it is possible that we may see an attempt to break through it, with the next target being the QH line.
Trade global index CFDs with zero commission and tight spreads. Open your FXOpen account now or learn more about trading index CFDs with FXOpen.
This article represents the opinion of the Companies operating under the FXOpen brand only. It is not to be construed as an offer, solicitation, or recommendation with respect to products and services provided by the Companies operating under the FXOpen brand, nor is it to be considered financial advice.
EUR/USD Corrects Lower in Post-Fed Pause
The EUR/USD pair extended its decline on Friday, retreating further following the US Federal Reserve’s September meeting. The US dollar found support as the Fed’s rhetoric proved less dovish than markets had anticipated.
While the central bank cut rates by 25 basis points and signalled two additional cuts in 2025, it projected only one further reduction in 2026, tempering expectations for more aggressive easing. Chair Jerome Powell described the decision as a “risk management” response to a softening labour market, emphasising that the Fed saw “no need to rush” into further moves.
The dollar drew additional strength from initial jobless claims data, which fell to 231,000 – below forecasts of 241,000 and well under the previous week’s revised figure of 264,000.
Earlier in the week, eurozone inflation held steady at 2.0% year-on-year in August, unchanged from July and slightly better than the 2.1% forecast.
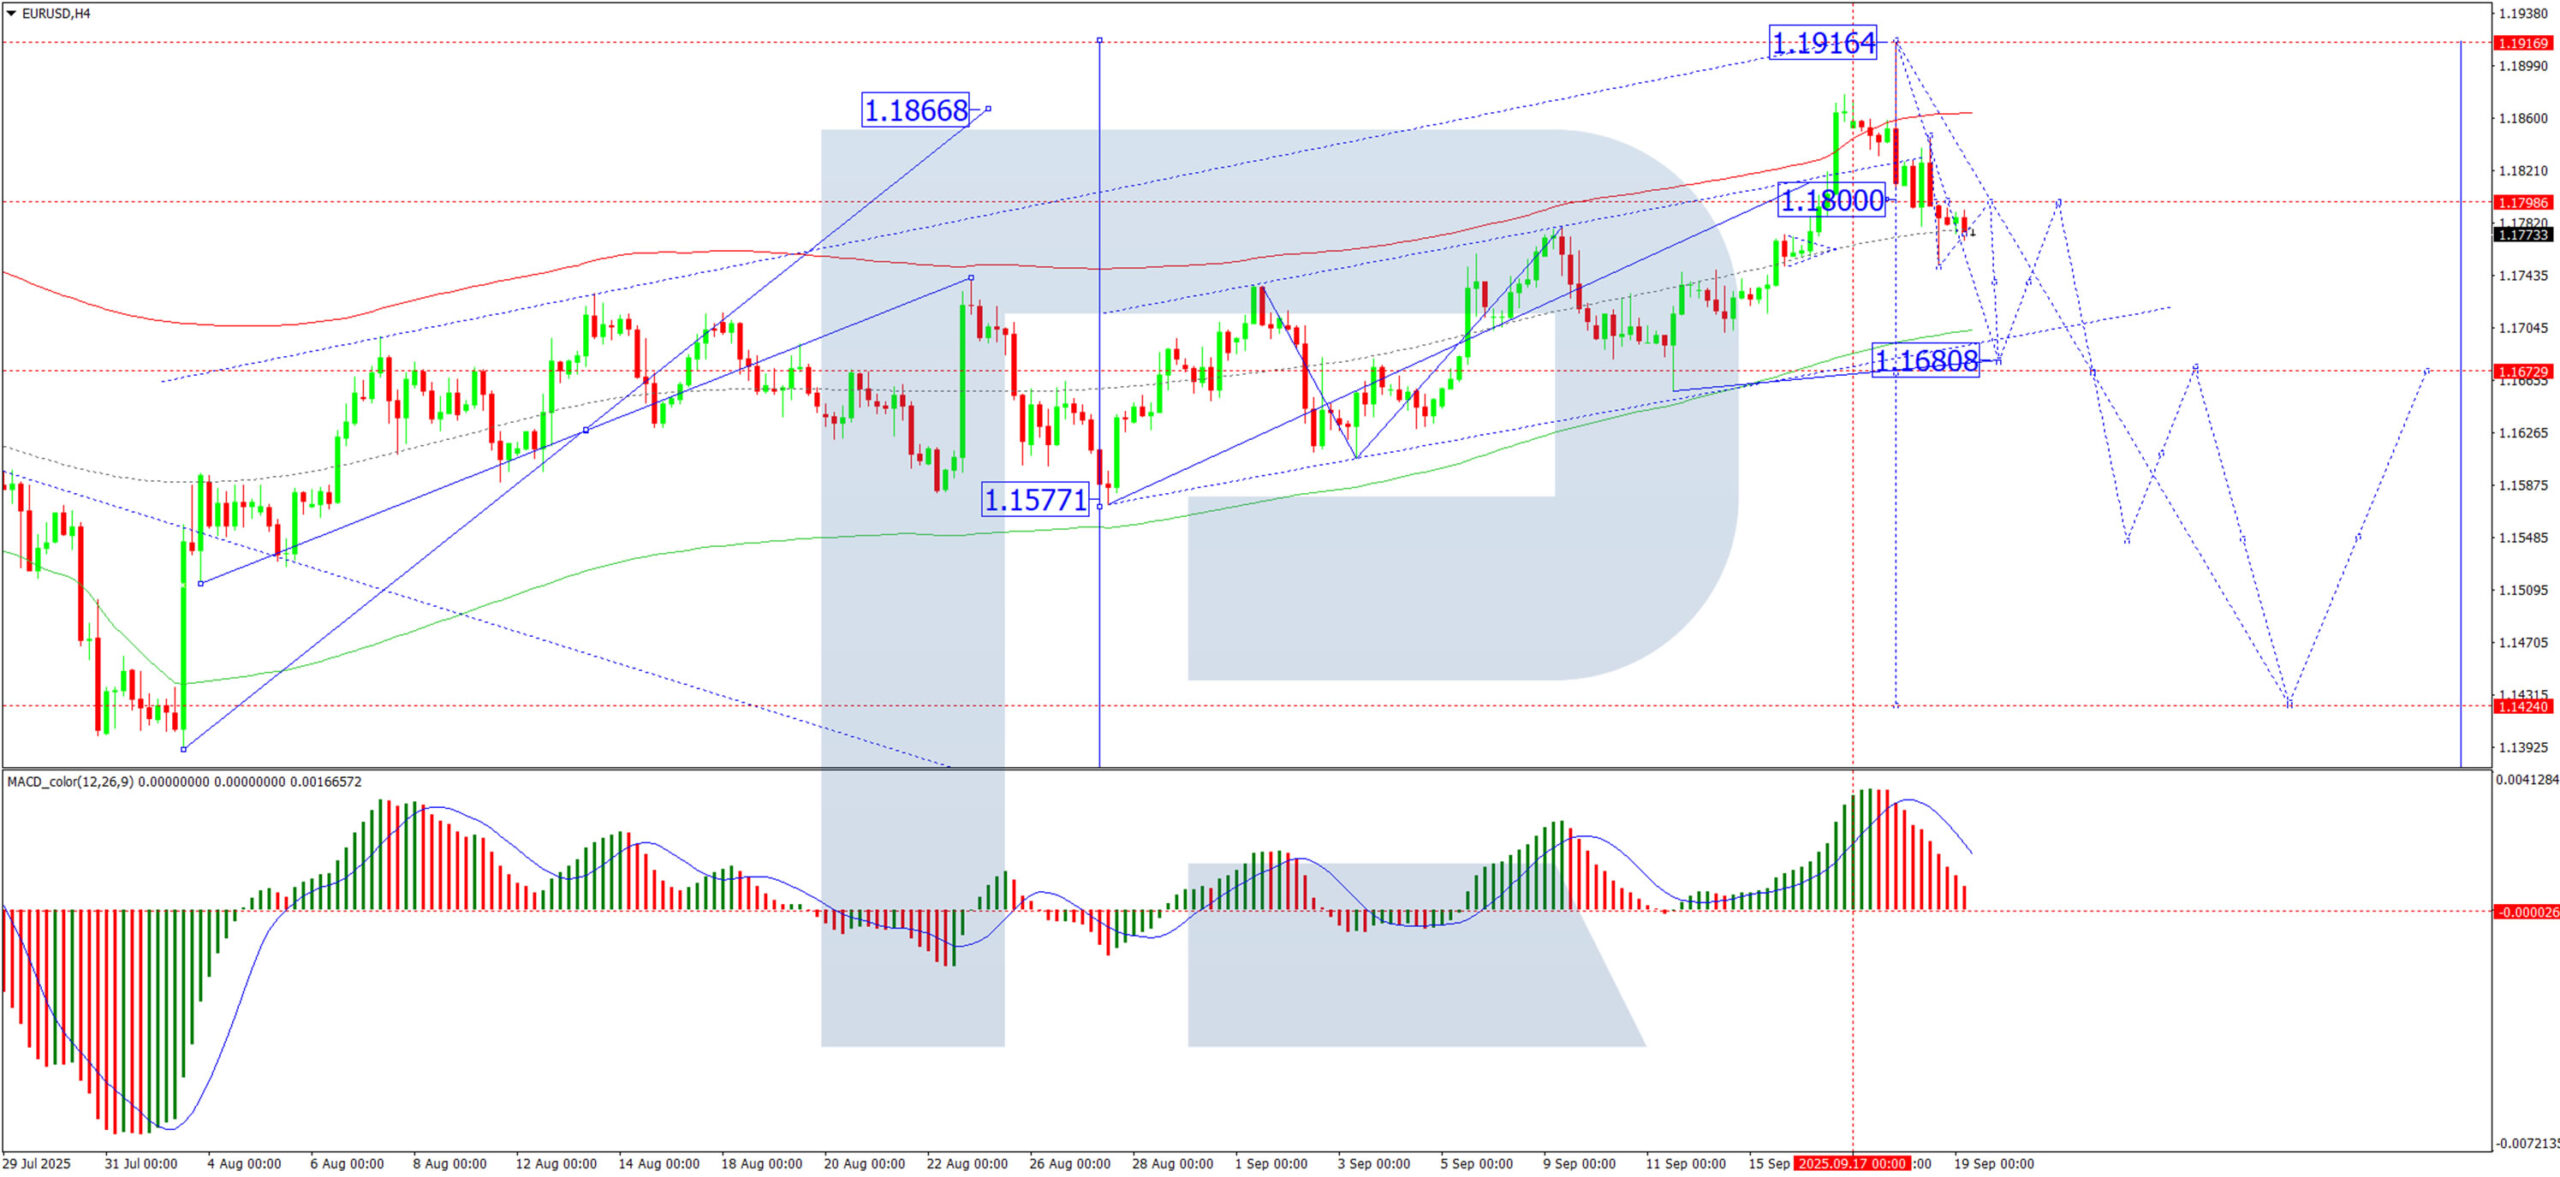
Despite this week’s pullback, the broader trend for EUR/USD remains bullish.
Technical Analysis: EUR/USD
H4 Chart:
On the H4 chart, EUR/USD formed a consolidation range around 1.1800 USD before breaking downward. The pair is now extending its decline towards 1.1680 USD. Once this target is reached, a corrective rebound towards 1.1800 USD may follow. The MACD indicator supports this view: its signal line remains above zero but is trending firmly lower, reflecting building near-term selling pressure.
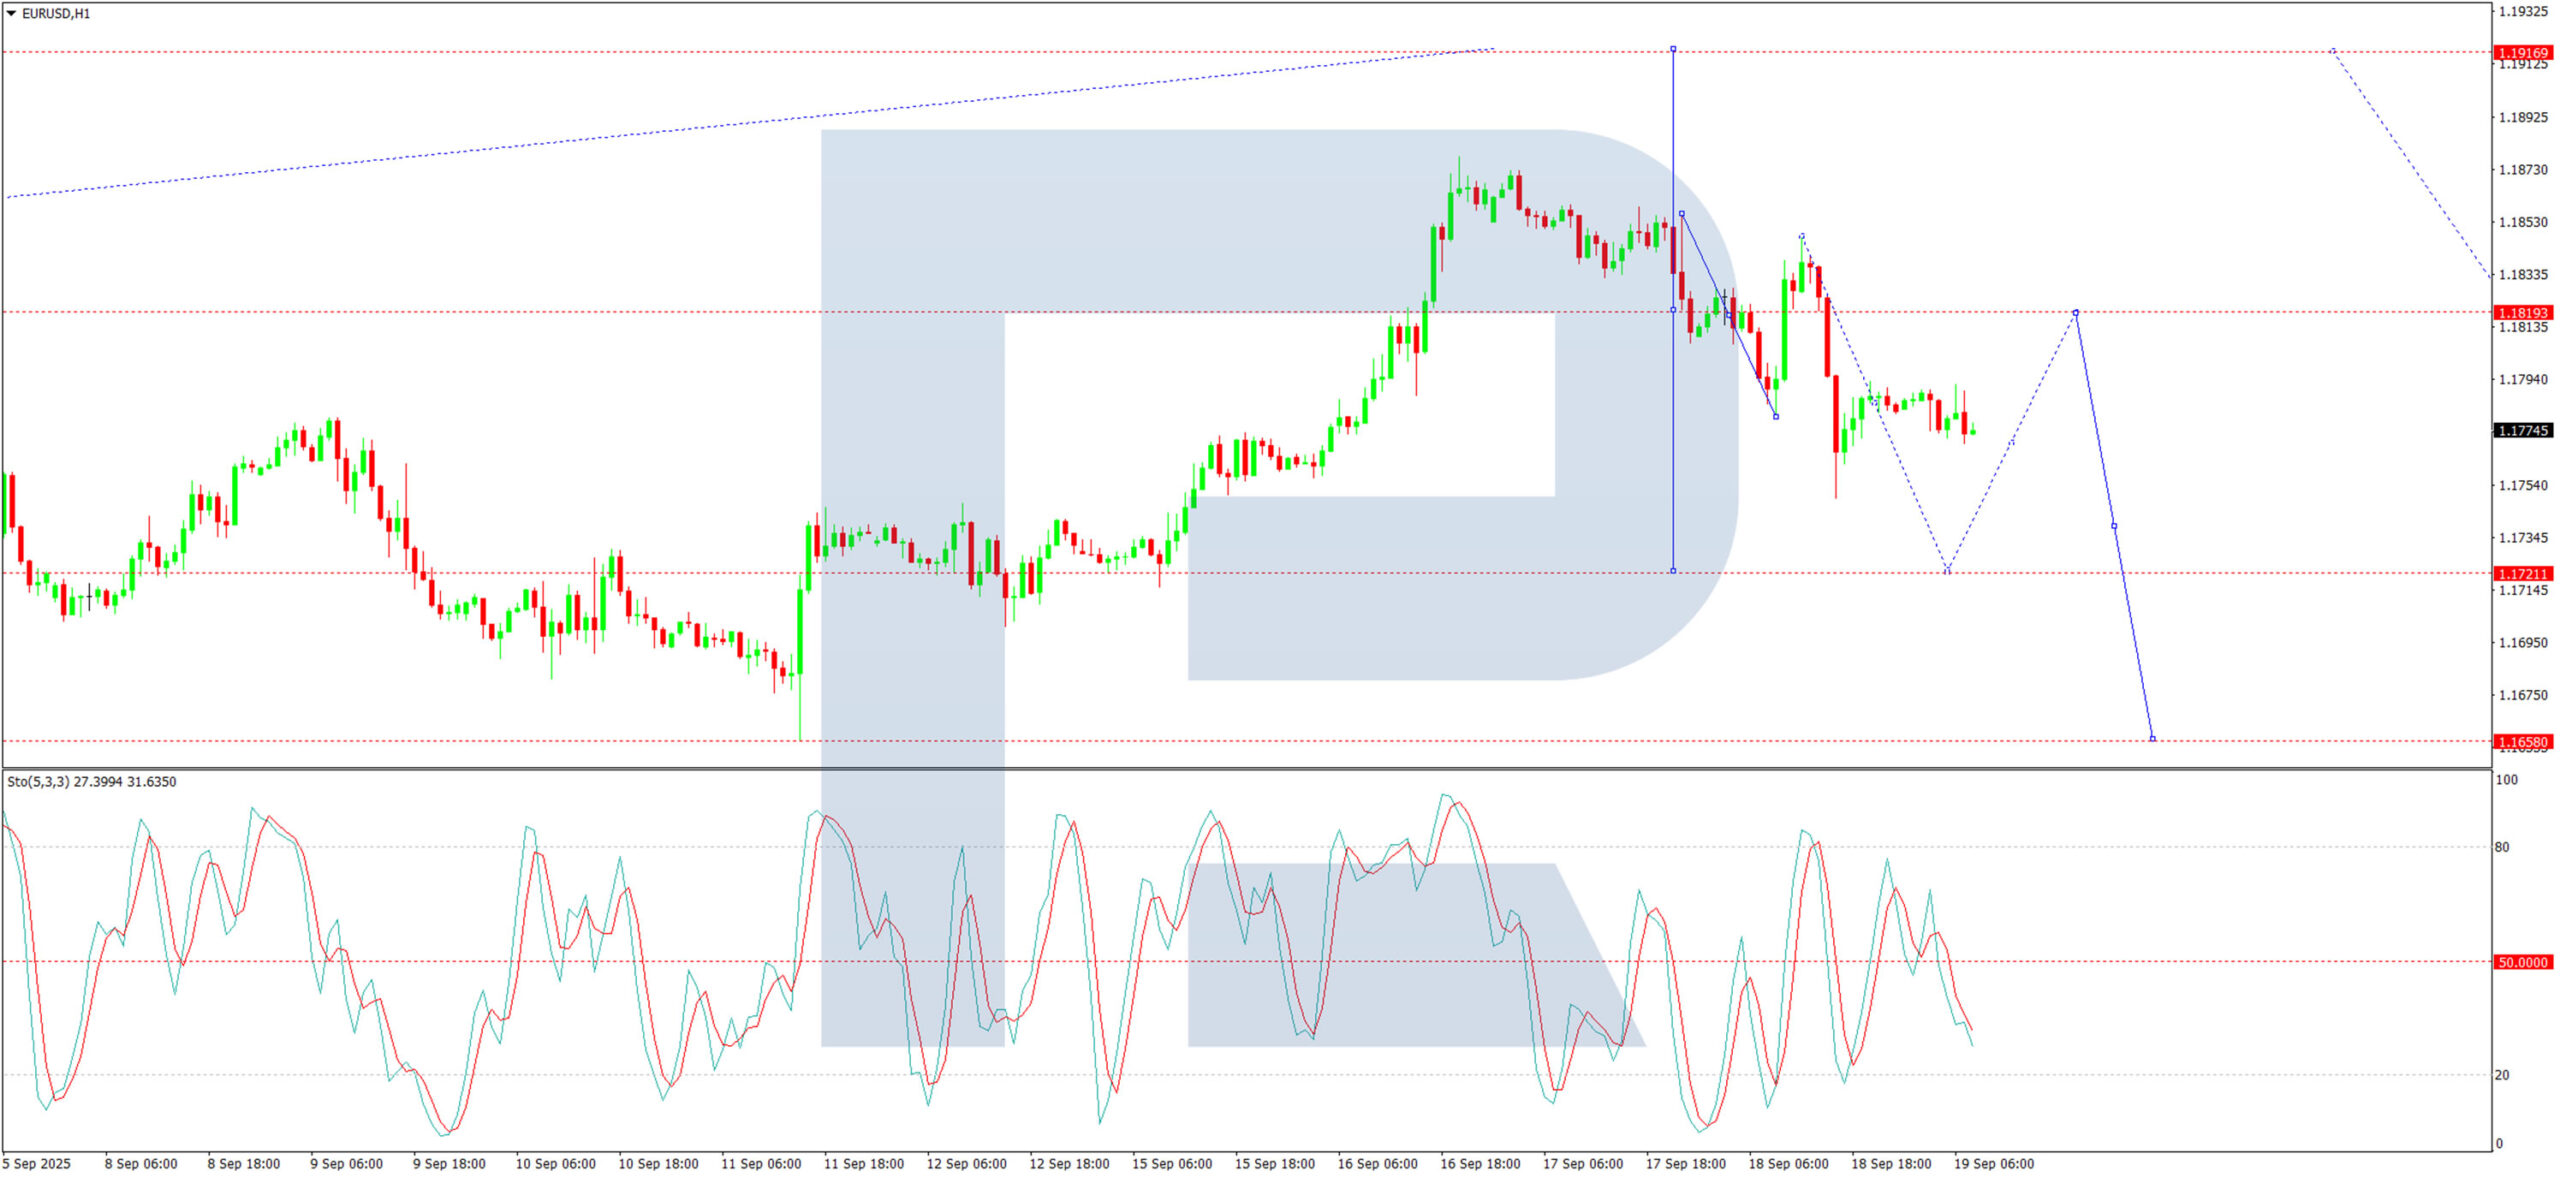
H1 Chart:
On the H1 chart, the pair completed a downward move to 1.1777 USD and a corrective bounce to 1.1845 USD. The market is now forming a new downward structure towards 1.1720 USD, with further downside potential to 1.1680 USD. A brief correction towards 1.1800 USD is possible before any renewed decline towards 1.1630 USD, and eventually 1.1550 USD. The Stochastic oscillator confirms the near-term bearish momentum, with its signal line below 50 and pointing downward towards 20.
Conclusion
EUR/USD is undergoing a technical correction after the Fed tempered expectations for aggressive easing. While the dollar has found near-term support, the euro’s underlying fundamentals remain steady, with inflation under control and growth concerns limited. The pair’s broader uptrend is likely to resume once the current corrective phase concludes, though a deeper retracement cannot be ruled out if US data continues to surprise to the upside. Traders will be watching next week’s eurozone PMI and US PCE data for fresh directional catalysts.
Elliott Wave Update: Nikkei (NKD) Advances in Fifth Wave
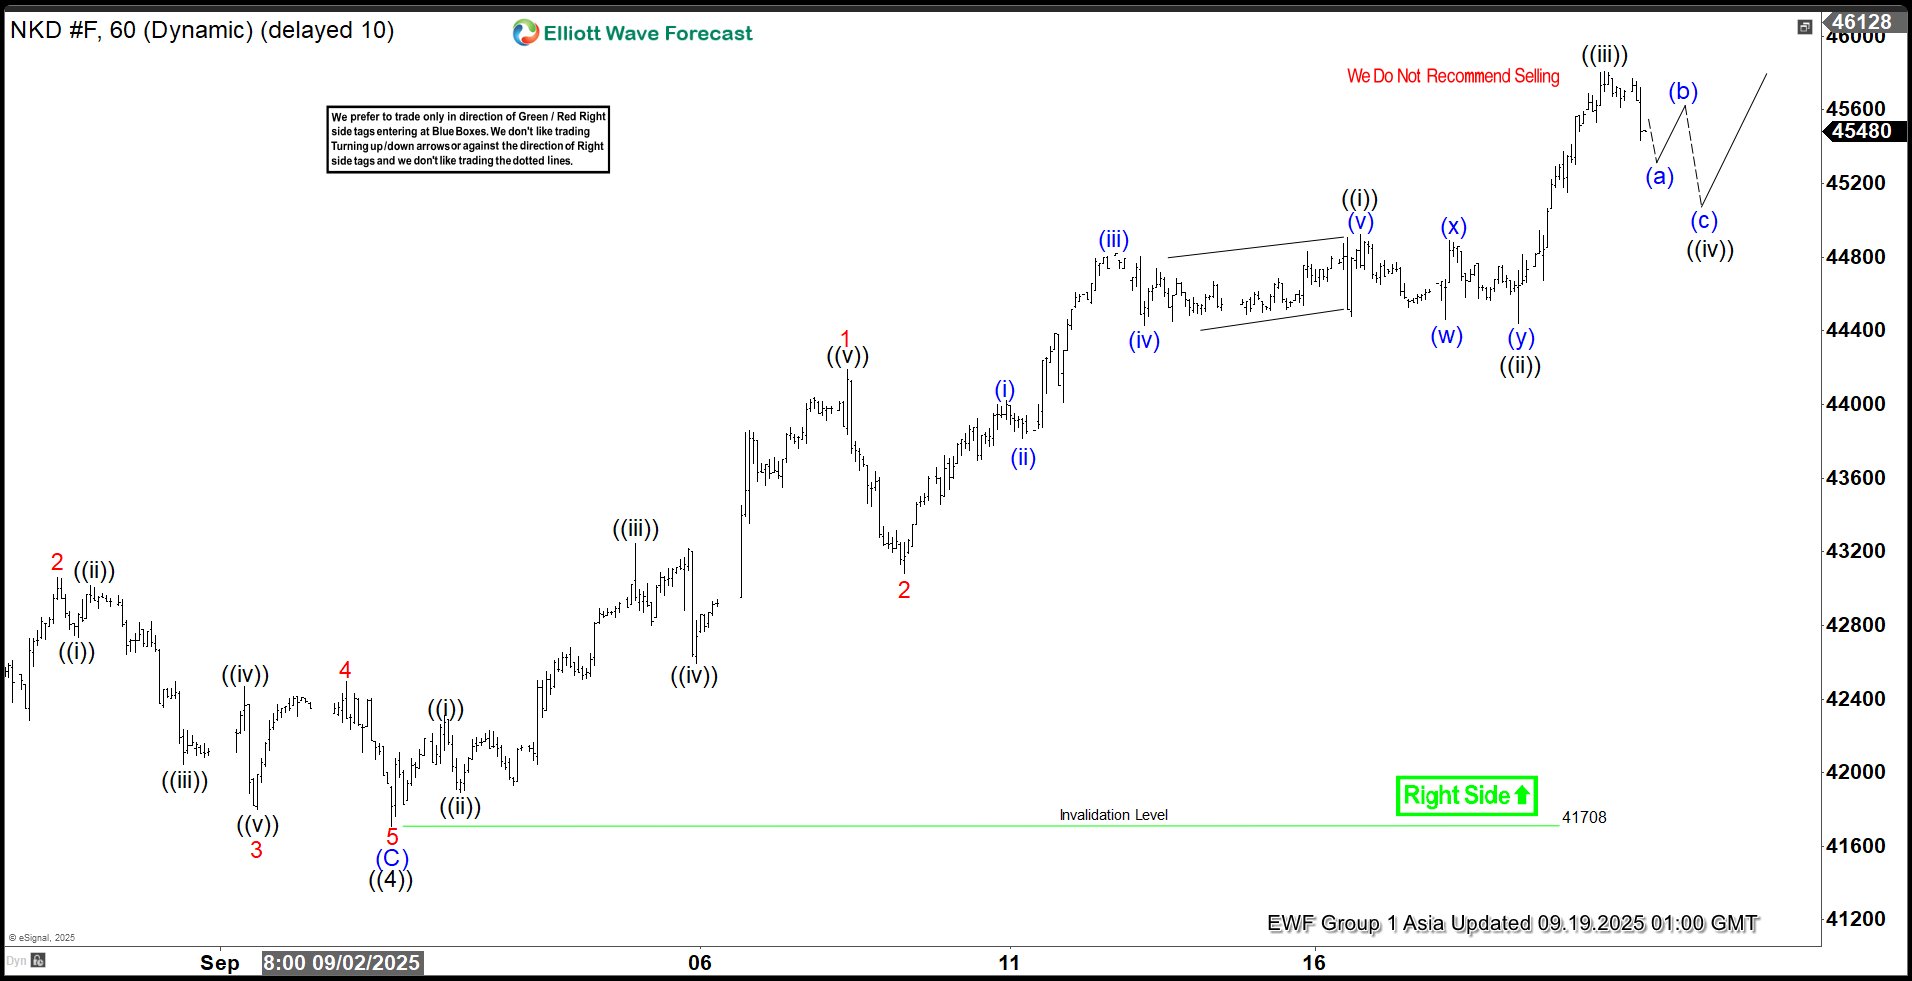
The short-term Elliott Wave analysis for Nikkei Futures (NKD) indicates that the pullback to 41,708 on September 2, 2025, marked the completion of wave ((4)). The Index has since resumed its upward trajectory in wave ((5)), structured as a five-wave impulse. From the wave ((4)) low, wave ((i)) concluded at 42,260, followed by a dip in wave ((ii)) to 41,890. The subsequent wave ((iii)) advanced to 43,245, with a pullback in wave ((iv)) ending at 42,595. The final leg, wave ((v)), peaked at 44,190, completing wave 1 in a higher degree. A corrective wave 2 followed, bottoming out at 43,080.
The Index has now embarked on wave 3, exhibiting another impulsive five-wave structure in a lesser degree. From the wave 2 low, wave ((i)) reached 44,925, and a pullback in wave ((ii)) concluded at 44,440. The Index then surged in wave ((iii)) to 45,810. A corrective wave ((iv)) is anticipated to retrace the cycle from the September 18, 2025, low, unfolding in a 3, 7, or 11 swing pattern before resuming higher. As long as the pivot at 41,708 holds, any near-term pullback should find support in a 3, 7, or 11 swing, setting the stage for further upside.
Nikkei (NKD) – 60 Minute Elliott Wave Technical Chart:
NKD – Elliott Wave Technical Video:
https://www.youtube.com/watch?v=FYA72fCZHkQ