Sample Category Title
Japan core CPI Slows to 2.7%, lowest since late 2024
Japan’s consumer inflation eased notably in August, with both headline CPI and core CPI (excluding fresh food) falling to 2.7% yoy from 3.1% in July, the lowest since November 2024. Despite the slowdown, inflation has remained above the BoJ’s 2% target for over three years.
Core-core CPI, which strips out both fresh food and energy and is seen as a key gauge of underlying price dynamics, ticked down to 3.3% yoy from 3.4%. The moderation suggests a gradual cooling in inflationary pressures, though price growth remains elevated relative to historical norms.
Food prices continued to drive the cost-of-living squeeze, with processed food up 8.0% yoy, though slower than July’s 8.3%. Rice inflation also eased to 69.7% yoy from an eye-watering 90.7%. Energy prices provided some relief, falling -3.3% yoy after a -0.3% drop in July.
NZ exports jump 23% in August, imports flat, deficit at NZD -1.2B
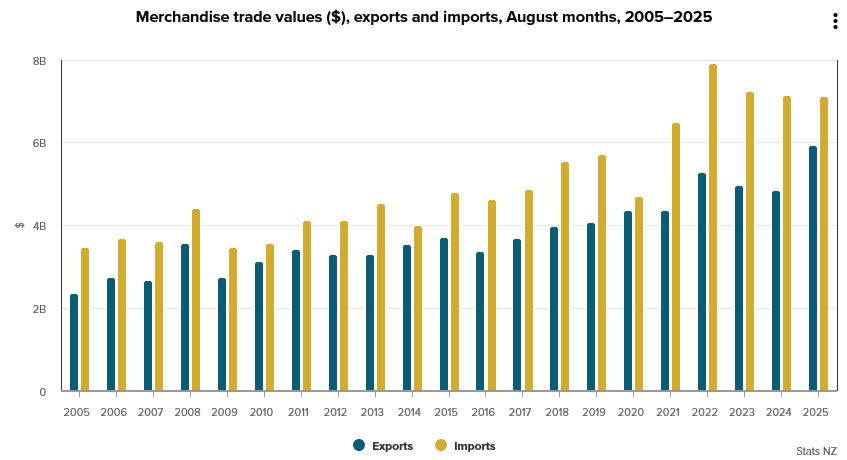
New Zealand recorded a goods trade deficit of NZD 1.2B in August as imports outpaced a sharp rise in exports. Goods exports climbed NZD 1.1B, or 23% yoy, to NZD 5.9B, supported by strong shipments to major partners. Imports slipped slightly, falling NZD 30m (-0.4% yoy) to NZD 7.1B, but remained elevated enough to keep the monthly balance in deficit.
Export growth was broad-based, with China (+35% yoy, the EU (+52%), Australia (+17%), and the U.S. (+14%) all showing strong gains. Japan was the notable exception, where exports fell -11% yoy, driven by a NZD 28m decline in milk powder, butter, and cheese.
On the import side, flows from China rose 6.2% yoy, while purchases from the EU fell -6.0% and from the U.S. declined -1.3%. The largest pullback came from South Korea, where imports dropped -32% yoy.
Cliff Notes: Countering Labour Market Risks
Key insights from the week that was.
In Australia, the August labour force survey validated the judgement that the labour market is softening once again. The three-month average pace of employment growth has decelerated to 1.8%yr, down from 2.5%yr in February. Underlying the headline trend, growth in ‘care economy’ employment has throttled back from its rollicking pace, while the market sector is slowly recuperating. A fall in participation allowed the unemployment rate to hold steady at 4.2% in August, but an upward drift is likely in coming months. While the downtrend in underemployment is seemingly at odds with the broader trend, this appears to be tied to a shrinking part-time share of total employment growth not an increase in labour utilisation by employers.
The August report is unlikely to shift the calculus for the RBA, with the Bank having already acknowledged that labour market conditions have “eased slightly” in its August decision communications. Westpac continues to expect the next RBA rate cut to be delivered in November, followed by two additional 25bp cuts in the first half of 2026.
Before moving offshore, a final note on the domestic manufacturing sector. The Q3 Westpac-ACCI Survey of Industrial Trends revealed conditions in the sector deteriorated into the second half of the year, the Actual Composite slipping from 51.5 in Q2 to a contractionary read of 48.8 in Q3. This is consistent with private sector demand tracking a gradual but patchy recovery – with falling orders and weak output. Despite this, manufacturers’ optimism over the outlook is unwavering – the Expected Composite currently sits at an elevated 58.1. There is a risk these strong expectations are not met, especially if the economic recovery remains sluggish and uneven.
Over in New Zealand, GDP surprised materially to the downside in Q2, declining 0.9% in the quarter to be 0.6% lower over the year (WBC f/c -0.4%, -0.1%yr). Our New Zealand Economics team believe the RBNZ are likely to assess there is too much excess capacity in the economy and consequently accelerate the final stage of the easing cycle to counter the trend. The RBNZ is now forecast to cut by 50bps at their October meeting and a further 25bp in November to 2.25% (previously we expected two 25bp cuts to a low of 2.50%). The trough rate for policy is expansionary, and so momentum should pick up into 2026. Monetary policy will likely need to be rebalanced from late-2026, but the precise timing will depend on the pulse of the economy over the coming 6-12 months.
Further afield, the focus was on major central banks.
The FOMC cut the fed funds rate by 25bps to a mid-point of 4.125% as expected at the September meeting. The guidance in the statement and press conference made clear that risk management is the Committee’s priority, while the revised forecasts highlighted the degree of uncertainty that remains over the outlook. On a median basis, the updated forecasts are sanguine and consistent with monetary policy being effective in managing inflation and demand. GDP growth has been revised up. It is now only expected to be below trend in 2025 at 1.6% then at trend through 2026-2028, circa 1.8%. The unemployment rate is consequently forecast to peak at just 4.5% in late-2025 before edging lower through 2026-2028 to the ‘longer run’ full employment rate of 4.2%. Inflation is not expected to hinder the FOMC’s ability to manage demand risks, with PCE inflation forecast to abate from around 3.0% at end-2025 to 2.6% by late-2026 then 2.1% at the close of 2027. While the return of inflation to the medium-term target over the forecast period is ‘by design’, taken together the activity and inflation forecasts signal the consensus view of the Committee is that tariff’s effect on inflation is a one-off and that services inflation will continue to abate. This would allow the fed funds rate to be cut to 3.4% at end-2026 and 3.1% by end-2027 – a broadly neutral rate – on the FOMC’s expectation.
We see conflicting risks to the FOMC’s forecasts, believing that economic growth and the labour market are likely to come in weaker than the Committee are forecasting for 2025-2027, but also that inflation will show greater persistence. In the absence of recession, this mix is arguably most likely to result in a need to hold to a modestly restrictive stance through the forecast horizon. Whether our current 3.875% low for the cycle or a rate closer to neutral is seen over the coming 12 to 18 months will depend on the trajectory of the respective labour market / inflation trends away / to the FOMC’s mandate. Only the data flow will be able to adjudicate on progress and guide on the evolving risk outlook.
North of the border, the Bank of Canada also cut rates by 25bps to 2.50% as tariffs continue to affect activity while inflation pressures abate. The Governing Council assess that "shifts in trade continue to add costs"; how this dynamic impacts activity and inflation will determine future policy steps.
Across the pond, the Bank of England deliberated on the latest labour market and inflation data and decided to hold the bank rate at 4.0% in a 7-2 split decision. The statement suggests the MPC remain attuned to upside inflation risks – both "existing or emerging". The August CPI gave support for this approach, price growth accelerating to 0.3% in the month while the annual figure remained at 3.8%. Services inflation remains stubbornly near 5.0%yr, printing at 4.7%yr in August.
The MPC will continue to take a 'gradual and careful' approach to further easing, with the timing to depend on progress with disinflation and downside risks to activity. We view a one cut per quarter pace as a fair expectation; though, if inflation remains sticky, there is a risk of the November cut being delayed. The MPC also decided to slow the pace of quantitative tightening in their annual review; members now expect to reduce the balance sheet by GBP70bn a year from GBP100bn previously. Of the GBP70bn, around GBP21bn will be through active sales and the rest through bonds maturing. The decision follows volatility in Gilt markets and a similar decision by the Bank of Japan earlier this year.
A final point on China. This week’s August data round highlights that, while continuing to experience success with trade and despite burgeoning equity market momentum, consumer-related sub-sectors of China’s economy remain weak and susceptible to downside risks. Most notably, new home prices declined again, continuing a 27-month long trend, and property investment’s contraction accelerated, now down 12.9%ytd. The year-to-date gain for total fixed asset investment also deteriorated to just 0.5%, well down on 2024’s 3.3%. Note, this outcome is only partly due to the moribund state of housing construction; key high-tech manufacturing sectors have pulled back on current investment following rapid expansion over recent years, their focus now turning to the effective and profitable implementation of new capacity. At this stage in China’s economic development, continued rapid growth in new manufacturing capacity is unsustainable; equally, the contribution from trade must moderate. As such, it is important October’s Plenum deliver a consumer centric five-year plan for 2026-2031, with an immediate focus on ending property price and investment declines and means to fuel confidence over future income growth. Without such steps, GDP growth in the mid 4%’s from 2026 will likely prove unsustainable, as discussed in our September Market Outlook.
Gold (XAU) and Silver (XAG) Find Selling Pressure from Post-FOMC Stronger US Dollar
Gold and Silver are subject to immediate pressure as the US Dollar regains strength and reputation after yesterday's FOMC meeting.
The challenged independence of the Fed was a major driver behind the immense rally metals enjoyed from late August into early September, as Powell’s shift in tone from the Jackson Hole conference cast doubt on the Fed’s consistency amid still high inflation.
Yet the dovish stance advocated by Bowman and Waller, seen as President Trump's protege-appointees ahead of the Sep FOMC—was vindicated by subsequent NFP misses and the downward revisions in BLS data.
This is leading to the Federal Reserve regaining back some of its lost confidence throughout the past few months.
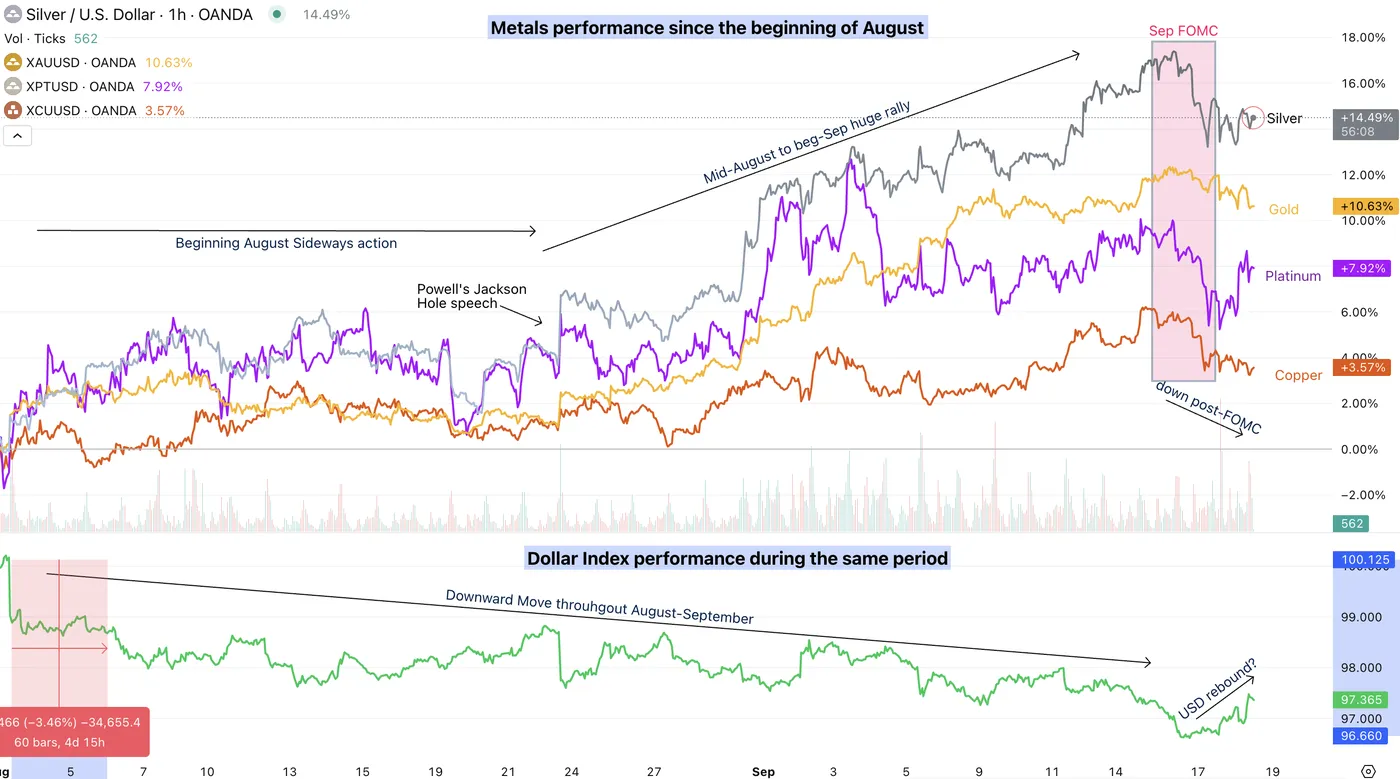
Dollar Index and Metals comparative Performance since beginning August, September 18, 2025 – Source: TradingView
Silver rallied 18.67% from its July 31st trough to its Tuesday peak, while Gold surged from $3,268 on July 30th to fresh all-time highs at $3,707.
Despite the ongoing pullback, prices remain near their highs.
Still, the balance is tilting towards a more neutral trend: With Powell delivering a less dovish message than markets had priced in, the renewed resilience of the US Dollar could set the stage for tighter price action ahead.
Let's dive into two timeframe charts for both Gold (XAU/USD) and Silver (XAG/USD) to see where the current trading takes us and where to look going forward.
Gold and Silver two-timeframe picture
Gold (XAUUSD) Daily Chart
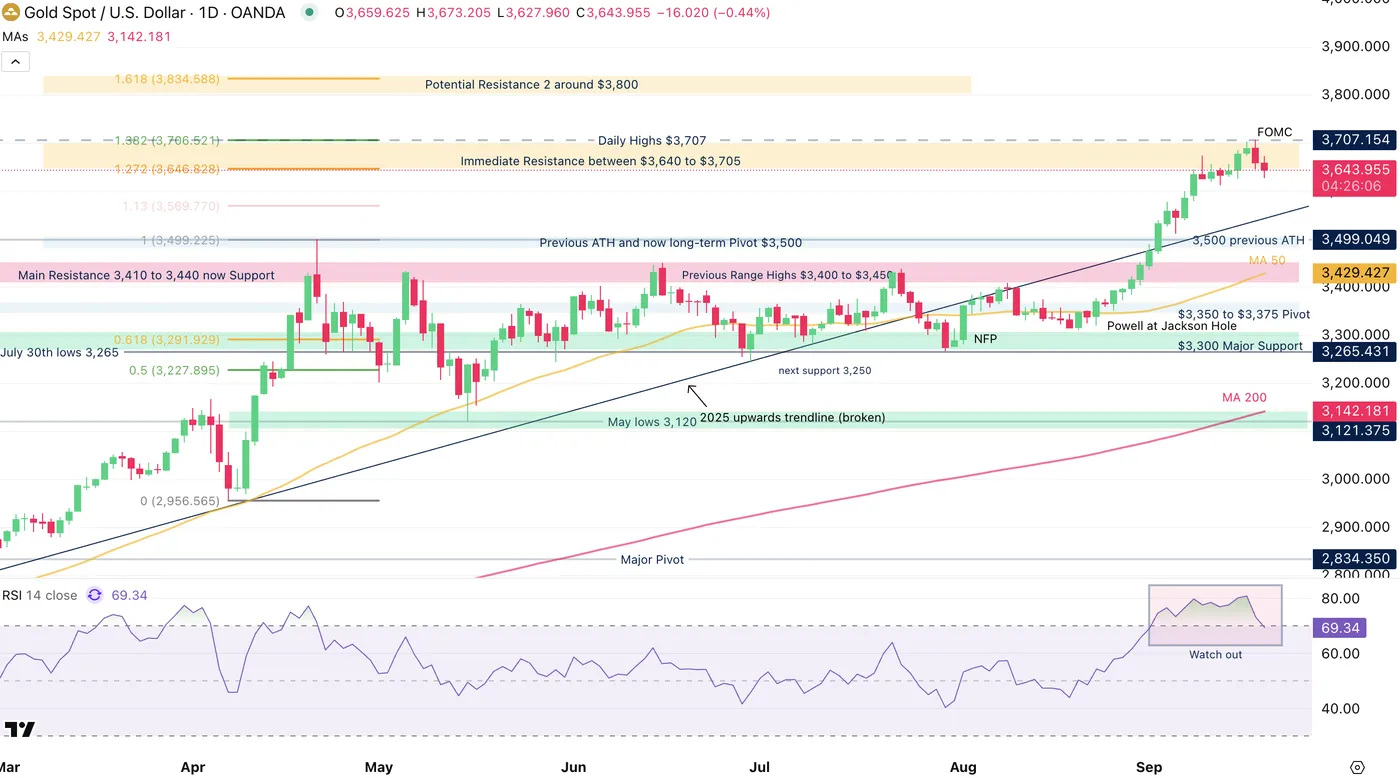
Gold (XAUUSD) Daily Chart, September 18, 2025 – Source: TradingView
Gold responded remarkably to the technical-Fibonacci induced resistance mentioned in our most recent Gold analysis.
We precedently expressed how overbought levels don't imply tops, particularly amid strong performance and momentum.
However, Daily RSI is starting to shape downwards and may not help to sustain the current levels.
There is still an ongoing consolidation that is happening from the intermediate lows, which demands a closer look.
Gold (XAUUSD) 2H Chart and levels
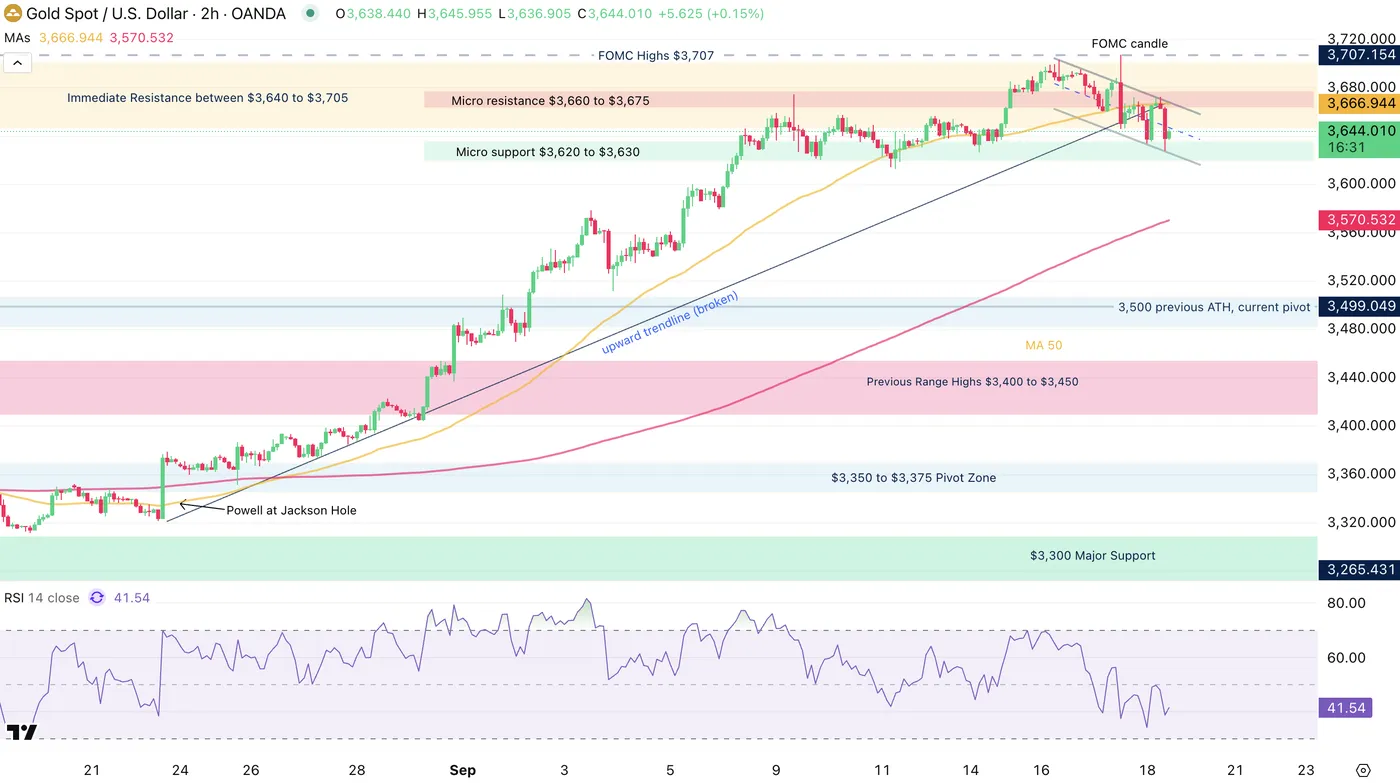
Gold (XAUUSD) 2H Chart, September 18, 2025 – Source: TradingView
Selling momentum is currently stalling but the bigger timeframe outlook is showing signs of slowdown within the current trend, particularly when seeing the broken upward trendline that led to the new $3,707 All-time Highs.
Look for breakouts either above or below the Micro support and resistance zones, with their levels detailed just below.
Levels of interest for Gold trading:
Support:
- Micro support $3,620 to $3,630
- Previous ATH and now long-term Pivot around $3,500 (+/- $15)
- Previous Range Highs $3,400 to $3,450 (minor support)
- $3,300 Major Support
- $3,000 Main psychological level
Resistance and potential technical targets (due to all-time highs, can only use potential targets):
- Micro resistance $3,660 to $3,675
- FOMC and All-time highs Highs $3,707
- Fibonacci-Extension 1 from April Lows to April highs ($3,640 to $3,705) (Immediate resistance)
- Potential, Fibonacci-Extension 2 from 2018 to Oct 2024 induced target: $3,750 to $3,815 (Purple square on Weekly)
Silver (XAGUSD) Daily Chart
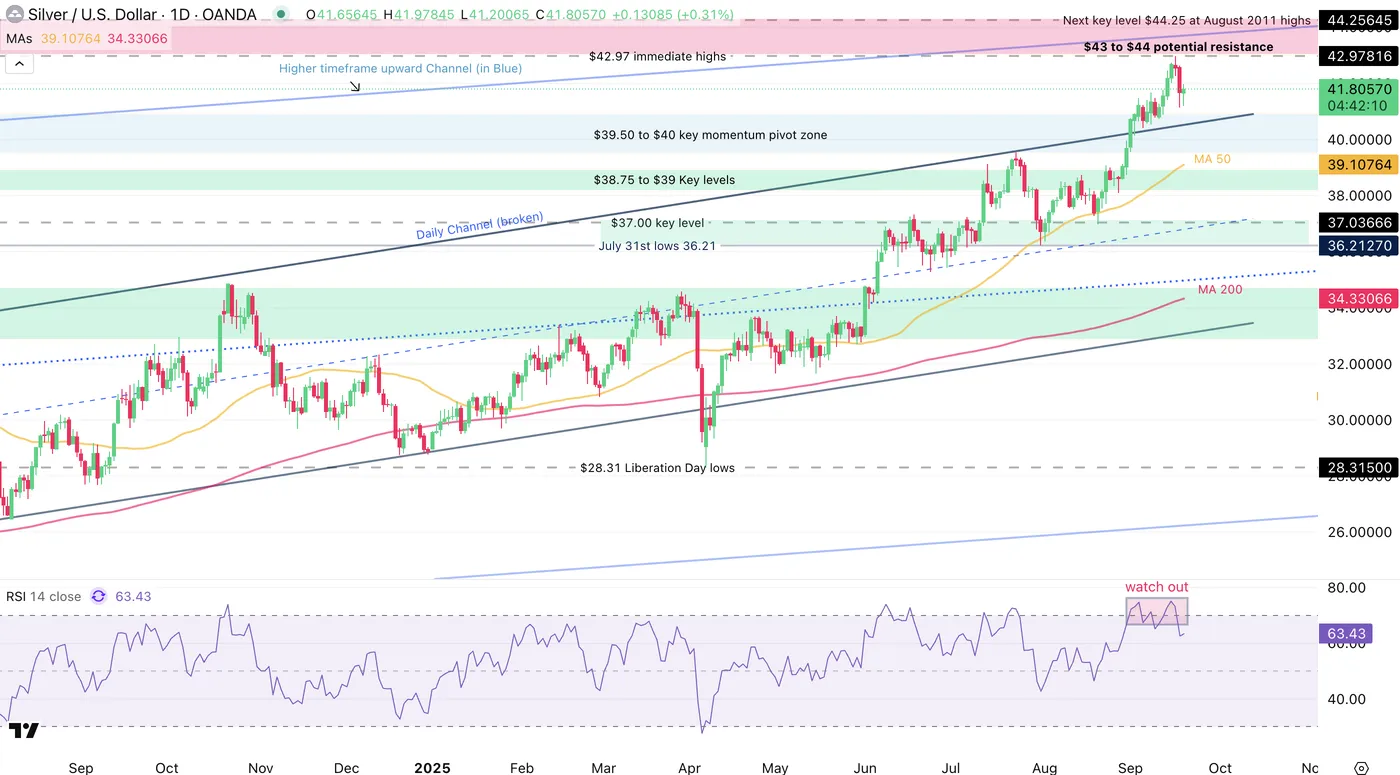
Silver (XAGUSD) Daily Chart, September 18, 2025 – Source: TradingView
Since our most recent Silver Analysis, prices did effectively break out of its daily upward channel but found technical resistance (to complement the fundamental resistance) at the higher bound of the Higher timeframe channel (in Blue).
Look at the Daily RSI also showing some type of divergence – Overall, despite the action still hanging at the highs, it looks like some intermediate correction might come into play.
Let's have a closer look.
Silver (XAGUSD) 2H Chart and levels
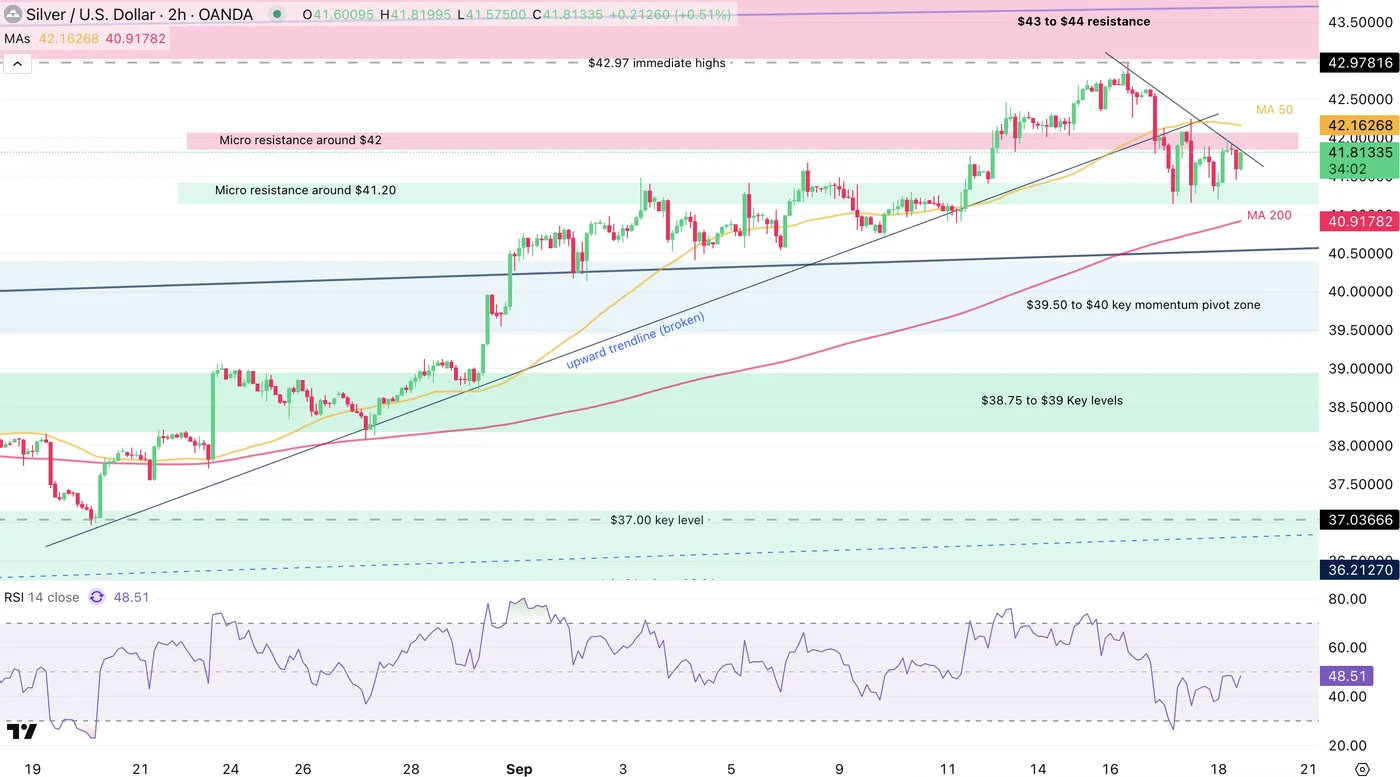
Silver (XAGUSD) 2H Chart, September 18, 2025 – Source: TradingView
The selling from this yesterday to this morning's session has stalled a bit and short-term momentum is back to neutral.
Prices are now contained between an short-term resistance and support zone, in the ongoing $41.20 to $42 range.
Levels to watch for Silver (XAG) trading:
Resistance Levels:
- $42 psychological level and micro-resistance
- 50-Period MA 50 42.17
- $43 to $44 resistance (Most recent peak $42.97)
- August 2011 $44.25 top
Support Levels:
- Micro resistance around $41.20
- $39.50 to $40 key pivot zone
- $38.75 to $39 Key levels
- 2012 Highs Support around 37.50
Safe Trades!
USDCHF Wave Analysis
USDCHF: ⬆️ Buy
- USDCHF reversed from support zone
- Likely to rise to resistance level 0.8000
USDCHF recently reversed up from the support zone located between the pivotal support level 0.7865 (which stopped the sharp downtrend in June), lower daily Bollinger Band and the support trendline of the daily down channel from July.
The upward reversal from this support zone will mostl likely form the daily Japanese candlesticks reversal pattern Morning Star – if the price closes today near the current levels.
Given the strength of the support level 0.7865 and the oversold daily Stochastic, USDCHF can be expected to rise to the next round resistance level 0,8000 (former support from August).

NZDUSD Weakens Sharply After FOMC, Losing 2% in Two Days
The Kiwi’s slide has been one that hasn't been seen in a while, with NZDUSD dropping 2% in just two sessions.
The pair had initially climbed ahead of the FOMC, driven by dovish concerns around the Fed and sudden Dollar-hedging that briefly pressured the DXY (sending the US Dollar down, hence the pair shooting upwards).
However, Powell’s balanced tone quickly flipped that narrative, erasing the priced-in dovishness observed in the SEP, dot plot, and FOMC statement.
“You can think of this, in a way, as a risk management cut,” Powell noted, striking a cautious stance around future cuts that steadied the USD.
There are still 25 bps of cuts priced at each of the two meetings left in 2025.
Strong US Jobless Claims (231k vs 240K exp) this morning reinforced that shift, further fueling a V-shaped reversal in the greenback.
Coupled with New Zealand’s atrocious GDP miss (-0.9% vs -0.3% q/q), the Kiwi was left in dismay, driving the pair sharply lower.
The current move is reflecting the repricing of more cuts for the RBNZ as the data has been very volatile for New Zealand throughout the year.
Expectations for a rate cut at the RBNZ upcoming meeting were at 82% last week and a 25 bps cut is now fully priced, with some extra premium in case of a larger 50 bps.
The NZ OCR is at 3% and the upcoming meeting will be happening on October 8th.
Let's have a look at NZDUSD through a multi-timeframe outlook to see where this takes the major pair.
A parenthesis on the DXY chart: Look at its V-Shape reversal since yesterday!
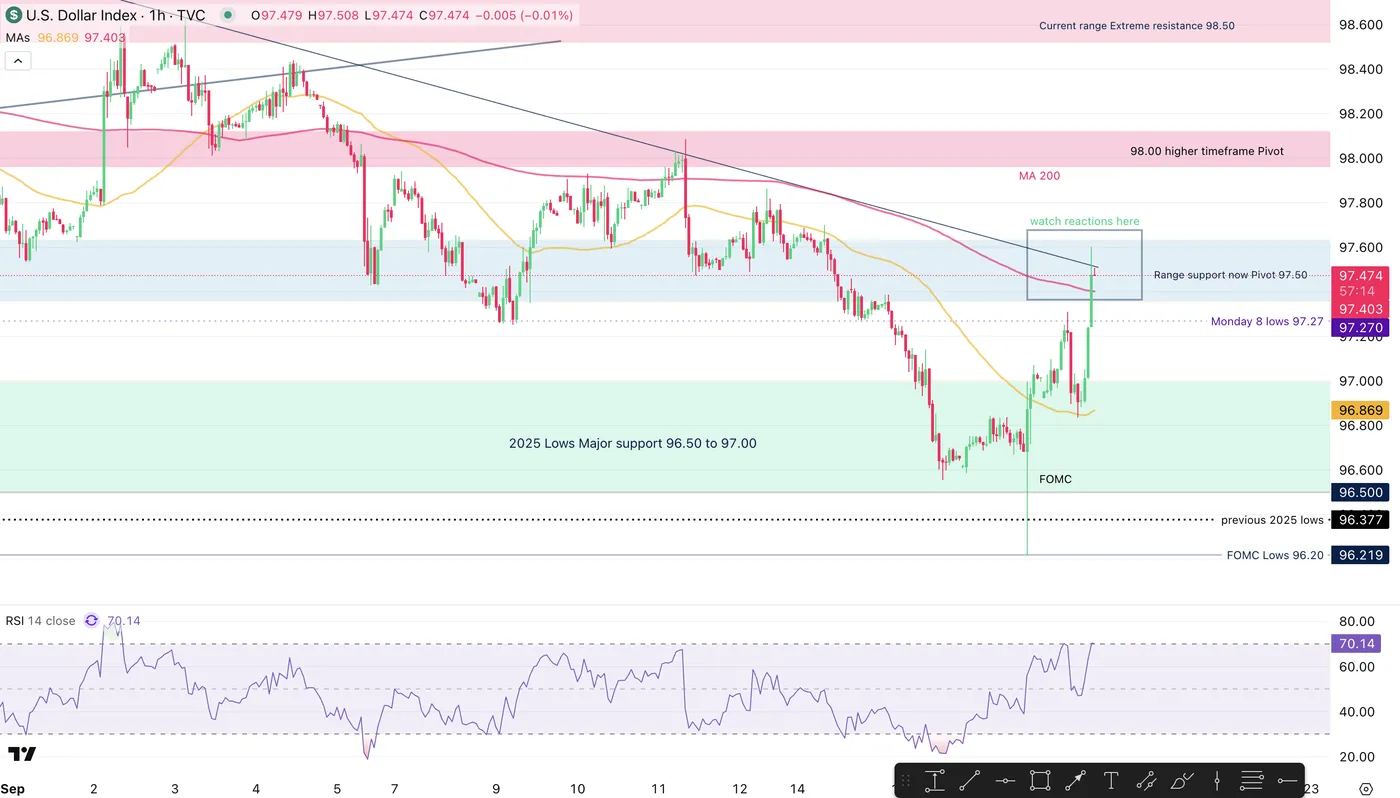
DXY 1H Chart, September 18, 2025 – Source: TradingView
NZDUSD 8H Chart
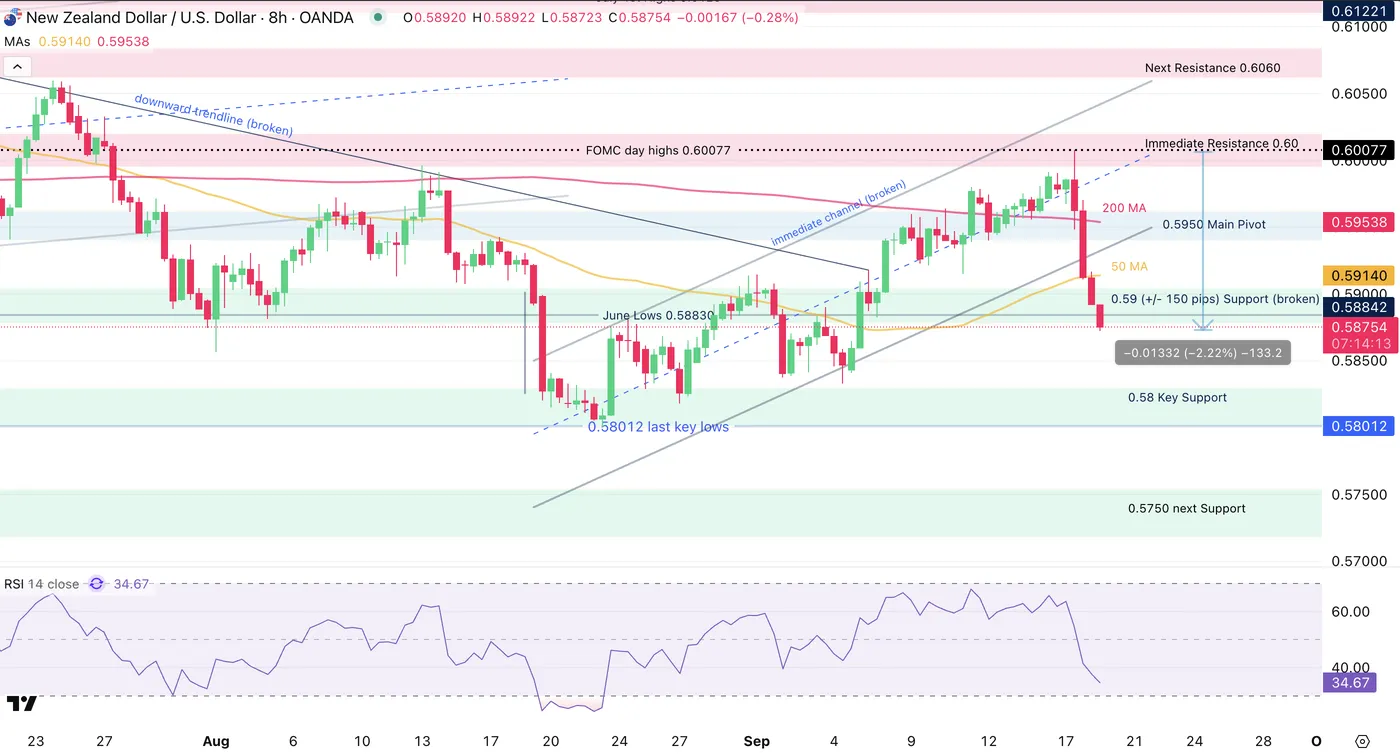
NZDUSD 8H Chart, September 18, 2025 – Source: TradingView
The downward shaping RSI right ahead of the FOMC was well located: Prices reached the 0.60 resistance before getting slammed lower as the Powell press-conference started.
RSI has shot down lower catching up with the ongoing move – The selling is showing no pity to the bulls, with prices consolidating slightly at the 0.59 Support which got swiftly broken.
Some immediate but small scale mean-reversion is stopping the descent, but the price action is brutal.
NZDUSD 2H Chart
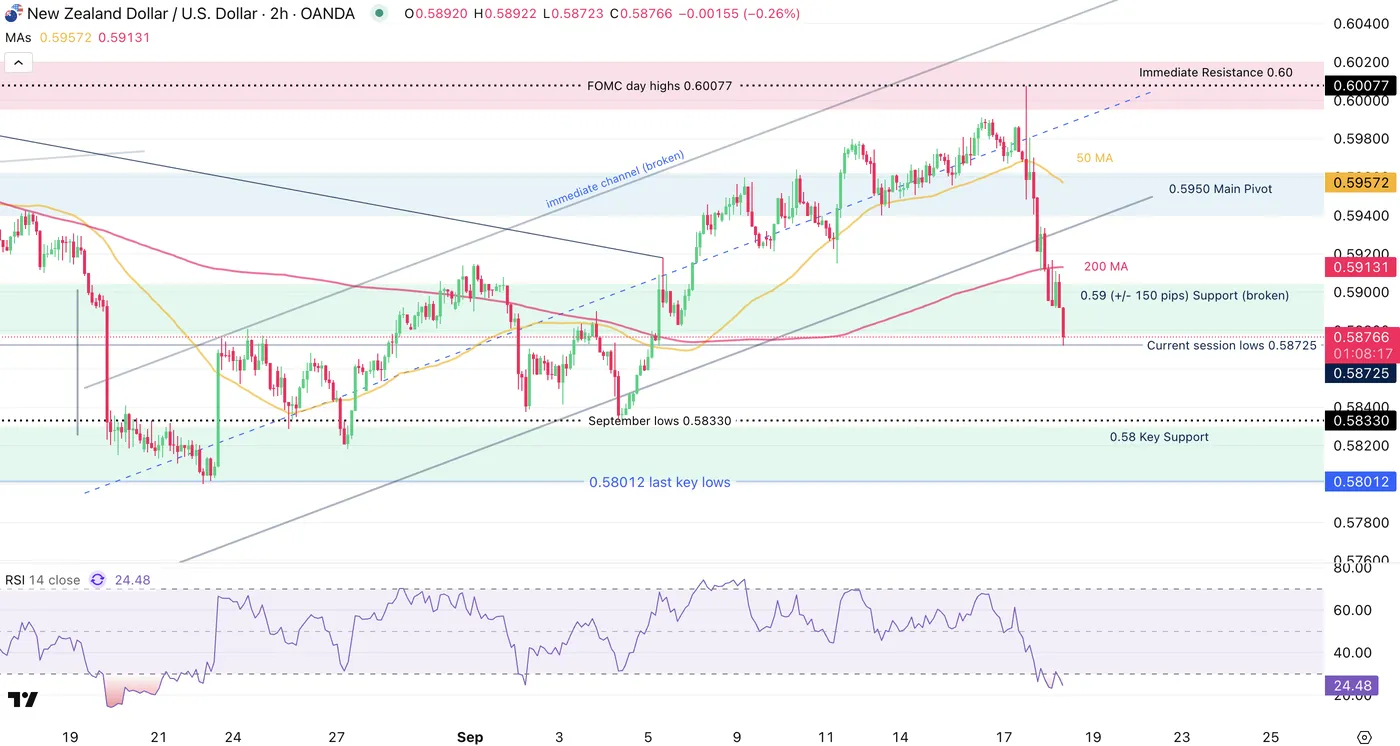
NZDUSD 2H Chart, September 18, 2025 – Source: TradingView
At its extreme, the ongoing move downwards is of about 1350 pips or 2.25% in the pair from peak to trough.
Particularly after very slow FX trading, such data officially reinstores volatility for the end of this year.
Get ready to see more volatile data and price swings for NZDUSD and other pairs looking forward.
Levels to watch for in NZDUSD trading:
Resistance Levels
- Immediate Resistance 0.60
- 0.5950 Main Pivot now Resistance
- 200-period MA 0.59150
Support Levels
- 0.59 (+/- 150 pips) Support (broken)
- Current session lows 0.58725
- September lows 0.58330
- 0.58 Key Support
Watch for further volatile swings looking forward and stay in touch with the latest data as every central banks will be looking at the news for their decision-making.
The Dollar index is reaching an interesting level and NZDUSD is taking a breather, stay locked in for upcoming action.
Safe Trades!
EUR/USD Technical: Euro Bullish Trend Intact Despite 1.2% Sell-Off After FOMC
The euro has continued to rally against the greenback from the 1 August 2025 low of 1.1392 and broke above its recent 52-week high of 1.1830 printed on 1 July 2025, within its medium-term uptrend phase in place since 13 January 2025
The EUR/USD hit a 4-year high of 1.1919 on Wednesday, 17 September, at the onset of the FOMC announcement of a 25 basis points (bps) interest rate cut to bring down the Fed funds rate to 4.00%-4.25%, and the release of the latest summary of economic projections (dot plot) that indicates two more projected interest rate cuts of 25 bps each before 2025 ends.
Post FOMC sell-off due to a less “dovish” Fed Chair Powell’s press conference
Thereafter, the EUR/USD erased all its early intraday gains and closed lower by -0.5% at the end of Wednesday, 17 September 2025, US session due to a less “dovish” Fed Chair Powell’s press conference.
Powell described the latest policy move as a “risk management” cut, emphasising that the Fed will remain data-dependent and proceed “meeting by meeting.” This stance reduced expectations of a deeper, new cycle of monetary policy easing.
The EUR/USD extended its decline in today’s Asia session, hitting a low of 1.1780, a drop of 1.2% from yesterday’s post-FOMC high of 1.1919.
The Fed funds futures market is still implying three interest rate cuts in 2026
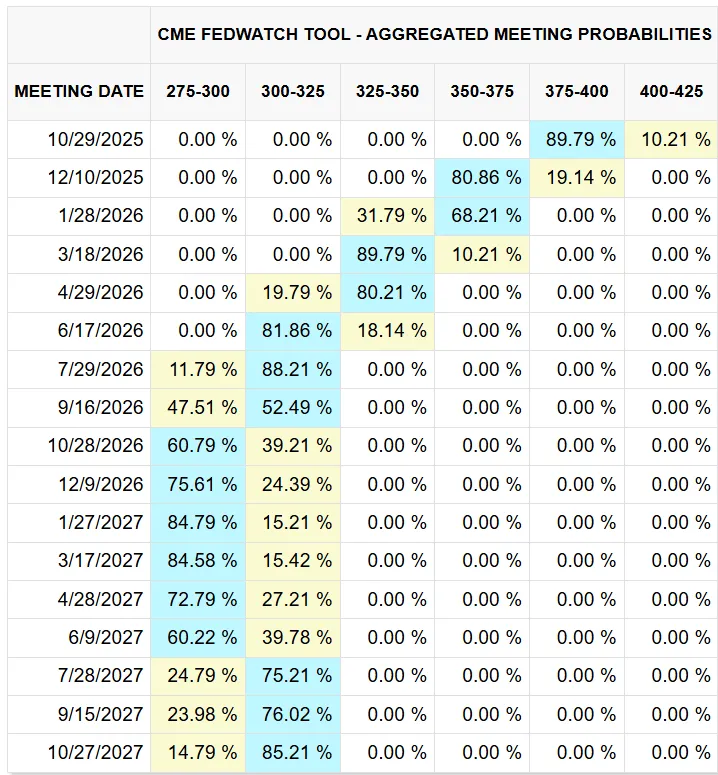
Fig. 1: Aggregated FOMC meeting probabilities on Fed funds rate as of 18 Sep 2025 (Source: CME FedWatch tool)
Despite Fed Chair Powell’s “meeting by meeting” rhetoric and the latest updated dot plot projections that show only a 25-bps cut in 2026, market participants in the Fed funds futures market are still expecting at least three interest rate cuts of 25 bps each in 2025 to bring the Fed funds rate to 2.75%-3.00% in 2026, according to the latest data from the CME FedWatch tool (see Fig. 1).
A continuation of dovish expectations implied by the Fed funds futures market is likely to cap the strength of the US dollar, in turn, creating a positive feedback loop back into the EUR/USD.
Let’s now examine the latest short-term (1 to 3 days) trajectory and key technical levels to watch on the EUR/USD.
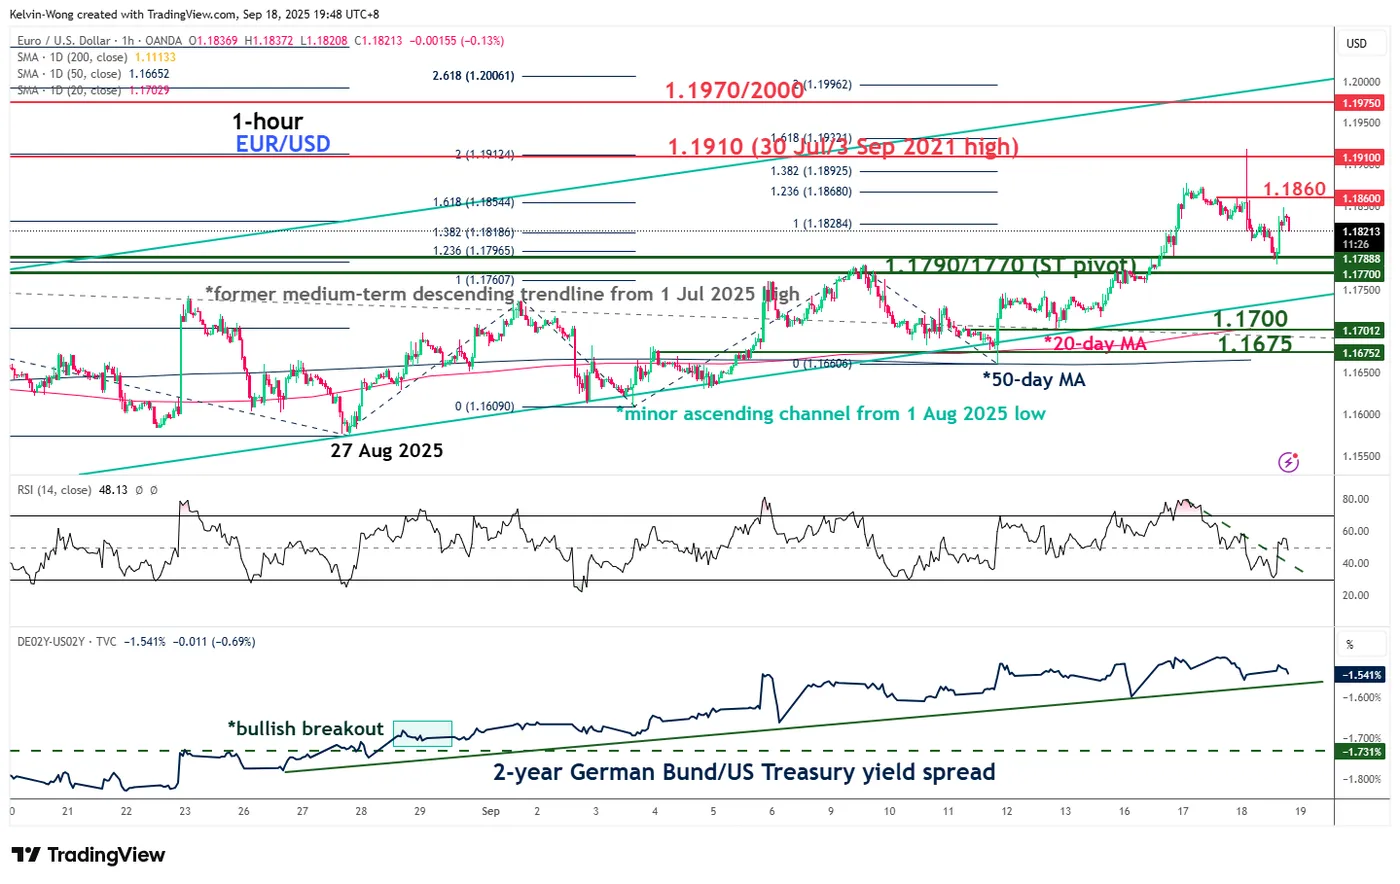
Fig. 2: EUR/USD minor trend as of 18 Sep 2025 (Source: TradingView)
Preferred trend bias (1-3 days)
The current decline of 1.2% seen in the EUR/USD from its post-FOMC high of 1.1919 is likely a minor corrective decline within its ongoing minor uptrend phase in place since the 1 August 2025 low of 1.1392.
Bullish bias on the EUR/USD above 1.1790/1.1770 key short-term pivotal support, and a break above 1.1860 sees a retest on 1.1910 before the next intermediate resistance comes in at 1.1970/1.2000 (Fibonacci extension and the upper boundary of the minor ascending channel) (see Fig. 2).
Key elements
- The EUR/USD has shaped an hourly bullish reversal candlestick at the 1.1790/1.1770 key short-term support.
- The hourly RSI momentum indicator has staged a bullish breakout from its parallel descending resistance after it hit its oversold level in today’s Asian session. These observations indicate a short-term bullish momentum revival for the EUR/USD.
- The yield spread between the 2-year German Bund and the US Treasury note has continued to trend higher (narrowing) from -1.63% on 16 September to -1.54% at the time of writing.
- This development indicates a relative decline in the yield attractiveness of the 2-year US Treasury versus its German counterpart, which in turn exerts downside pressure on the US dollar against the euro.
Alternative trend bias (1 to 3 days)
A break below the 1.1770 key short-term support invalidates the bullish scenario on the EUR/USD to see a deeper minor corrective decline to expose the next intermediate supports at 1.1700 (also the 20-day moving average) and 1.1675 (also the 50-day moving average).
Sunset Market Commentary
Markets
After the Fed decision yesterday it was up to the Bank of England (BoE) to assess whether the balance between inflation and growth/health of the labour market allows to continue policy easing. Contrary to the Fed, this wasn’t the case. The focus in this balancing exercise during summer turned again to overweight inflation risks. BoE currently assess that it still has some squeezing out to do on existing or even emerging persistent inflationary pressures, to sustainably return inflation to the 2% target. With this in mind, the BoE today decided (7-2 majority) to keep the policy rate unchanged at 4%. The committee still expects inflation to sightly rise in September from the 3.8% Y/Y August level, before returning to 2% thereafter. Still, the committee remains alert on the risk that the temporary uptick in inflation could put additional pressure on wages and price setting. Risks to inflation remain tilted to the upside. This only allows for a gradual and careful approach with respect to further withdrawal of policy restraint. In this respect, the BoE is not on a preset course. Aside from decision on the policy rate, the BoE also decided to slow its stock of bond purchases to £70 bln over the next 12 months (was £100 bln this year). In executing this process the bank will sell fewer long maturity gilts than Gilts at other maturities (40% ST, 40% MT and 20% LT). The BoE decision both on the policy rate and on QT were broadly as expected. Gilt yields today are rising between 0.5 bp (2-y) and +6.5bps (30-y), a move in line with Euro/German bond markets. Markets still see only about a 35 % chance of a BoE rate cut before the end of the year, with a next 25 bps stop not fully discounted before April next year. EUR/GBP is stuck in a tight range in the upper half of the 0.86 big figure (0.868).
Global markets, including US Treasuries, had to navigate yesterday’s Fed communication, which basically showed a high degree of fog/dispersion of views as the FOMC resumed reducing policy restriction yesterday in precautionary move to balance the risk of a further weakening in the labour market. In this respect, US jobless claims today provided a first (admittedly very mince, fragmented) reality check on markets’ sensitively to labour market data. Weekly claims declining from 264k to 231k (vs 240k expected) was enough for (short-term) yields to reverse an early decline of about 3 bps. US yields currently add 3-5 bps across the curve. The German yield curve bear steepens with the 2-y yield little changed while the 30-y adds 7 bps. Similarly, the dollar reversed a tentative intraday loss. DXY currently trades 97.45 (from 96.92). EUR/USD aborted an attempt to regain/hold north of 1.18 (currently 1.176). Despite an indecisive picture on Fed policy/global monetary conditions post yesterday’s FOMC decision, equities again were better bid with the EuroStoxx 50 adding 1.25% and the S&P 500 opening at a new record (+0.4%).
News & Views
The Norwegian central bank lowered its policy rate by 25 bps to 4% this morning. The moves caught some by surprise after (core) CPI, amongst others, last week came in to the upside of expectations. The Norges Bank indeed noted that inflation may remain elevated for a little longer than projected in June with only little spare capacity in the economy. The central bank had considered to keep the rate unchanged but eventually opted for a rate cut, stressing that the job of bringing inflation back to target has not been completed, but a cautious easing of monetary policy will pave the way for returning inflation to target without restraining the economy more than needed. “Cautious” in the Norwegian case means one more rate cut per year in the coming three years, according to the new forecast. The policy rate should be around 3-3.25% at the end of the policy horizon in 2028. The Norwegian krone whipsawed in the wake of the decision but EUR/NOK eventually trades virtually unchanged around the 11.59 opening levels.
Growth in New Zealand missed the -0.3% q/q expectation by a huge margin. The -0.9% contraction in Q2 fully wiped out the advance made in Q1. The economy is now 0.6% smaller than the same period in 2024. Growth in services stalled while the goods (-2.3%) and primary (-0.7%) industry sectors declined. The soft print spurred bets for a bumper rate cut by the New Zealand central bank (RBNZ). Markets attach a 33% chance for a 50 bps move in October. That would mean the RBNZ hit its end of year policy rate target (2.5%) made in August one meeting ahead. NZ swap yields tanked 12 bps at the front. The kiwi dollar fell to NZD/USD 0.59.
USD/JPY Mid-Day Outlook
Daily Pivots: (S1) 145.98; (P) 146.51; (R1) 147.54; More...
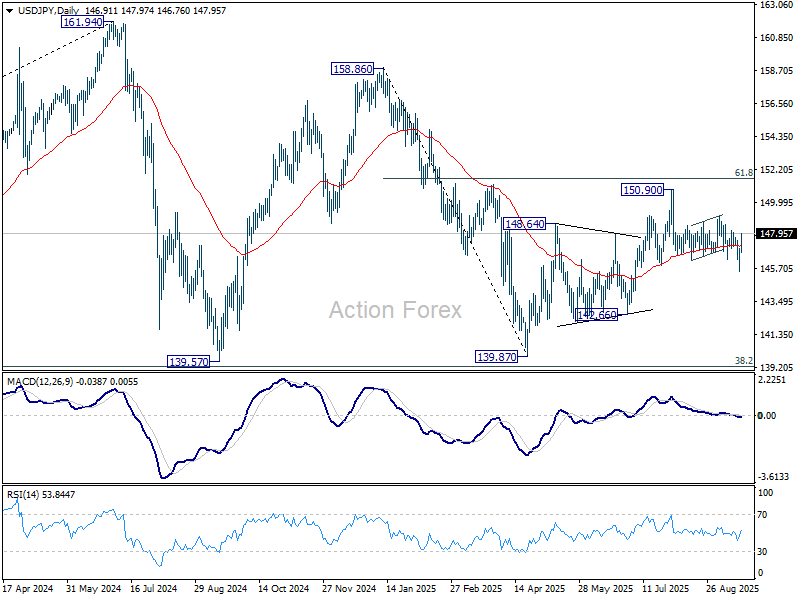
Intraday bias in USD/JPY stays neutral first. On the upside, break of 149.12 resistance will suggest that pullback from 150.90 has completed as a correction, and rise from 139.87 is still in progress. Further rise should then be seen back to retest 150.90 next. On the downside, below 145.47 will resume the fall to 142.66 support next.
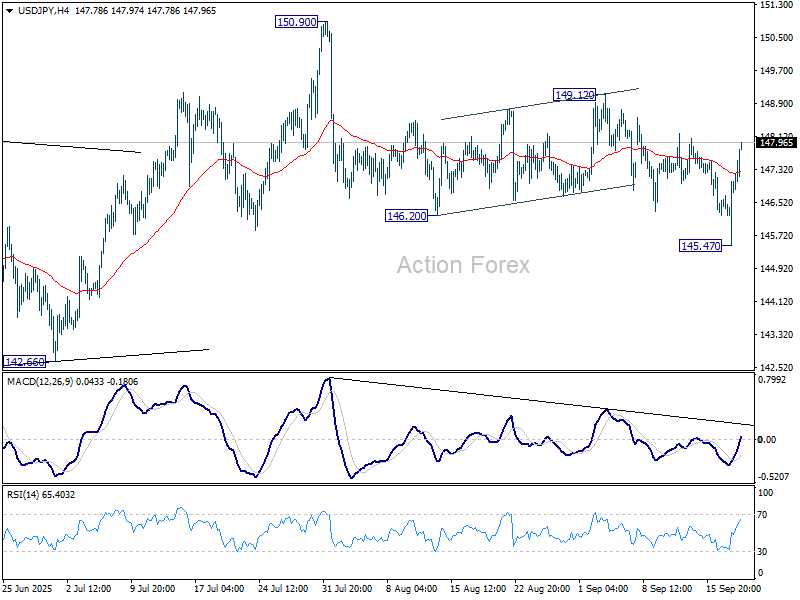
In the bigger picture, price actions from 161.94 (2024 high) are seen as a corrective pattern to rise from 102.58 (2021 low). Decisive break of 61.8% retracement of 158.86 to 139.87 at 151.22 will argue that it has already completed with three waves at 139.87. Larger up trend might then be ready to resume through 161.94 high. In case the corrective pattern extends with another fall, strong support is expected from 38.2% retracement of 102.58 to 161.94 at 139.26 to bring rebound.