
Sample Category Title
EUR/AUD Daily Outlook
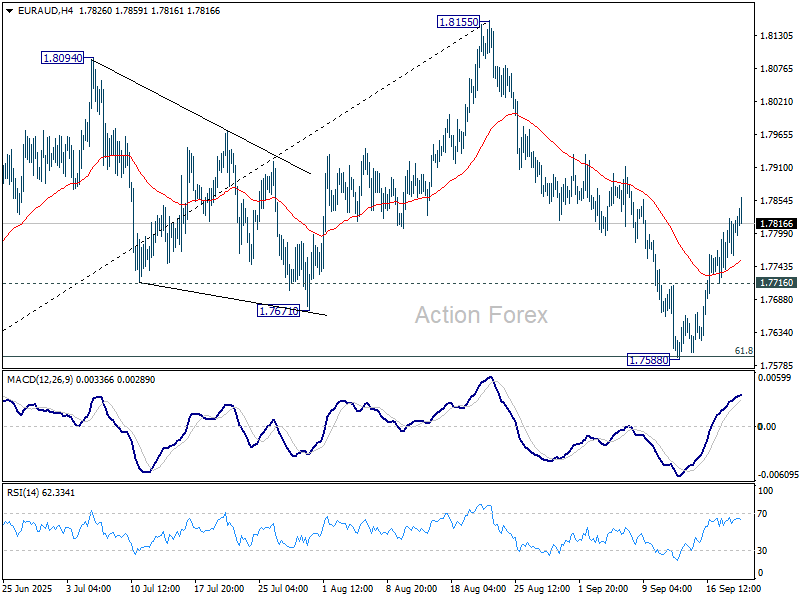
Daily Pivots: (S1) 1.7775; (P) 1.7801; (R1) 1.7854; More...
EUR/AUD's rebound from 1.7588 extended higher today and the breach of 55 D EMA (now at 1.7809) suggests that pullback from 1.8155 has completed, after defending 61.8% retracement of 1.7245 to 1.8155 at 1.7593. Intraday bias on the upside for retesting 1.8155 resistance. On the downside, though, below 1.7716 minor support will turn bias back to the downside for 1.7588 again.
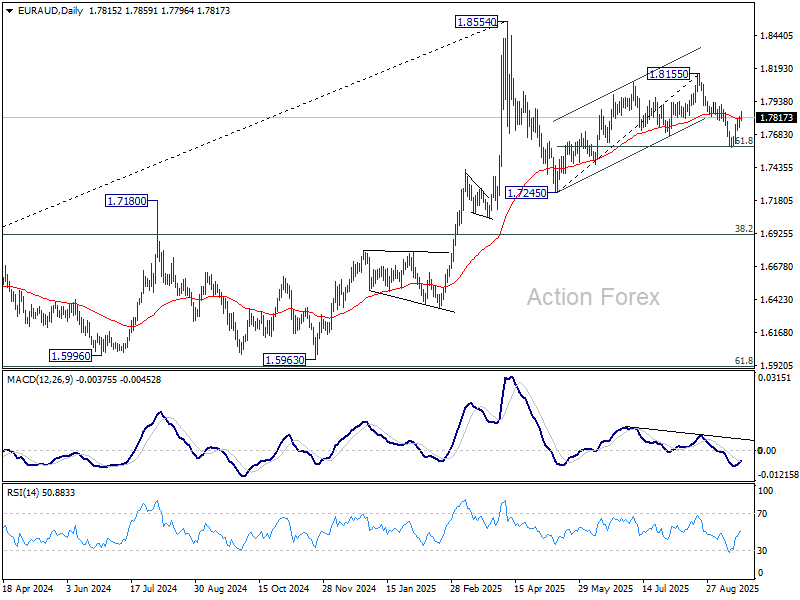
In the bigger picture, price actions from 1.8554 medium term top are seen as a corrective pattern. Deeper fall could be seen as the pattern extends, but downside should be contained by 38.2% retracement of 1.4281 (2022 low) to 1.8554 at 1.6922 to bring rebound. Uptrend from 1.4281 is expected to resume at a later stage.
EUR/JPY Daily Outlook
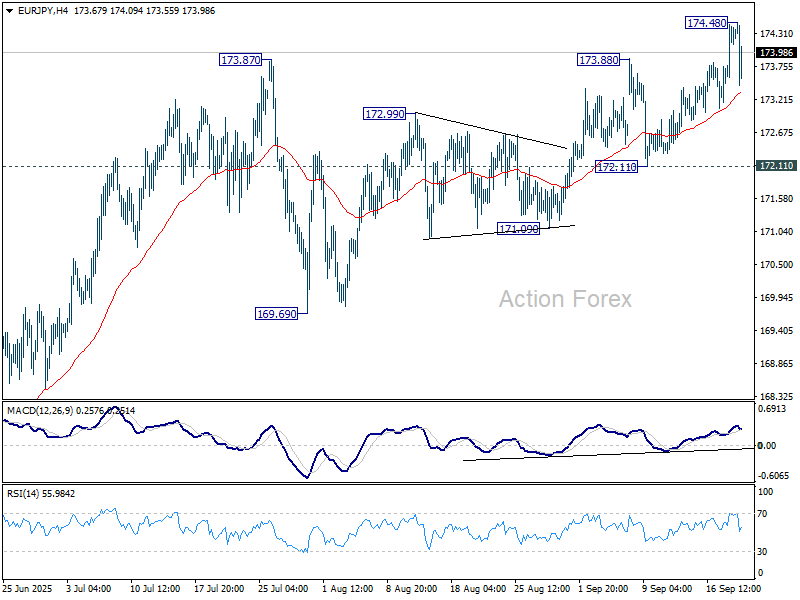
Daily Pivots: (S1) 173.76; (P) 174.11; (R1) 174.80; More...
Intraday bias in EUR/JPY is turned neutral with current retreat, and some consolidations would be seen below 174.48. Further rise is expected as long as 172.11 support holds. Above 174.48 will resume larger rise from 154.77 to retest 175.41 high. However, firm break of 172.11 support will confirm short term topping, and turn bias back to the downside for deeper pullback.
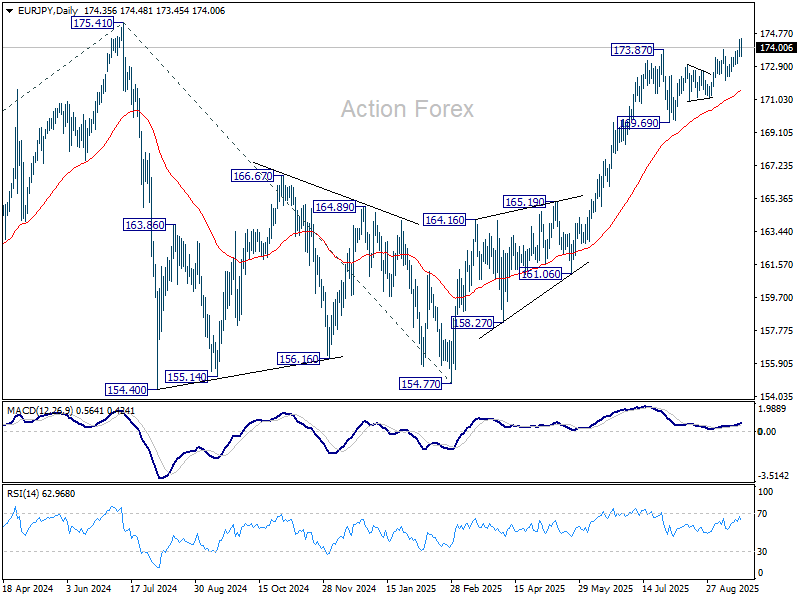
In the bigger picture, current rally from 154.77 is still tentatively seen as resuming the larger up trend. Firm break of 175.41 (2024 high) will confirm and target 61.8% projection of 124.37 to 175.41 from 154.77 at 186.31. However, sustained break of 169.69 support will delay this bullish case, and probably extend the correction from 175.41 with another fall.
Pretty Calm End of the Week
Markets
The Bank of England’s policy meeting won’t exactly go down as one of the more important ones in history. The key message on policy rates remains the same as before: stubborn inflation limits the room for rate cuts from the current 4%. CPI is expected to hit 4% in September and until clearer disinflation signs emerge, the policy rate isn’t going anywhere anytime soon. The annual quantitative tightening target for the period October ’25 through September ’26 was cut to £70bn from £100bn with an overweight in selling short (40%) and medium-term (40%) bonds. That move was broadly expected as well since the BoE doesn’t want to be the one adding even pressure to already vulnerable long-term gilts. Sterling slipped to around EUR/GBP 0.87 and the UK gilt yield curve bear steepened, be it in a move that had little to do with the outcome. We saw similar curve shifts in the US (+1 to 3.4 bps, but masking an intraday 10 bps+ move) and especially in Europe. German rates shot up 8 bps in the 30-yr tenor. The steepening is a bit odd in timing, particularly in the US as the bulk happened following a huge drop in US jobless claims (231k from 264k). Did Wednesday’s first of probably several Fed rate cuts in a labour market environment that’s seemingly not completely derailing trigger fear for renewed inflation momentum? Market-based inflation expectations have been trending higher towards their recent highs in any case the last couple of weeks, diverging from real yields. If it’s indeed the inflation component supporting yields higher it helps explain the decent stock performance (WS +1% in the Nasdaq). The dollar gained for a second day straight, pushing EUR/USD back below the 1.18 big figure. DXY rose to 97.4. The Japanese yen struggled ahead of the Bank of Japan decision (see below) but is in better shape since. USD/JPY trades around 147.47. The pair hasn’t gone anywhere in a tight 146-149 trading range ever since the start of summer.
We’re looking at a pretty calm end of the week if the economic calendar is of any guide, offering a chance to let underlying market dynamics play after a heavy central bank week. UK retail sales are among the final noteworthy data for today. They came in slightly better than expected (0.5% m/m headline, 0.8% core) but leave no marks on GBP. US President Trump and his Chinese counterpart Xi are expected to hold a call today to discuss the fate of TikTok but possible the broader trade topic as well. Fed’s Miran double television appearance is worth watching. Miran dissented on Wednesday by voting for a 50 bps cut instead of the delivered 25 bps.
News & Views
The UK GFK consumer confidence index dropped from -17 in Augst to -19 September. All measures of the index were down. UK consumers turned less confident both on their personal financial during the last year (-7 from -4) as well on expectations for their finances for the next 12 months (4 from 5), but both levels were still higher y/y. This also applies for the index or major purchases (-16 from -13, vs -23 last year). Consumers turned less confident on the general economic situation over the past year (-45 from -42) and the next 12 months (-32 from -30). The savings index dropped 8 points (22), to slightly below last year’s level. GFK analyses that ‘there’s an autumnal chill in the air this month’ and that ‘The August 7th decrease in interest rates does not appear to have provided any obvious boost to the financial mood of consumers or drawn attention away from day-to-day cost issues’. GFK fears that with tax rises expected in the November budget, the risk is that confidence inevitably falls.
Japanese August CPI excluding fresh food eased from 3.1% to 2.7%, due to utility subsidies. The core measure additionally excludes energy dropped only slightly from 3.4% to 3.3%, still firmly above the BoJ’s 2% target. The publication came as the BoJ debated its policy decision. The BoJ as expected left its policy rate unchanged at 0.5%, supported by a vote of 7-2, with two members voting for a 25 bps rate hike. The Bank of Japan also announced that it will start to sell ETFs and real estate investment trusts (J-REITs) meeting three principles including that it should avoid inducing destabilizing effects on financial markets. It will sell ETFs to the market at a pace of about 330 bln yen per year and J-REITs at about 5 bln yen per year. The 2-y Japanese yield (0.915%) jumped to the highest level since 2008 as expectations on frontloading a potential further rate hike rose. The yen strengthened from the USD/JPY 148 area to currently trade near 147.5. After opening higher, the Nikkei briefly dropped more than 2% off the intraday top levels after the announcement of ETF selling, but reversed a part soon (-0.4%).
Trump and Xi to Discuss TikTok Deal Amid Ongoing Trade War
In focus over the weekend
US President Trump plans to speak with Chinese President Xi today, as the two sides appear to be making ground on a TikTok deal. A deal for the social media app might act as a catalyst for improving the relationship between the two largest economies amid an ongoing trade war.
The data side is fairly quiet, with UK retail sales as the main print we will be watching.
Early Monday, China announces the Loan Prime Rates (LPR), which is widely expected to be unchanged. The LPRs are normally adjusted following changes to the 1-week reverse repo rate, which is the rate China uses to signal policy changes. This rate has not been changed since May, though. While there is pressure for more stimulus, broad based rate cuts may not be the preferred tool for China as they are also concerned about fuelling a liquidity driven equity bubble. We expect more targeted stimulus measures coming soon.
Economic and market news
What happened overnight
In Japan, the Bank of Japan stayed on hold and kept interest rates unchanged at 0.50%. The decision was in line with expectations, and no outlook report followed as it was a 'small' meeting. With a solid growth picture and real wage growth back in positive territory, we think conditions are lining up for a rate hike at the October meeting, where the decision can also be supported by an updated growth and inflation outlook. A potential snap election in the wake of the LDP-leadership election 4 October could also end up postponing a potential rate hike to December.
Prior to the decision, August CPI data was released and matched expectations. CPI inflation excluding fresh food, Bank of Japan's favourite measure) was at 2.7% y/y, staying above the Bank of Japan's target. However, the measure is largely driven by food, as core inflation (CPI excluding food and energy) remained at a more modest 1.6%.
What happened yesterday
In the US, President Trump made another move targeting the Federal Reserve Governor Lisa Cook. An application was sent to the Supreme Court, asking for permission to fire the Fed Governor. The ongoing battle is jeopardizing the Fed's independence as Trump seeks to gain influence on key rate decisions.
In Norway, Norges Bank cut policy rates by 25bp to 4.00% in a unanimous decision. The guidance that accompanied the decision was on the cautious side and excludes the probability of rate cuts for the next three meetings (Nov, Dec and Jan). Due to this, we modify our Norges Bank call and no longer pencil in a December 2025 rate cut. Given our economic projections we now pencil in four 25bp rate cuts in 2026 (Mar, Jun, Sep and Dec), which would bring the policy rate to 3.0% by the end of 2026.
In the UK, the Bank of England (BoE) held the Bank Rate at 4.00% in a 7-2 vote split (7 for hold, 2 for cut). The BoE maintained their guidance of a "gradual and careful approach to the further withdrawal of monetary policy restraint remains appropriate". They slowed the pace of quantitative tightening to GBP 70bn annually from GBP 100bn - close to expectations. We think a November rate cut remains alive, although 22 October CPI data will be crucial. See more in our Bank of England Review - Near term rate cuts remain an option, 18 September.
In Germany, the Bundestag approved the government's delayed 2025 budget. The government has a majority so it was expected, but some members could have diverged from the party line, as seen previously when Merz was sworn in as Chancellor. The approval shows that the government is working together and pushing through the planned draft budgets, with the new 2026 budget also likely to be passed.
Equities: Equities rose yesterday as markets digested the Fed's dovish stance. Interestingly, gains occurred alongside rising yields - a notable shift from the pattern seen since summer, when lower yields had primarily fuelled US growth stocks. This dynamic aligns with the "run it hot" narrative we discussed yesterday. Small caps stood out, in particular with the Russell 2000 gaining 2.5% compared to 0.5% for the S&P 500 and 0.8% for the Stoxx 600. The rally in small caps finally pushed the index above its previous record close from 2021.
That said, this was far from a broad-based rally. Sector dispersion was significant, with strength concentrated in technology and industrials. Semiconductor stocks were especially strong, supported by news of Nvidia taking a stake in Intel and an upbeat earnings report and guidance from Renishaw. Futures are slightly higher this morning while tech-heavy Asian markets are taking a breather after the 10% rise (Shenzhen, Kospi) the last month.
FI and FX: Global yield curve bear steepened yesterday, with European government bonds leading the way whereas moves were more contained in US treasuries. The global FX market radiated a rather calm, post-FOMC vibe with light flows and mostly contained volatility. The USD continued to strengthen broadly, with EUR/USD breaking below 1.18. Norges Bank combined their rate cut with a hawkish adjustment of the forward-looking rate path, but although NOK-EUR spreads widened significantly we saw EUR/NOK edging higher, emphasizing the importance of the global investment environment when trading the NOK. The Norges Bank cut had seemingly no spillover to market pricing on the Riksbank next week, but we did see Swedish government bonds and the SEK both underperform peers. Overnight, Bank of Japan kept the key rate steady at 0.50% and USD/JPY is currently sitting at 147.50.
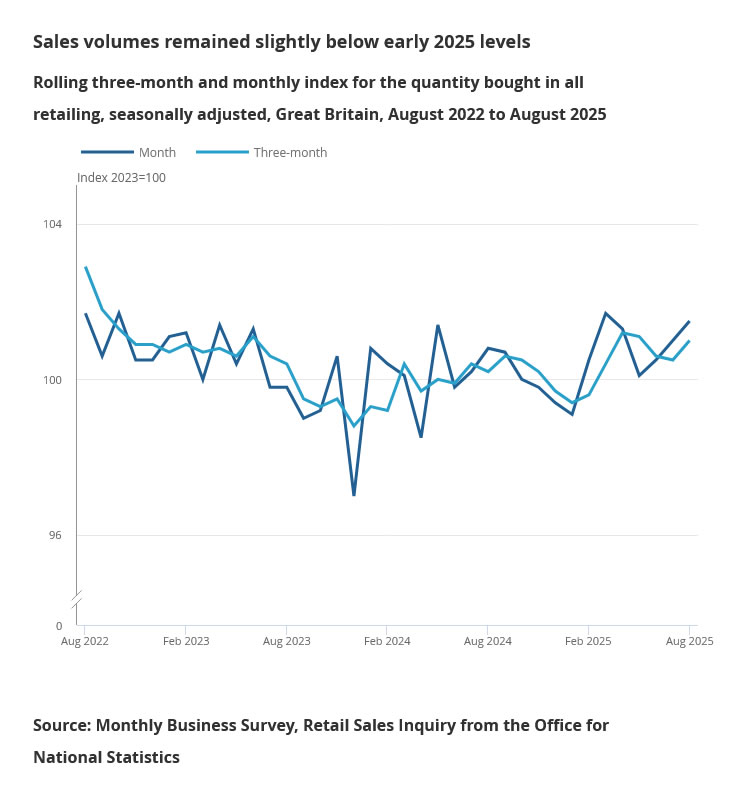
UK retail sales rise 0.5% mom in August, third monthly gain
UK retail sales rose 0.5% mom in August, slightly above expectations of 0.4%, marking a third consecutive month of growth. Still, volumes remain shy of their March 2025 peak, highlighting that the rebound is steady but incomplete.
The broader three-month trend still points to weakness, with sales down -0.1% compared to the three months to May. However, this marks an improvement from July’s -0.6% decline, indicating the downturn in spending is losing intensity.
BoJ Crashes the Party
The markets’ final verdict for US indices was clear: the S&P 500, Nasdaq and Dow Jones all hit all-time highs a day after the Federal Reserve (Fed) started cutting rates for an economy whose growth forecast it had just raised. The US small-cap index jumped 2.5%, while the Stoxx 600 and FTSE 100 rebounded as well, despite both the European Central Bank (ECB) and the Bank of England (BoE) delivering no rate cuts at their latest meetings and being expected to deliver none this year. I will come to yesterday’s BoE decision later, but first...
While US stock markets were hitting fresh records, a sharp slump in weekly jobless claims raised some eyebrows among bond traders about the health of the US jobs market. The US 2-year yield rebounded to 3.58%. But weekly figures tend to be volatile for multiple reasons, so I don’t think this changes the broader narrative of a weakening jobs market. I would be more concerned to see inflation pick up rather than a sudden return to strong US jobs numbers.
All in all, US and global assets popped the champagne yesterday—but Japanese equities are feeling hungover this morning. The Bank of Japan (BoJ) maintained its rates unchanged, which is positive because the next move is expected to be a rate hike, but it also announced it will start selling about ¥330bn worth of ETFs per year. Considering the BoJ has become a major holder of domestic assets, the announcement did little to support investor sentiment into the weekend. The Nikkei is down more than 2% at the time of writing.
The risk now is that this shift reverberates beyond Japan: tighter BoJ policy could counterbalance Fed-driven optimism, pressure richly valued US tech names and weigh on Europe’s luxury and cyclical exporters exposed to Asian demand. On the fixed income side, reduced Japanese demand for overseas bonds could push yields higher—especially long-term maturities in the DM markets—while FX moves could worsen matters if the yen strengthens and the BoJ continues its normalization, potentially triggering a reverse carry trade. In short, what looks like a step toward long-term normalization in Japan risks feeding near-term risk-off sentiment globally. The Japanese 10-year bond rose following the BoJ decision, while the US 10-year yield probably hit a bottom around 4%. Futures markets are mostly flat this morning, with FedEx up 6% in after-hours trading on strong results. We could see some profit-taking at the end of a central bank-heavy week: the Fed started cutting rates and indicated more cuts could come, but with wide divergence among members about next steps; the BoC cut its rates by 25bp, while the BoE and BoJ stayed on hold.
Speaking of the BoE: it maintained rates unchanged yesterday but took a dovish step by reducing QT. It will sell £70bn in assets over the next year instead of £100bn, focusing more on short-term gilts to ease pressure on long-term yields that affect pensions, insurers and government borrowing costs. Whether this will meaningfully boost UK fiscal headroom is yet to be seen. The 10-year gilt yield closed higher after starting the session elevated.
Broadly, long-maturity yields in developed markets remain under pressure. US tech valuations are still rich, and political and geopolitical tensions across the US, Europe, the UK and Japan remain front-page news. Today, Trump and Xi are scheduled to discuss trade, TikTok and other issues. While a further extension of the trade truce is possible, prolonged negotiations give China time to reduce technological dependence on the US—for instance, this week, Alibaba and ByteDance were instructed not to purchase Nvidia chips. And Huawei announced new AI chips and supercomputers rolling out from 2026 to 2028, aiming to compete directly with Nvidia through advanced memory and large-scale computing systems.
In the US, there is growing effort to broke large deals to bring manufacturing back home and reduce dependence on foreign suppliers, as well. Yesterday, Nvidia announced a $5bn investment in Intel for about a 4% stake and a collaboration to develop new chips for PCs and data centers, pairing Nvidia’s GPU and AI expertise with Intel’s CPU ecosystem. The deal could signal confidence in Intel’s turnaround—or a political win for the US administration aiming to revive a former national champion and boost domestic chip manufacturing. For Nvidia, it offers more control over CPU/GPU integration in AI infrastructure, as well as stronger political ties to the US government that also took a 10% stake in the company recently (!) Shares reacted accordingly: Nvidia rose 3.5%, Intel 23%, and both could continue benefiting from government-linked news. Notably, Huang said these discussions had been ongoing for a year, unrelated to recent developments, but the way Nvidia navigates political environments is both intriguing and high-stakes.
For other chipmakers, the Nvidia-Intel deal increases competitive pressure on AMD, which is not part of such politically strategic US alliances. Meanwhile, Chinese SMIC consolidated gains near all-time highs.
In summary, the week ends with a heating chip war, strong tech demand supported by softer Fed policy, but many looming questions regarding rich US valuations, ongoing political, geopolitical risks and multi-year high long-maturity yields.
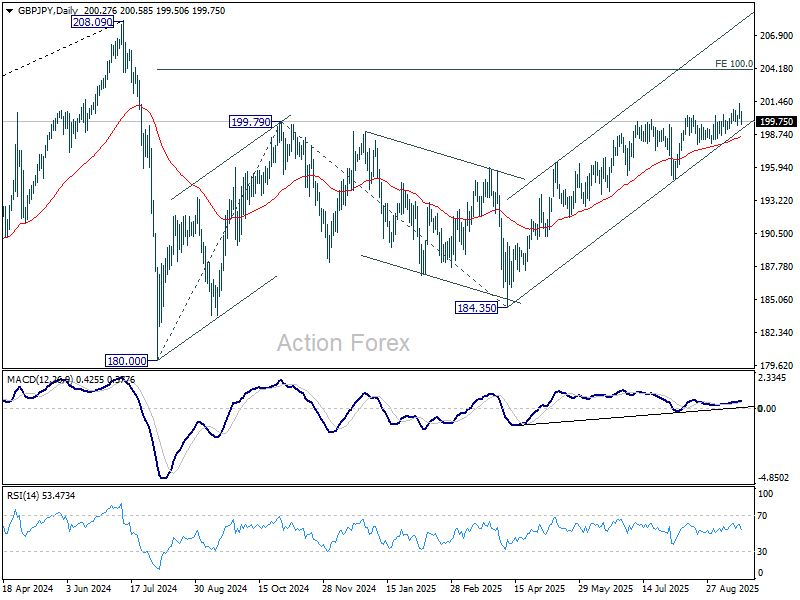
GBP/JPY Daily Outlook
Daily Pivots: (S1) 200.00; (P) 200.64; (R1) 201.22; More...
GBP/JPY spikes higher to 201.24 but quickly retreated. Intraday bias remains neutral first. Further rise is expected as long as 197.93 support holds. Firm break of 201.24 will target 100% projection of 180.00 to 199.79 from 184.35 at 204.14. However, considering bearish divergence condition in both D and 4H MACD, firm break of 197.93 will indicate bearish reversal and bring deeper fall back to 195.01 support first.
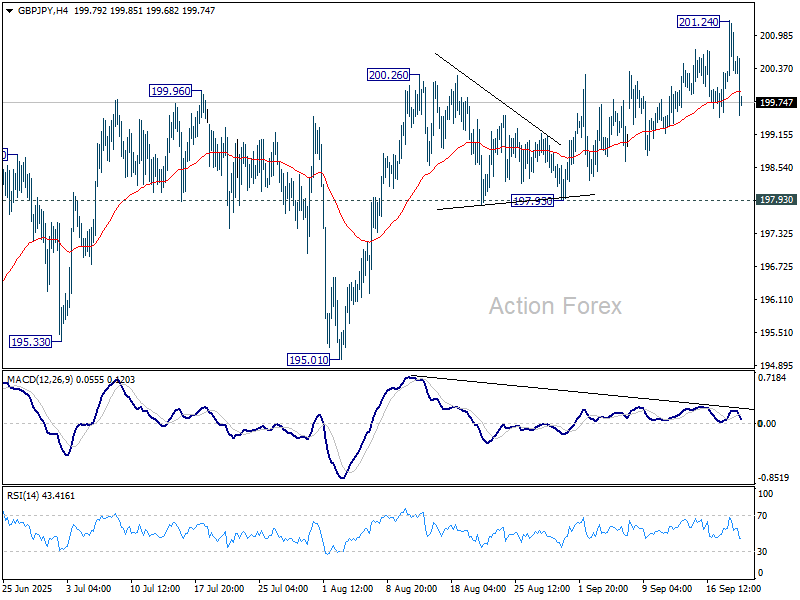
In the bigger picture, price actions from 208.09 (2024 high) are seen as a correction to rally from 123.94 (2020 low). The pattern might still extend with another falling leg. But in that case, strong support should be seen from 38.2% retracement of 123.94 to 208.09 at 175.94 to contain downside. Meanwhile, decisive break of 208.09 will confirm long term up trend resumption.
Yen Rebounds as BoJ Tilts Hawkish, Nikkei Retreats From Record
Yen staged a broad rebound today after the BoJ held rates steady at 0.50% but delivered a hawkish signal with two members dissenting in favor of a hike. The shift in the board underlined growing momentum toward policy normalization. At the same time, the Nikkei pulled back sharply from record highs reached earlier this week, reflecting investor caution around the prospect of tighter conditions.
The changing balance within the BoJ highlights a gradual move closer to resuming rate hikes, even as inflation pressures ease. Yet, political developments could complicate the path ahead. The departure of Prime Minister Shigeru Ishiba and uncertainty over his successor may encourage policymakers to tread carefully, waiting for a clearer political backdrop before committing to a move.
In currency markets, Kiwi remains the weakest performer of the week, weighed down by a shock contraction in Q2 GDP that fueled speculation of a deeper easing cycle by the RBNZ. The Aussie also lags following soft labor market data. Sterling is under pressure after the BoE left policy unchanged, with two members voting for a cut. By contrast, Swiss Franc leads the pack, followed by Loonie and Euro. Dollar and Yen are holding mid-table, though today’s rebound leaves the Yen better positioned than earlier in the week.
Looking ahead, focus will shift to upcoming data releases including Germany’s PPI, UK retail sales, and Canadian retail sales. While these could generate short-term volatility, they are unlikely to provide lasting direction heading into the weekend, with broader themes of central bank divergence still dominating market sentiment.
In Asia, at the time of writing, Nikkei is down -0.27%. Hong Kong HSI is down -0.02%. China Shanghai SSE is up 0.14%. Singapore Strait Times is down -0.17%. Japan 10-year JGB yield is up 0.04 at 1.641. Overnight, DOW rose 0.27%. S&P 500 rose 0.48%. NASDAQ rose 0.94%. 10-year yield rose 0.028 to 4.104.
BoJ holds with two members calling for hike, starts selling ETFs and J-REITs
The BoJ kept rates steady at 0.50% in September, but the 7–2 vote revealed a growing hawkish bias. Naoki Tamura and Hajime Takata broke ranks to support a rate increase, citing upside risks to inflation and progress toward achieving the 2% price stability target. Takata said that Japan has more or less achieved its inflation goal, while Tamura argued that the key rate should move closer to neutral given skewed risks to the upside.
Alongside the decision, the BoJ unveiled plans to shrink its massive balance sheet by selling assets. The Bank will sell ETFs at a pace of JPY 330B annually and J-REITs at JPY 5B, with the principle of minimizing market disruption. With its balance sheet at 125% of GDP—far larger than other major central banks—the BoJ’s move marks a notable shift toward normalization, even as rates remain unchanged for now.
Japan core CPI Slows to 2.7%, lowest since late 2024
Japan’s consumer inflation eased notably in August, with both headline CPI and core CPI (excluding fresh food) falling to 2.7% yoy from 3.1% in July, the lowest since November 2024. Despite the slowdown, inflation has remained above the BoJ’s 2% target for over three years.
Core-core CPI, which strips out both fresh food and energy and is seen as a key gauge of underlying price dynamics, ticked down to 3.3% yoy from 3.4%. The moderation suggests a gradual cooling in inflationary pressures, though price growth remains elevated relative to historical norms.
Food prices continued to drive the cost-of-living squeeze, with processed food up 8.0% yoy, though slower than July’s 8.3%. Rice inflation also eased to 69.7% yoy from an eye-watering 90.7%. Energy prices provided some relief, falling -3.3% yoy after a -0.3% drop in July.
NZ exports jump 23% in August, imports flat, deficit at NZD -1.2B
New Zealand recorded a goods trade deficit of NZD 1.2B in August as imports outpaced a sharp rise in exports. Goods exports climbed NZD 1.1B, or 23% yoy, to NZD 5.9B, supported by strong shipments to major partners. Imports slipped slightly, falling NZD 30m (-0.4% yoy) to NZD 7.1B, but remained elevated enough to keep the monthly balance in deficit.
Export growth was broad-based, with China (+35% yoy, the EU (+52%), Australia (+17%), and the U.S. (+14%) all showing strong gains. Japan was the notable exception, where exports fell -11% yoy, driven by a NZD 28m decline in milk powder, butter, and cheese.
On the import side, flows from China rose 6.2% yoy, while purchases from the EU fell -6.0% and from the U.S. declined -1.3%. The largest pullback came from South Korea, where imports dropped -32% yoy.
GBP/JPY Daily Outlook
Daily Pivots: (S1) 200.00; (P) 200.64; (R1) 201.22; More...
GBP/JPY spikes higher to 201.24 but quickly retreated. Intraday bias remains neutral first. Further rise is expected as long as 197.93 support holds. Firm break of 201.24 will target 100% projection of 180.00 to 199.79 from 184.35 at 204.14. However, considering bearish divergence condition in both D and 4H MACD, firm break of 197.93 will indicate bearish reversal and bring deeper fall back to 195.01 support first.
In the bigger picture, price actions from 208.09 (2024 high) are seen as a correction to rally from 123.94 (2020 low). The pattern might still extend with another falling leg. But in that case, strong support should be seen from 38.2% retracement of 123.94 to 208.09 at 175.94 to contain downside. Meanwhile, decisive break of 208.09 will confirm long term up trend resumption.
BoJ holds with two members calling for hike, starts selling ETFs and J-REITs
The BoJ kept rates steady at 0.50% in September, but the 7–2 vote revealed a growing hawkish bias. Naoki Tamura and Hajime Takata broke ranks to support a rate increase, citing upside risks to inflation and progress toward achieving the 2% price stability target. Takata said that Japan has more or less achieved its inflation goal, while Tamura argued that the key rate should move closer to neutral given skewed risks to the upside.
Alongside the decision, the BoJ unveiled plans to shrink its massive balance sheet by selling assets. The Bank will sell ETFs at a pace of JPY 330B annually and J-REITs at JPY 5B, with the principle of minimizing market disruption. With its balance sheet at 125% of GDP—far larger than other major central banks—the BoJ’s move marks a notable shift toward normalization, even as rates remain unchanged for now.
Post-Fed Twist: USD/JPY Bullish Reversal – Don’t Miss Out
Key Highlights
- USD/JPY started a fresh increase after a sharp drop to 145.50.
- It cleared a major bearish trend line with resistance at 147.50 on the 4-hour chart.
- The Fed’s interest rate cut sparked swing moves, but ultimately the bulls had the upper hand.
- EUR/USD and GBP/USD started a downside correction.
USD/JPY Technical Analysis
The US Dollar declined sharply against the Japanese Yen during the Fed rate decision. USD/JPY spiked to 145.50 before there was a sharp recovery.
Looking at the 4-hour chart, the pair climbed above the 146.50 and 147.00 resistance levels. More importantly, the pair cleared a major bearish trend line with resistance at 147.50. It opened the doors for more gains above the 50% Fib retracement level of the downward move from the 149.13 swing high to the 145.48 low.
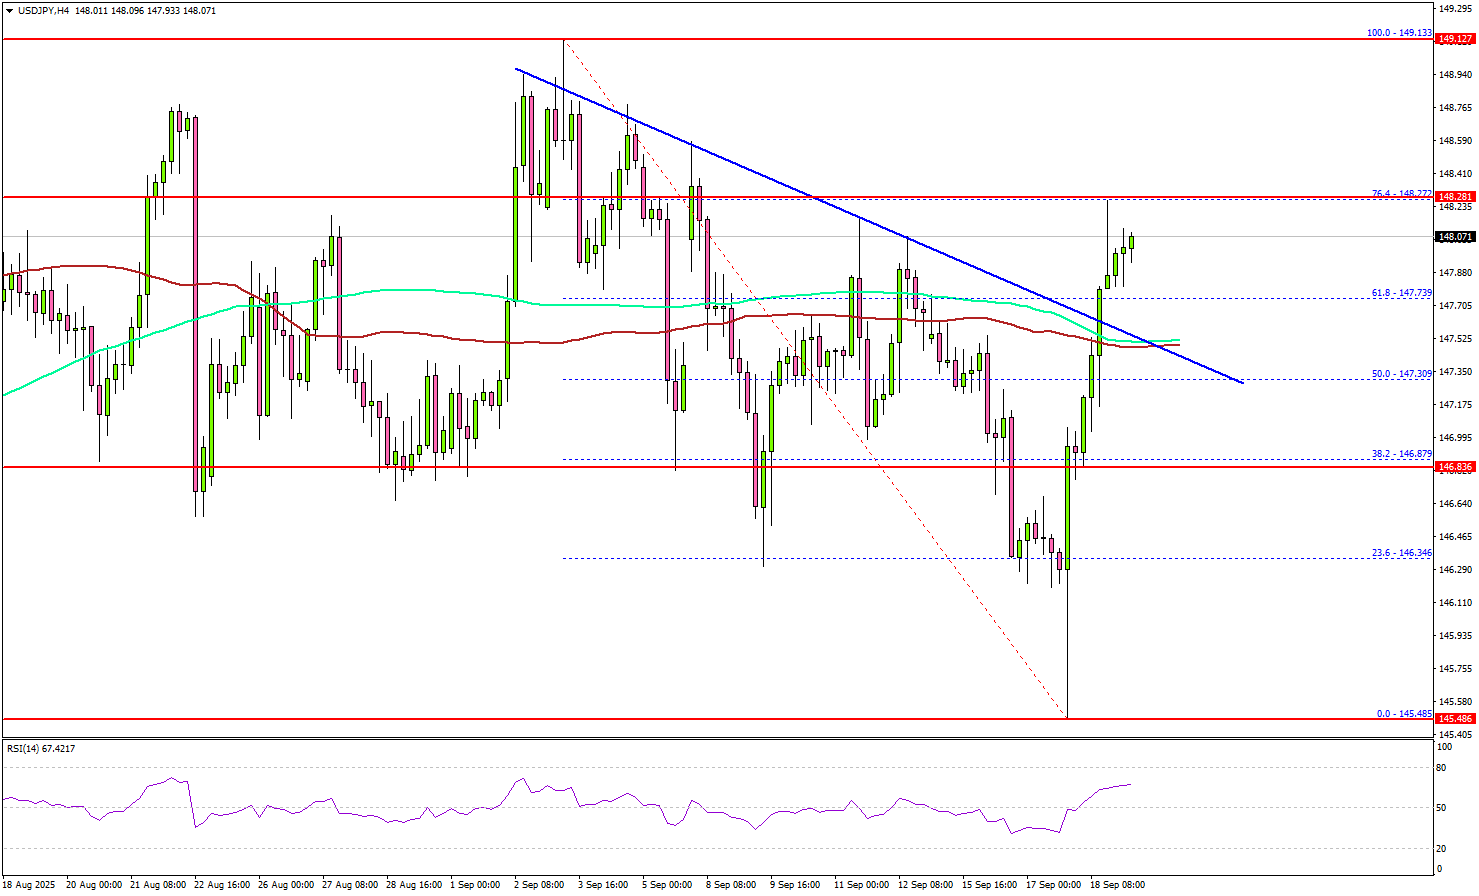
The pair settled above the 147.50 level, the 100 simple moving average (red, 4-hour), and the 200 simple moving average (green, 4-hour).
On the upside, the pair could face resistance near the 148.25 level or the 76.4% Fib retracement level of the downward move from the 149.13 swing high to the 145.48 low. The first major hurdle for the bulls could be 148.50.
A close above 148.50 could set the pace for a steady recovery wave. In the stated case, the pair could rise toward 149.20, above which the bulls could aim for a move toward 148.65. Any more upsides could send the pair toward 150.00.
On the downside, immediate support is 147.50. The next key area of interest might be near the 147.20 zone. The main support could be 146.50. Any more losses might increase selling pressure and send USD/JPY toward 146.00.
Looking at EUR/USD, the pair failed to continue higher above 1.1920 and recently started a downside correction.
Upcoming Key Economic Events:
- BoJ Press Conference.
- ECB's Sleijpen speech.
- EcoFin Meeting.
- Eurogroup Meeting.