
Sample Category Title
USD/CHF Mid-Day Outlook
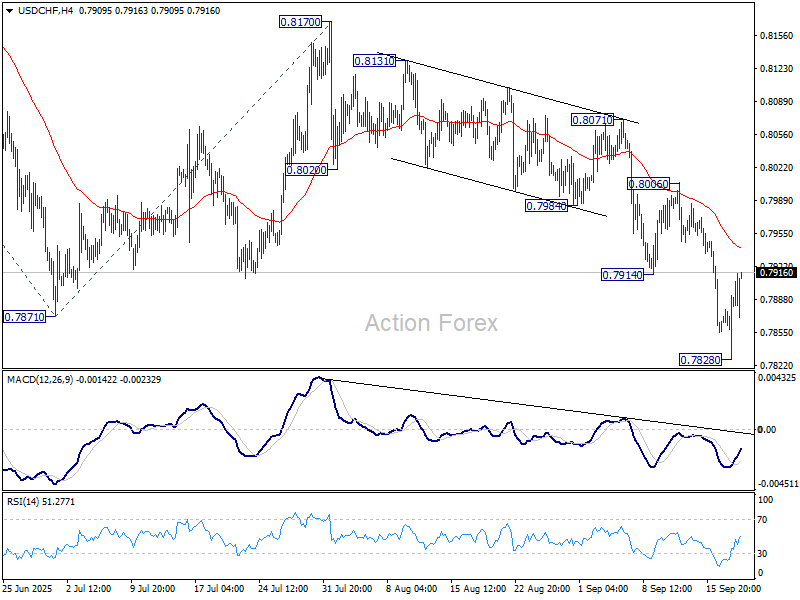
Daily Pivots: (S1) 0.7847; (P) 0.7871; (R1) 0.7912; More….
Intraday bias in USD/CHF stays neutral for the moment. Some consolidations would be seen above 0.7828 temporary low. But upside should be limited below 0.8006 resistance to bring another fall. On the downside, break of 0.7828 will resume larger down trend to 61.8% projection of 0.8475 to 0.7871 from 0.8170 at 0.7797. Firm break there will pave the way to 100% projection at 0.7566.
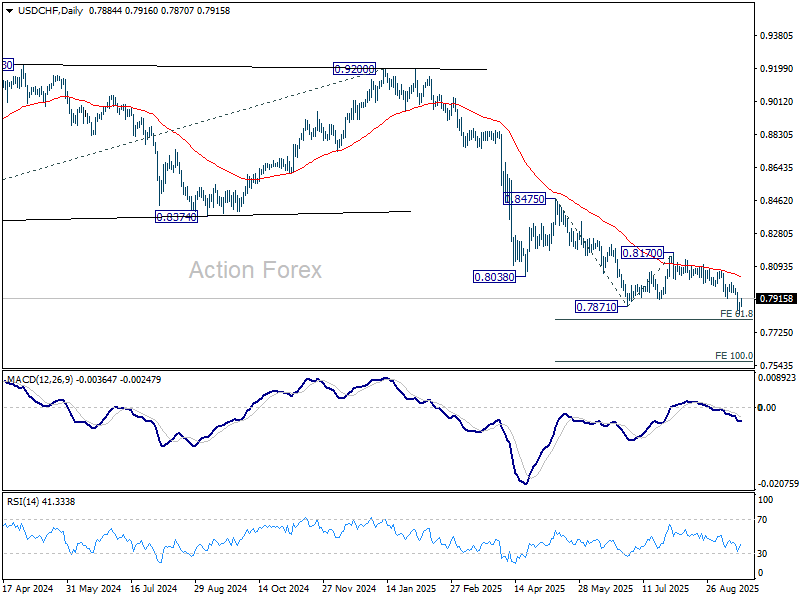
In the bigger picture, long term down trend from 1.0342 (2017 high) is still in progress. Next target is 100% projection of 1.0146 (2022 high) to 0.8332 from 0.9200 at 0.7382. In any case, outlook will stay bearish as long as 0.8332 support turned resistance holds.
EUR/USD Mid-Day Outlook
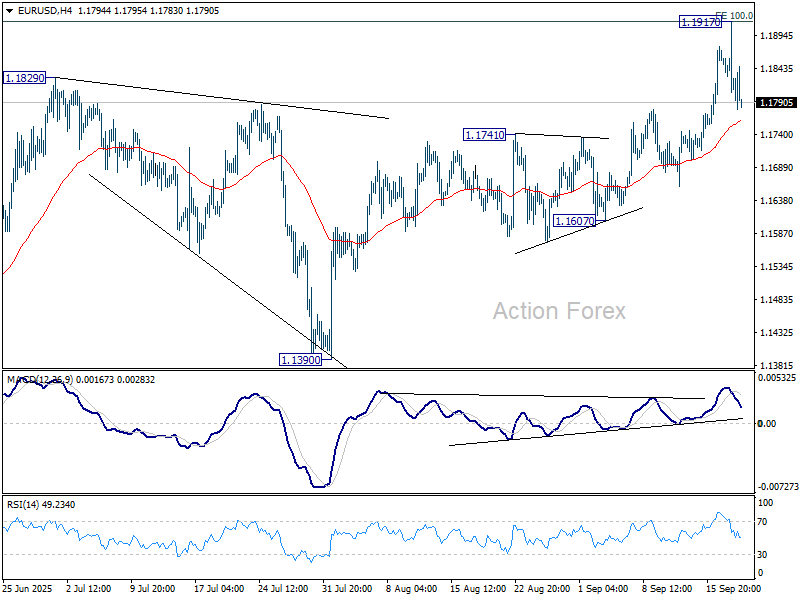
Daily Pivots: (S1) 1.1774; (P) 1.1847; (R1) 1.1885; More...
Intraday bias in EUR/USD remains neutral and more consolidations would be seen below 1.1917. Further rise is expected as long as 1.1741 resistance turned support holds. Above 1.1917 will resume larger up trend to 1.2 psychological level. However, firm break of 1.1741 should confirm short term topping, and turn bias back to the downside for 1.1607 support.
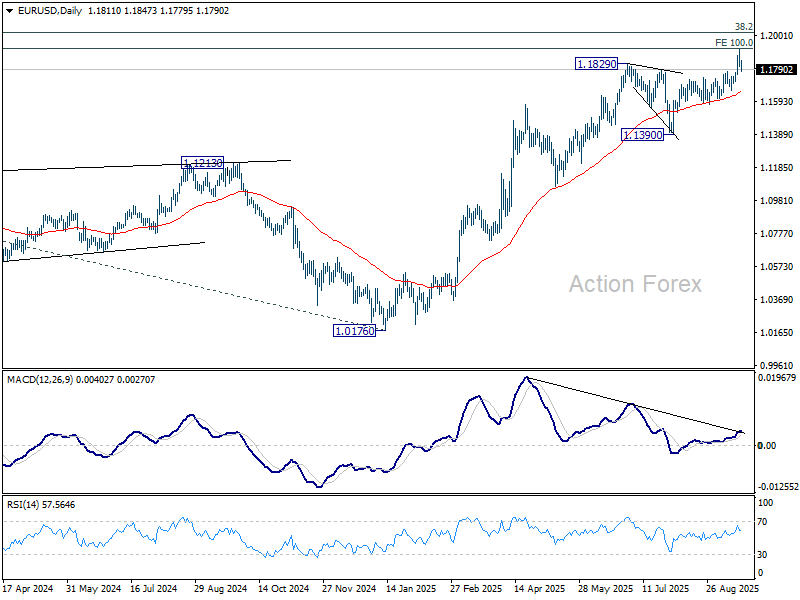
In the bigger picture, rise from 0.9534 (2022 low) long term bottom could be correcting the multi-decade downtrend or the start of a long term up trend. In either case, further rise should be seen to 100% projection of 0.9534 to 1.1274 from 1.0176 at 1.1916. Sustained break of 1.2 psychological level will carry larger bullish implications. Next target is 138.2% projection at 1.2581. This will remain the favored case as long as 55 W EMA (now at 1.1215) holds.
Bank of England Review – Near Term Rate Cuts Remain an Option
- The Bank of England (BoE) kept the Bank Rate at 4.00% as widely expected.
- The vote split was 7-2 in favour of hold, also as expected.
- The BoE did not tweak the guidance more hawkish and thus further cuts remain on the table.
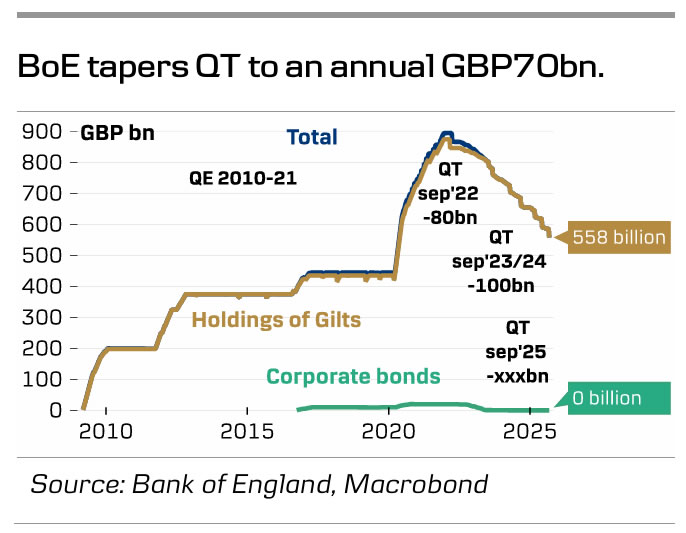
- QT was tapered from an annual pace of GBP100bn. to GBP70bn.
- The market reacted by trading Gilt yields a bit lower and EUR/GBP a bit higher, but the move later faded.
The Bank of England (BoE) kept the Bank rate at 4.00% as widely expected. The vote split was 7-2 in (keep vs. cut) with Professor Allan Taylor (who favoured a 50bp cut in August) and Swati Dhingra (notorious dove) dissenting.
The overall guidance remained unchanged, with the BoE reiterating that "a gradual and careful approach to the further withdrawal of monetary policy restraint remains appropriate". Removing this would likely have dampened expectations for near-term rate cuts further.
The annual QT decision has been a contentious issue, given the fragile Gilt market and the government's growing fiscal challenges, where interest payments are weighing still heavier on the fiscal space. The decision aligned with expectations set the annual pace of GBP70bn, backed by 7of 9 committee members, with one member arguing for a higher pace and one member for lower one.
BoE call. We continue to expect the BoE to deliver the next cut in the Bank Rate in November, followed by another cut in February, bringing the Bank Rate to 3.50%. However, we acknowledge that a November cut is highly dependent on more disinflationary signs in the September CPI data.
Market reaction. Gilt yields traded a couple of basis points lower and EUR/GBP a bit higher on the announcement, likely due to the absence of more hawkish guidance from the BoE. However, the initial reaction was short-lived. We expect EUR/GBP to move higher towards 0.89 on a 6-12-month horizon on a weakening of the UK growth outlook and a positive correlation to a USD-negative environment.
GBP/USD Mid-Day Outlook
Daily Pivots: (S1) 1.3588; (P) 1.3657; (R1) 1.3694; More...
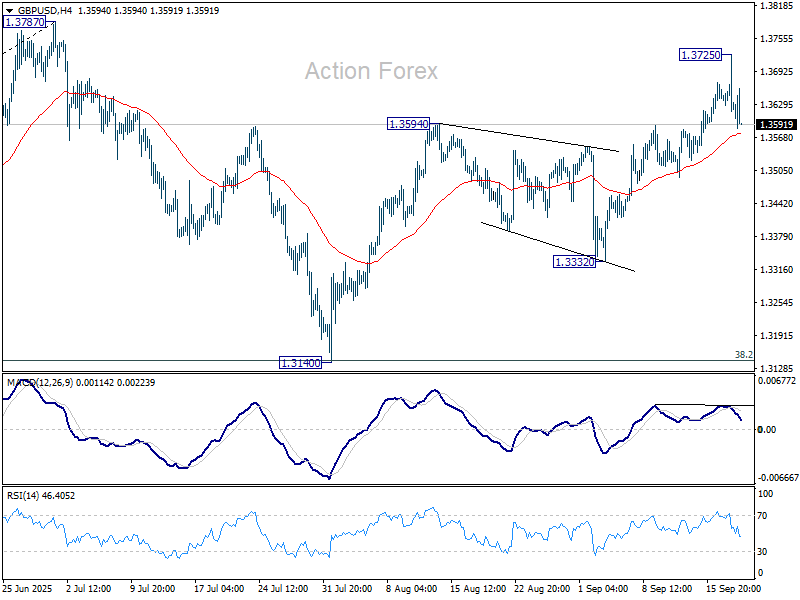
Intraday bias in GBP/USD remains neutral and more consolidations could be seen below 1.3725. Further rise is expected as long as 55 D EMA (now at 1.3488) holds. Above 1.3725 will bring retest of 1.3787 high first. Decisive break there will resume larger up trend to 1.4004 projection level. However, sustained break of 55 D EMA will indicate that corrective pattern from 1.3787 is extending with another falling leg, and bring deeper fall to 1.3332 support and below.
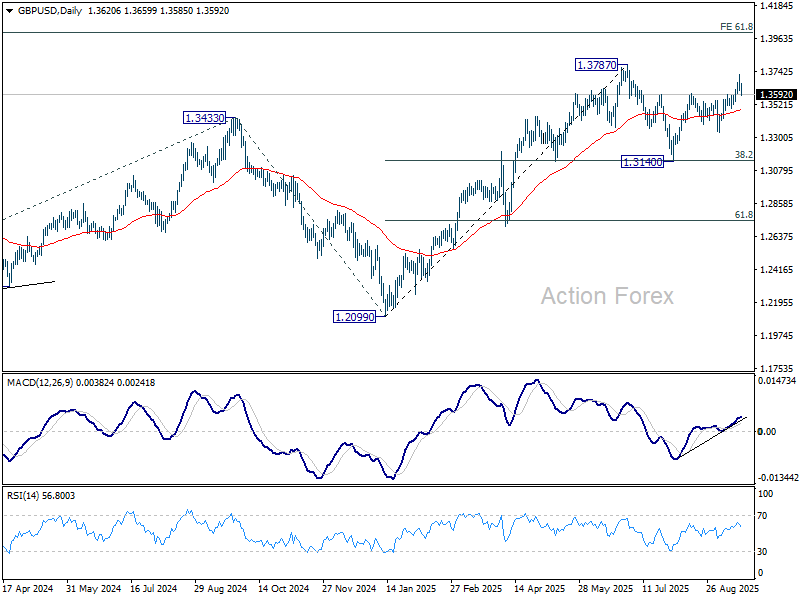
In the bigger picture, up trend from 1.3051 (2022 low) is in progress. Next medium term target is 61.8% projection of 1.0351 to 1.3433 from 1.2099 at 1.4004. Outlook will now stay bullish as long as 55 W EMA (now at 1.3151) holds, even in case of deep pullback.

Sterling Holds Ground After BoE, Dollar Loses Momentum
Sterling traded steadily mixed today, showing little reaction to the BoE’s decision to hold rates at 4.00%. The 7–2 vote leaned slightly dovish, with Swati Dhingra and Alan Taylor backing a 25bps cut, but the outcome was broadly expected given their well-established dovish leanings. Importantly, the MPC’s statement flagged that medium-term inflation risks remain “prominent,” sending a clear signal that policymakers are not yet comfortable opening the door to more near-term easing.
For markets, the key question is whether November will deliver a cut. On that, the announcement offered little clarity. Progress in services and core disinflation remains uneven, and policymakers may conclude there is insufficient evidence by November to justify a move.
Another complication is fiscal policy. The UK government is scheduled to present its budget in late November, and some MPC members may prefer to wait until the impact of tax and spending plans is clearer before adjusting interest rates. That raises the risk that a December or early-2026 move may be more likely.
On the broader FX board, Kiwi remains the weakest performer of the week after a sharp GDP miss fueled calls for a 50bps RBNZ cut in October. Dollar is the second weakest, as its post-FOMC bounce shows signs of fading, while Aussie sits third from the bottom after soft jobs data.
By contrast, Swiss Franc leads as the strongest performer, followed by Euro and Loonie. Yen and Sterling sit mid-table, though Yen could slide lower if U.S. and European yields extend their rebound into week’s end.
In Europe, at the time of writng, FTSE is up 0.17%. DAX is up 1.05%. CAC is up 1.04%. UK 10-year yield is up 0.039 at 4.668. Germany 10-year yield is up 0.035 at 2.709. Earlier in Asia, Nikkei rose 1.15%. Hong Kong HSI fell -1.35%. China Shanghai SSE fell -1.15%. Singapore Strait Times fell -0.26%. Japan 10-year JGB yield rose 0.008 to 1.601.
US initial jobless claims fall back to 231k, vs exp 240k
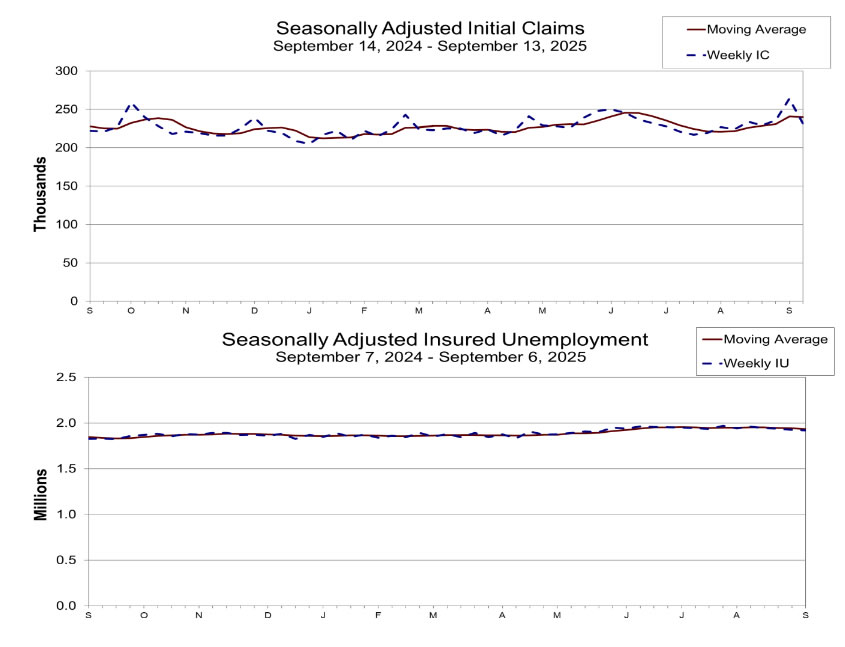
US initial jobless claims fell -33k to 231k in the week ending September 13, below expectation of 240k. Four-week moving average of initial claims fell -750 to 240k. Continuing claims fell -7k to 1920k in the week ending September 6. Four-week moving average of continuing claims fell -10k to 1933k.
BoE holds at 4.00%, two doves dissent,
BoE left its Bank Rate unchanged at 4.00% today, in line with expectations. The decision came with a slight dovish tilt, as two members of the Monetary Policy Committee—Swati Dhingra and Alan Taylor—voted for an immediate 25bps cut. The MPC also voted by 7–2 to continue reducing the stock of UK government bonds held for monetary policy purposes by GBP70 billion over the next 12 months, taking the total down to GBP488 billion.
Policymakers reiterated that a “gradual and careful” approach remains appropriate, with the timing of further easing dependent on the extent of disinflation. The statement stressed that policy is not on a pre-set course and will respond flexibly to new data.
On inflation, the Bank acknowledged progress but kept risks in focus. CPI was steady at 3.8% in August and is expected to edge slightly higher in September before trending back toward the 2% target. Wage growth has slowed from its peak and is expected to decelerate further, while services inflation has held broadly flat. Still, the BoE cautioned that medium-term upside risks remain “prominent.”, particularly if the temporary uptick in CPI feeds into wages and price-setting.
NZ economy shrinks -0.9%, bets of 50bps RBNZ cut rises
New Zealand’s economy contracted far more than expected in Q2, with GDP falling -0.9% qoq against consensus forecasts of -0.3% qoq. The release confirmed a deeper downturn, with economic activity now having declined in three of the last five quarters. The breadth of weakness points to rising headwinds that could force the RBNZ into a more aggressive easing cycle.
Goods-producing industries led the contraction with a -2.3% drop, while primary industries fell -0.7% and services output was flat. “The 0.9 percent fall in economic activity in the June 2025 quarter was broad-based with falls in 10 out of 16 industries,” said economic growth spokesperson Jason Attewell. Manufacturing was the single largest drag, contracting -3.5% in the quarter, while construction fell -1.8% following a modest rebound in Q1.
The scale of contraction triggered a wave of forecasts for deeper RBNZ easing. Westpac now expects a 50bp cut in October followed by a further 25bp reduction in November, compared with earlier projections of 25bp moves at both meetings. That would lower the OCR from the current 3.00% to 2.25% by year-end.
Australia jobs disappoint in August as employment falls -5.4k
Australia’s labor market weakened in August as total employment fell by -5.4k, against expectations for a 21.2k gain. The headline masked stark contrasts, with full-time jobs dropping by -40.9k while part-time roles increased by 35.5k. Hours worked fell -0.4% mom, underscoring signs of cooling demand for labor.
The unemployment rate held steady at 4.2% in line with forecasts, though the participation rate edged down to 66.8% from 67.0%. The data suggest that while unemployment remains low, underlying labor market conditions are softening.
GBP/USD Mid-Day Outlook
Daily Pivots: (S1) 1.3588; (P) 1.3657; (R1) 1.3694; More...
Intraday bias in GBP/USD remains neutral and more consolidations could be seen below 1.3725. Further rise is expected as long as 55 D EMA (now at 1.3488) holds. Above 1.3725 will bring retest of 1.3787 high first. Decisive break there will resume larger up trend to 1.4004 projection level. However, sustained break of 55 D EMA will indicate that corrective pattern from 1.3787 is extending with another falling leg, and bring deeper fall to 1.3332 support and below.

In the bigger picture, up trend from 1.3051 (2022 low) is in progress. Next medium term target is 61.8% projection of 1.0351 to 1.3433 from 1.2099 at 1.4004. Outlook will now stay bullish as long as 55 W EMA (now at 1.3151) holds, even in case of deep pullback.
US initial jobless claims fall back to 231k, vs exp 240k
US initial jobless claims fell -33k to 231k in the week ending September 13, below expectation of 240k. Four-week moving average of initial claims fell -750 to 240k.
Continuing claims fell -7k to 1920k in the week ending September 6. Four-week moving average of continuing claims fell -10k to 1933k.
Nasdaq 100 Analysis: Index Hits All-Time High
As the chart shows, today the Nasdaq 100 index (US Tech 100 mini on FXOpen) has, for the first time in history, climbed above the 24,500 level.
According to media reports, bullish sentiment was driven by the long-awaited Fed decision to cut interest rates for the first time in 2025.
Although the Fed also indicated it would remain cautious about further cuts, the easing acted as a bullish catalyst for the entire stock market – European equities also advanced today, with technology companies leading the way.
Technical Analysis of the Nasdaq 100 (US Tech 100 mini on FXOpen)
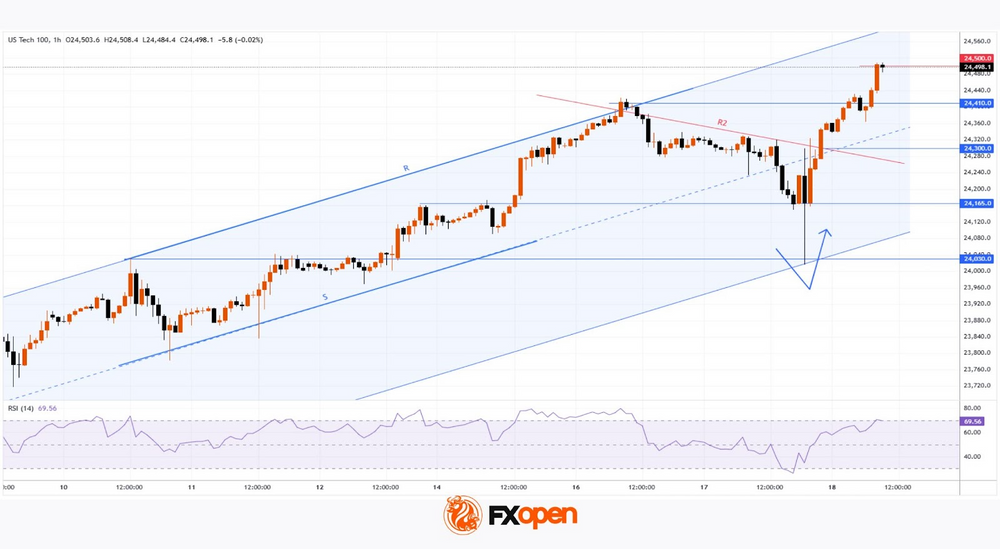
When looking at the Nasdaq 100 index (US Tech 100 mini on FXOpen) within the context of the September rally (highlighted by the blue channel), we note the following:
→ In mid-September, price action reflected market optimism, as the index traded in the upper half of the channel – with resistance at the upper boundary (R) and support at line S.
→ Yesterday’s volatility spike produced a similar move (marked with an arrow) to the one we highlighted in today’s earlier gold analysis, namely a sharp reversal from the lower boundary of the channel (essentially a bullish engulfing pattern, albeit less clear due to volatility and the chosen timeframe).
Following the reversal from the lower boundary, which unfolded aggressively (a sign of bullish conviction), the price advanced steadily, breaking through key levels:
→ the midline of the blue channel;
→ the R2 resistance line shown in red;
→ the former all-time high at 24,165.
Moreover, the index’s behaviour around 24,300 demonstrated the persistence of buyers – the price moved above a cluster of local resistances and then extended its rally.
Bearish view:
→ bullish momentum has pushed the RSI indicator into overbought zone;
→ when attempting to break above the psychological 24,500 level, the price failed to hold, suggesting a false bullish breakout.
Given the above, we could assume that optimism prevails in the market, supported by the Fed’s decision:
→ on the one hand, further gains towards the upper boundary of the blue channel may take place;
→ on the other hand, the market may be overheated and vulnerable to a correction (for instance, back towards the blue midline).
Buy and sell stocks of the world's biggest publicly-listed companies with CFDs on FXOpen’s trading platform. Open your FXOpen account now or learn more about trading share CFDs with FXOpen.
This article represents the opinion of the Companies operating under the FXOpen brand only. It is not to be construed as an offer, solicitation, or recommendation with respect to products and services provided by the Companies operating under the FXOpen brand, nor is it to be considered financial advice.
Gold Price Falls After Fed Decision
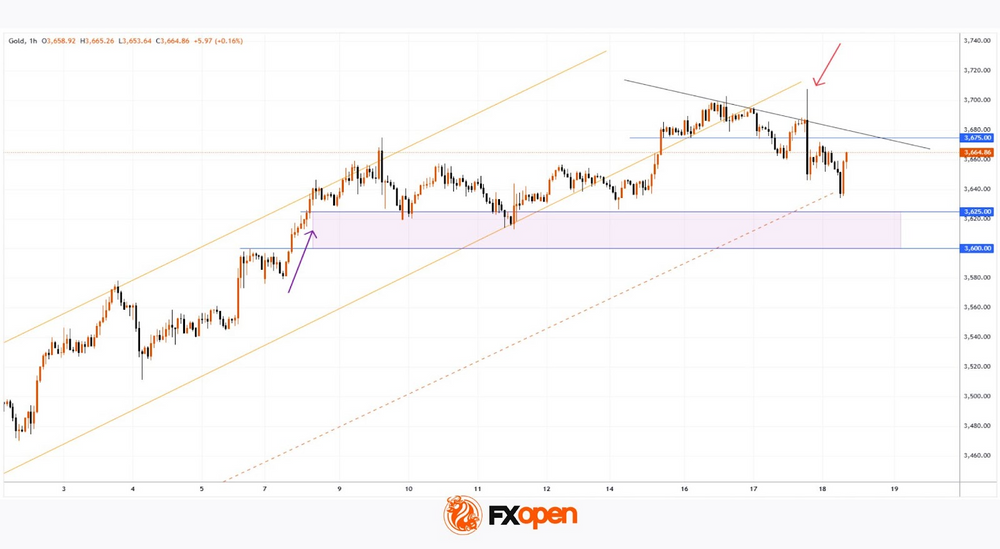
Yesterday, as expected, the Fed lowered its rate from 4.25%–4.50% to 4%–4.25%. Although rate cuts are generally seen as supportive for gold, the XAU/USD chart shows bearish price dynamics: after a short-term spike above $3700 (a new all-time high), gold retreated sharply, forming a long bearish candlestick (marked with a red arrow).
This may be explained by the fact that expectations of a rate cut had already been priced in, while at the press conference the Fed Chair struck a less “dovish” tone than the market had hoped for. While Jerome Powell did voice concerns about the labour market, he gave no clear signal of readiness for aggressive or rapid further cuts.
Technical Analysis of the XAU/USD Chart
At the start of the week, we:
→ drew a steep ascending channel (shown with orange lines);
→ suggested a potential move lower towards the orange dashed line (an additional support line plotted beneath the channel).
Indeed, the dashed line acted as support today. What are the possible scenarios?
Bearish view:
→ the long upper shadow of the candlestick marked with the arrow clearly points to strong selling pressure;
→ the price only briefly broke above the psychological $3700 level – a bull trap (or Liquidity Grab in Smart Money Concept terms);
→ $3675 has flipped from support to resistance.
Bullish view:
→ the dashed trendline has confirmed its role as support – it may help the price move towards the midline of the orange channel;
→ the $3600–$3625 area looks like solid backing. Following the rally in early September, gold repeatedly found support there without falling below it.
Considering that in early September the price was around $3450, the market still looks bullish overall. However, as we recently outlined three reasons why gold’s advance could stall, it now seems that the black line, drawn through lower lows, may serve as another bearish signal – this time on the lower timeframe.
Start trading commodity CFDs with tight spreads. Open your trading account now or learn more about trading commodity CFDs with FXOpen.
This article represents the opinion of the Companies operating under the FXOpen brand only. It is not to be construed as an offer, solicitation, or recommendation with respect to products and services provided by the Companies operating under the FXOpen brand, nor is it to be considered financial advice.
Crypto Market Has Returned to Highs, Despite Bitcoin’s Sluggishness
Market Overview
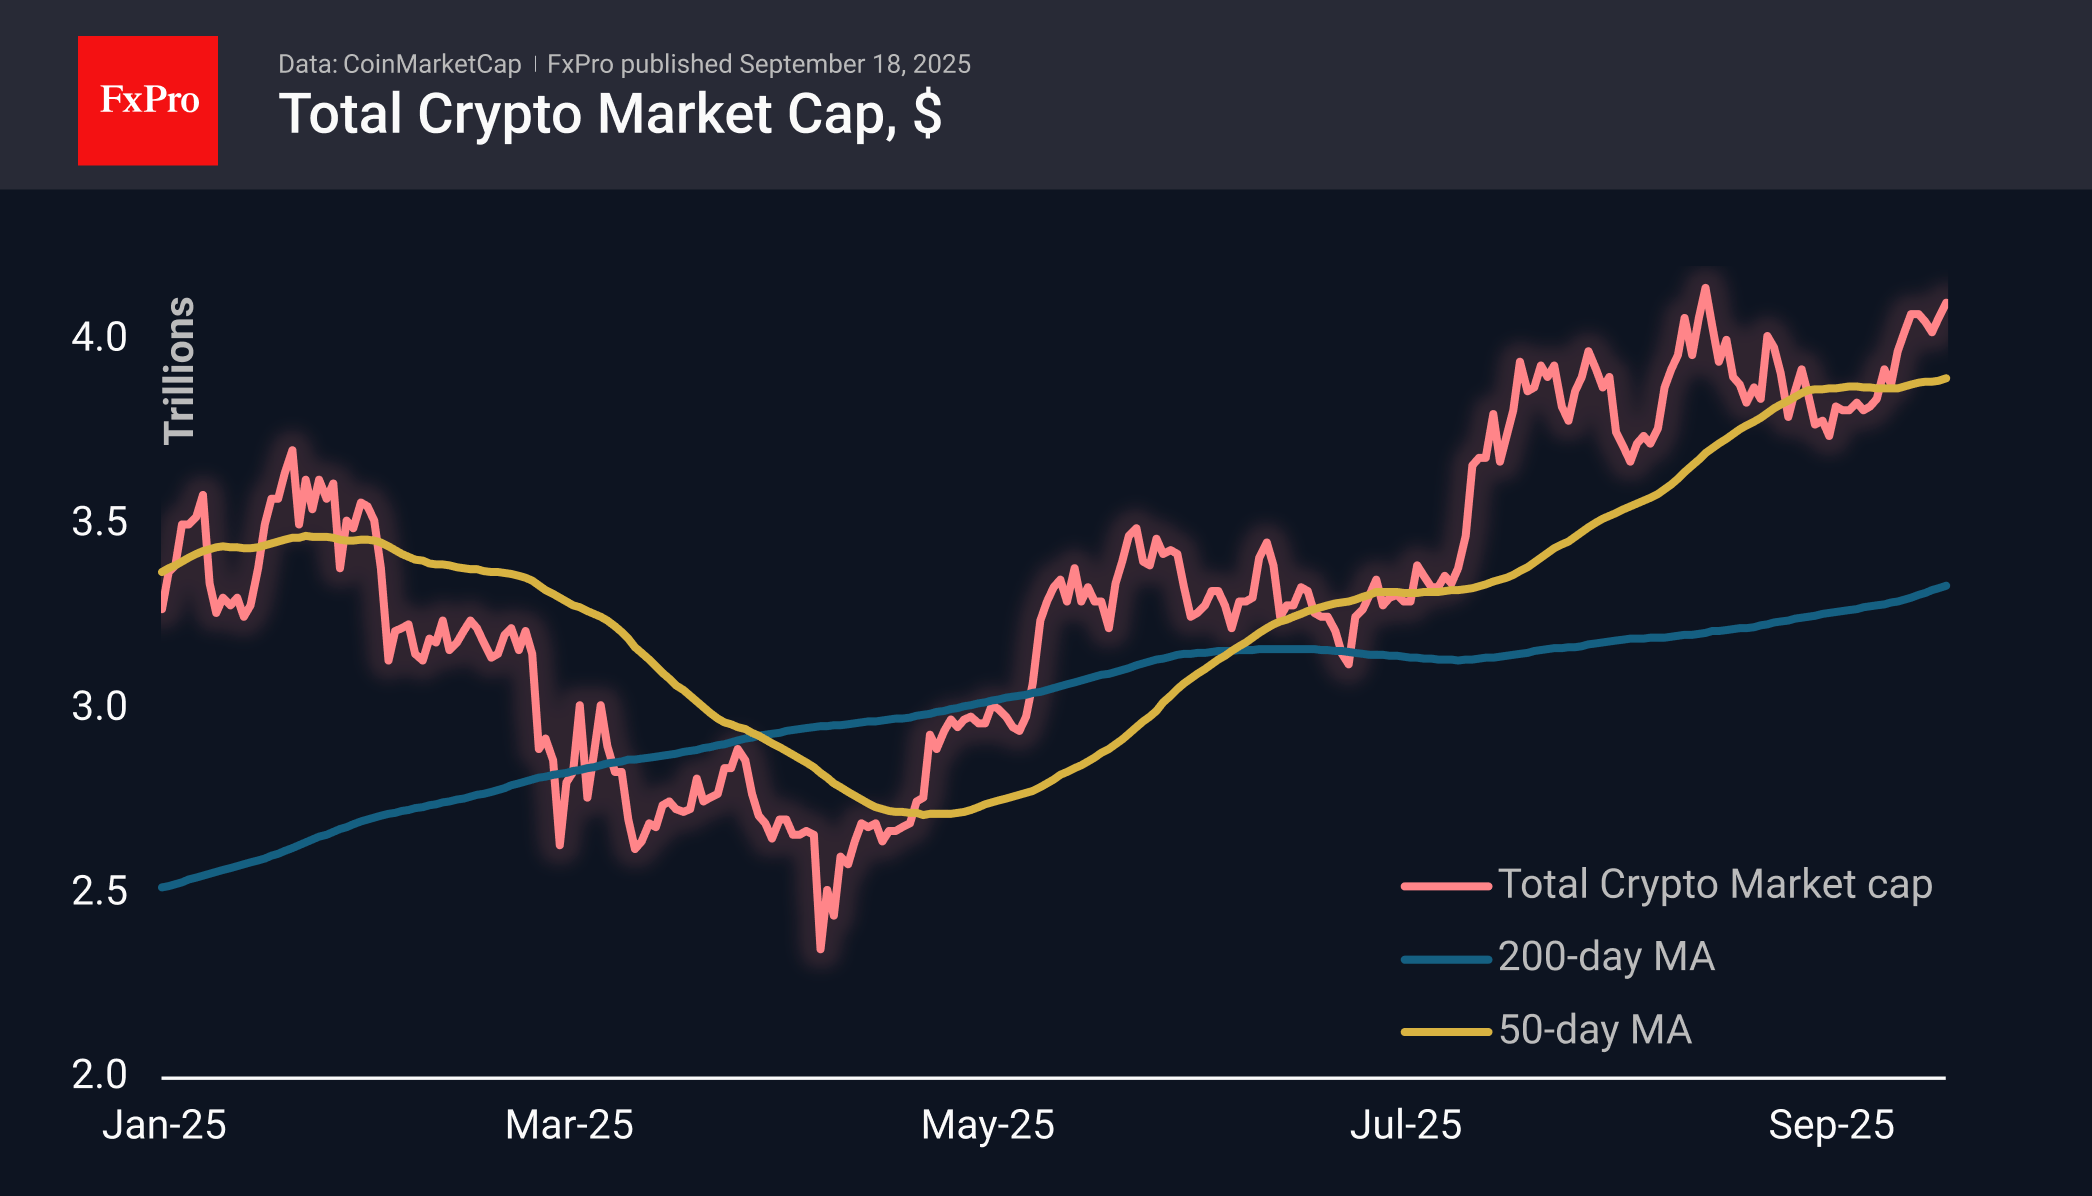
The crypto market capitalisation gained 1% in 24 hours to $4.10 billion due to a global increase in risk appetite against the backdrop of the Fed’s decision to cut rates and plans for further policy easing. The total market capitalisation is close to a record high, having been higher only briefly on 14 August. The market has been driven over the past week by altcoins such as BNB, SOL and DOGE, which have gained over 10% compared to 2.6% for BTC.
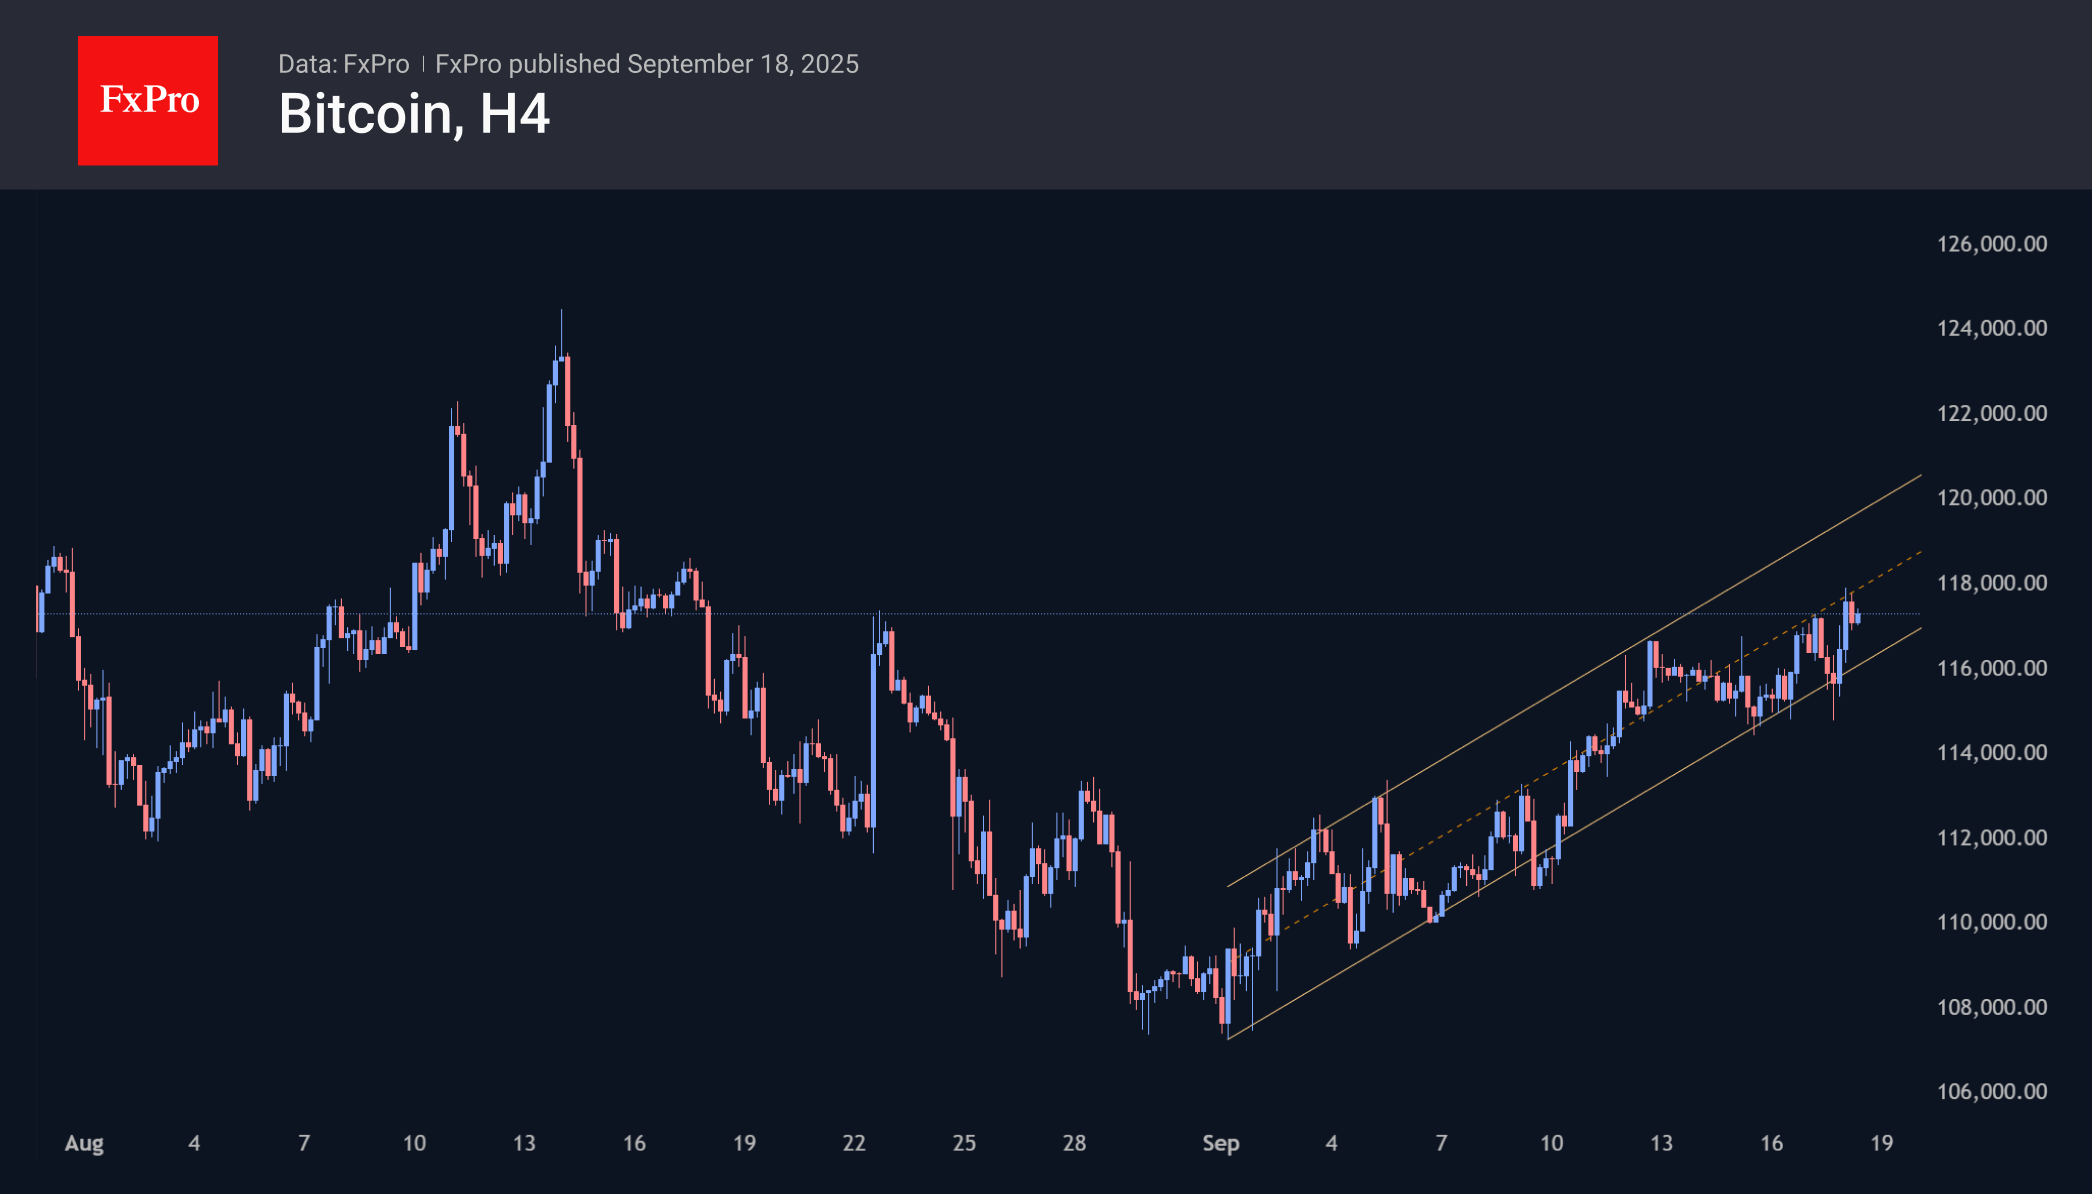
Bitcoin is trading above $117K, rising to an intraday high of $117.8K, its highest level in exactly one month. Its dynamics are well within September’s upward range, but the last four days have kept it there only thanks to the efforts of the bulls. They are buying the coin at the lower end of the channel. In contrast, many major altcoins are steadily rising.
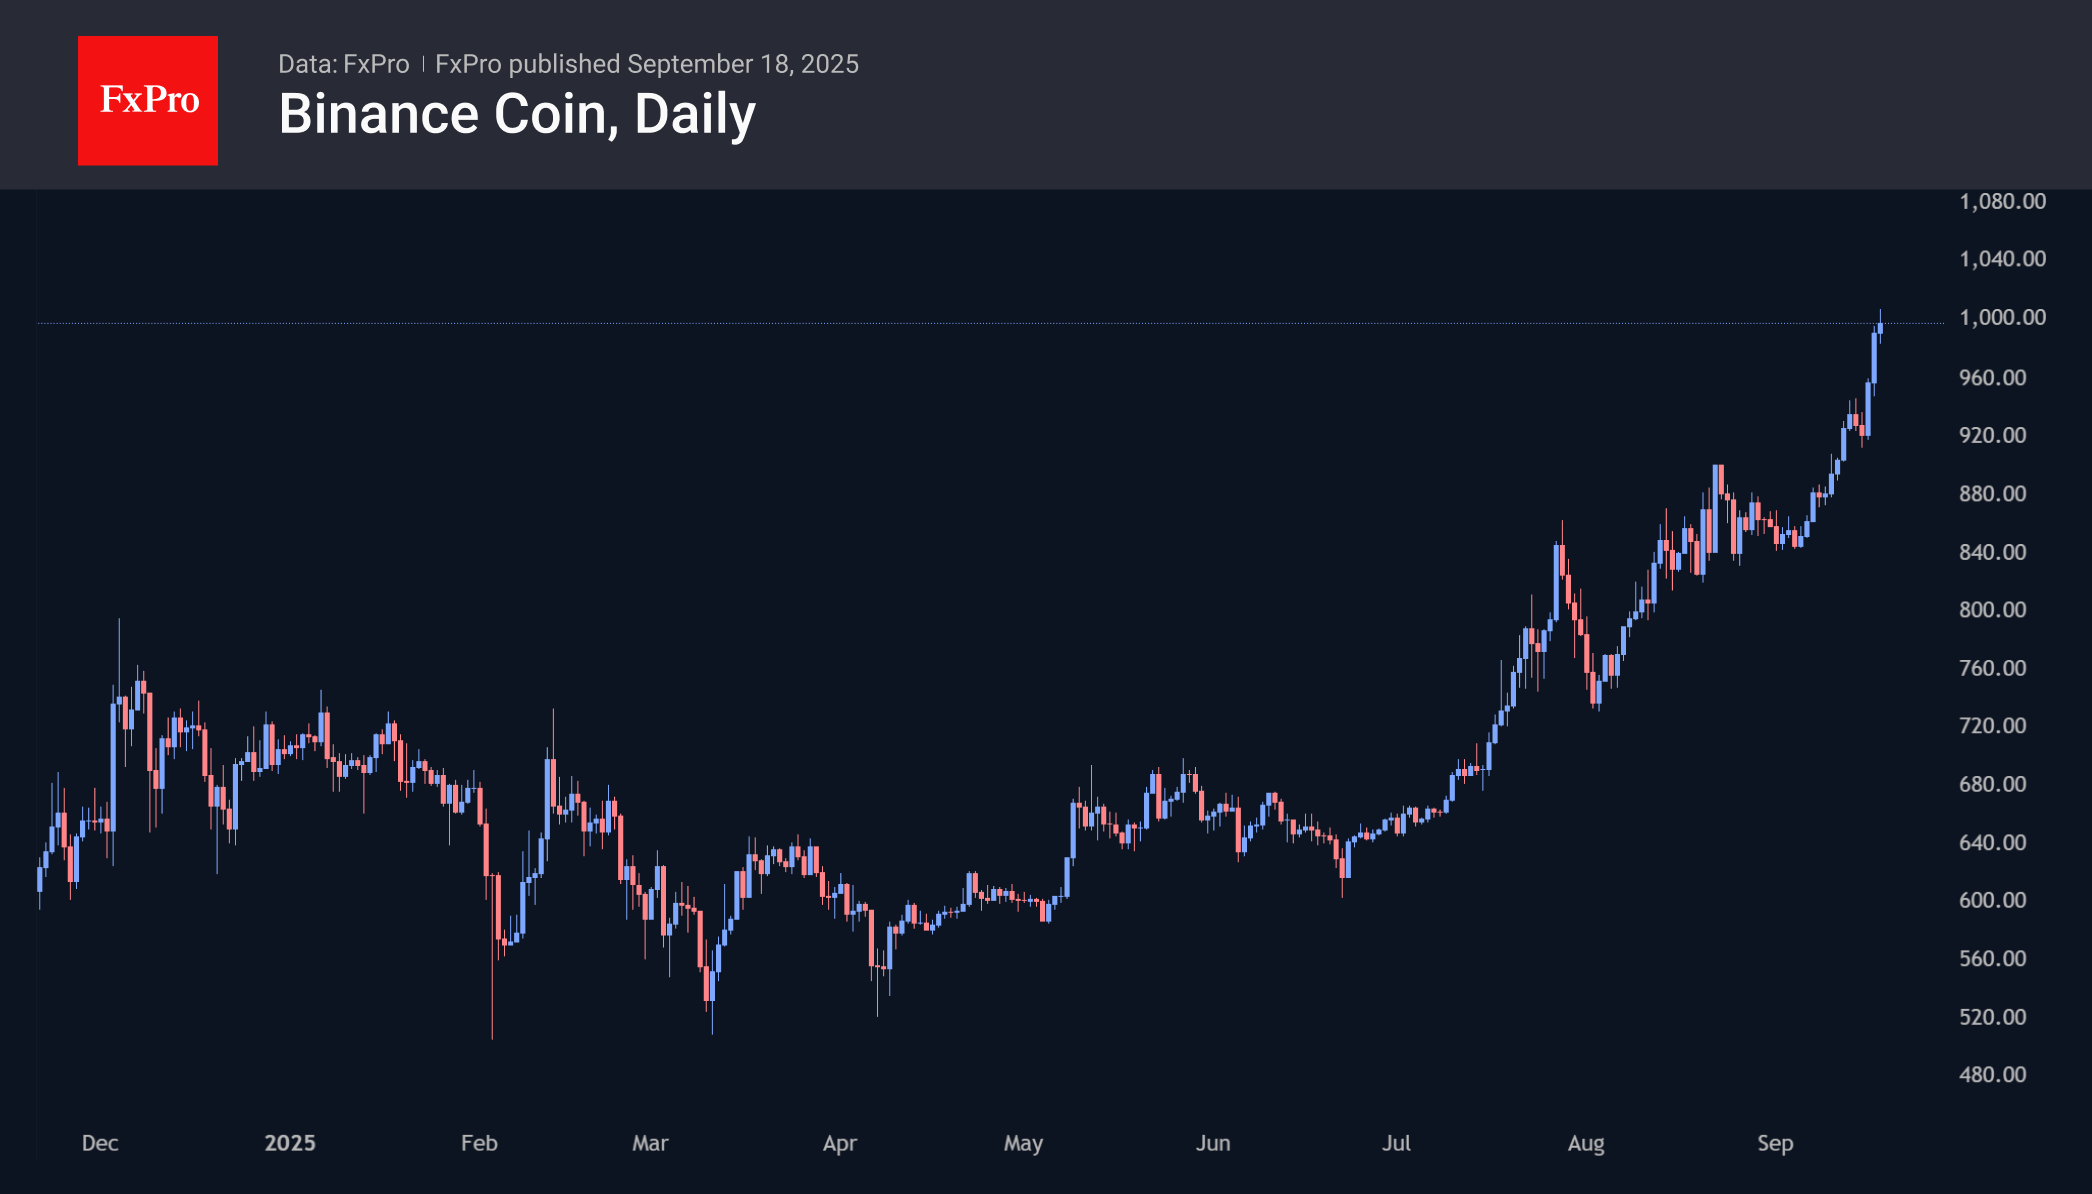
Binance Coin has surpassed the $1,000 mark, adding over 5% since the start of the day, accelerating decisively amid the background of rumours of Binance’s impending exit from US regulatory oversight. According to Bloomberg, the exchange is in talks with the US Department of Justice, which would allow it to opt out of independent oversight of the company’s activities several years ahead of schedule. As an exchange coin, BNB is closely correlated with the intensity of cryptocurrency trading, and the current update of historical highs clearly shows the mood of the retail market.
News Background
The altcoin season has begun on the crypto market. According to Blockchain Center, 75% of the top 50 cryptocurrencies have outperformed Bitcoin in terms of returns over the past 90 days. The altseason index has reached its highest level since the end of 2024.
President Trump has filed a $15 billion defamation lawsuit against the New York Times (NYT), accusing it of damaging the reputation of the TRUMP coin, Truth Social and the Trump Organisation Foundation.
The volume of purchases of the first cryptocurrency by public companies is only 1,428 BTC per day, according to K33 Research. This is the lowest figure in the last four months. Many companies are limited in their ability to raise funds for cryptocurrency purchases through the issuance of shares because they trade at a discount to the value of their crypto reserves.
The co-founder of the ETH Strategy protocol, known by the nickname Clouted, called the growth of cryptocurrencies a logical consequence of the devaluation of the US dollar. In such conditions, cryptocurrencies are the only reasonable choice for protecting savings.
Nasdaq-listed public company Forward Industries announced plans to sell $4 billion worth of shares. The company intends to use the proceeds from the sale of securities to replenish its Solana cryptocurrency reserves, among other things.
New Zealand Dollar Sinks on Soft GDP
The New Zealand dollar has posted sharp losses on Thursday. In the European session, NZD/USD is trading at 0.5904, down 0.97%.
New Zealand's GDP slides by 0.97%
New Zealand's economy took a tumble in the second quarter, declining 0.9% q/q. This was a sharp downturn from the Q1 gain of 0.9% and below the market estimate of -0.3%. The economy has contracted in three of the last five quarters. Annually, GDP declined 0.6%, unchanged from the first quarter and well below the market estimate of 0%. The New Zealand dollar is down 1% on the soft GDP reading.
The GDP report showed broad weakness across the economy as construction and manufacturing posted declines and services were flat. The economy has been hurt by weak global demand and US tariffs on New Zealand, which have been set at 15%.
The weak GDP data will put pressure on the Reserve Bank of New Zealand to lower rates before the end of the year. The RBNZ meets next month and the markets have fully priced in a rate cut, with an 82% chance of a a quarter-cut and an 18% likelihood of a half-point reduction.
Fed delivers with rate cut
The Federal Reserve lowered rates by a quarter-point on Wednesday. The decision, which was widely expected, was the first rate cut since December 2024. For the second straight time, the vote was not unanimous, as one member voted for a half-point cut.
The rate statement pointed a finger at the cooling labor market as the main reason behind the cut. In his press conference, Fed Chair Powell reiterated concern about the deteriorating job market and said that the risk of higher and more persistant inflation have eased.
Perhaps the highlight of the meeting was the 'dot plot', which charts the expected rate path of members who participated at the meeting. The dot plot indicated that most members expect two more rate cuts before the end of the year.
NZD/USD Technical
- NZDUSD has pushed below support at 0.5973 and 0.5939 and is testing support at 0.5915
- There is resistance at 0.5957 and 0.6031
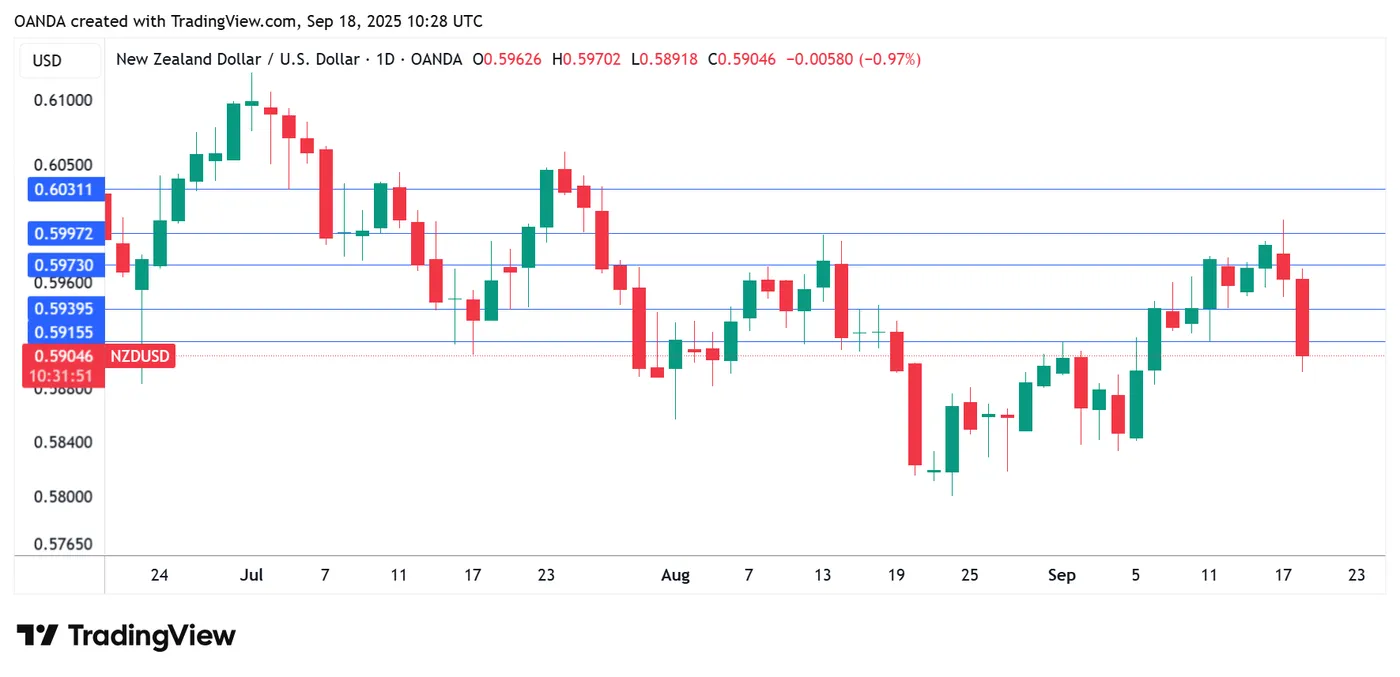
NZDUSD 1-Day Chart, September 18, 2025